| Param | Original file | Final file |
|---|---|---|
| Filename | modeM0/AS1A07_144T02_9000003340_22468cztM0_level2.evt | modeM0/AS1A07_144T02_9000003340_22468cztM0_level2_quad_clean.evt |
| Size (bytes) | 287,328,960 | 38,145,600 |
| Size | 274.0 MB | 36.4 MB |
| Events in quadrant A | 1,867,411 | 228,102 |
| Events in quadrant B | 1,933,649 | 233,875 |
| Events in quadrant C | 1,872,752 | 224,050 |
| Events in quadrant D | 2,777,828 | 209,488 |
| Mode M9 | |||
|---|---|---|---|
| Quadrant | BADHDUFLAG | Total packets | Discarded packets |
| A | 0 | 5 | 0 |
| B | 0 | 5 | 0 |
| C | 0 | 5 | 0 |
| D | 0 | 5 | 0 |
| Mode SS | |||
|---|---|---|---|
| Quadrant | BADHDUFLAG | Total packets | Discarded packets |
| A | 0 | 76 | 0 |
| B | 0 | 76 | 0 |
| C | 0 | 76 | 0 |
| D | 0 | 76 | 0 |
| Mode M0 | |||
|---|---|---|---|
| Quadrant | BADHDUFLAG | Total packets | Discarded packets |
| A | 0 | 7861 | 1 |
| B | 0 | 7894 | 1 |
| C | 0 | 7818 | 1 |
| D | 0 | 10917 | 1 |
| Quadrant | Total seconds | Saturated seconds | Saturation percentage |
|---|---|---|---|
| A | 3658 | 52 | 1.421542% |
| B | 3658 | 88 | 2.405686% |
| C | 3658 | 114 | 3.116457% |
| D | 3658 | 206 | 5.631493% |
Noise dominated data is calculated using 1-second bins in cleaned event files. If a bin has >2000 counts, and if more than 50% of those come from <1% of pixels, then it is considered to be noise-dominated and hence unusable.
| Quadrant | # 1 sec bins | Bins with >0 counts | Bins with >2000 counts | High rate bins dominated by noise | Noise dominated (total time) | Noise dominated (detector-on time) | Marked lightcurve |
|---|---|---|---|---|---|---|---|
| A | 4168 | 3659 | 0 | 0 | 0.00% | 0.00% | 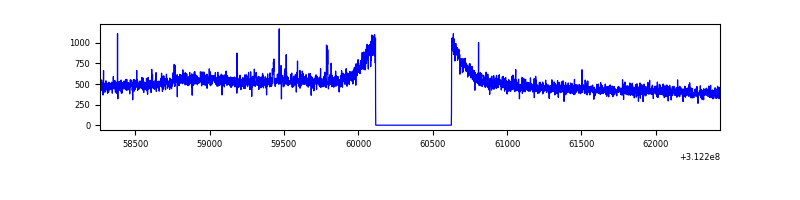 |
| B | 4168 | 3658 | 0 | 0 | 0.00% | 0.00% | 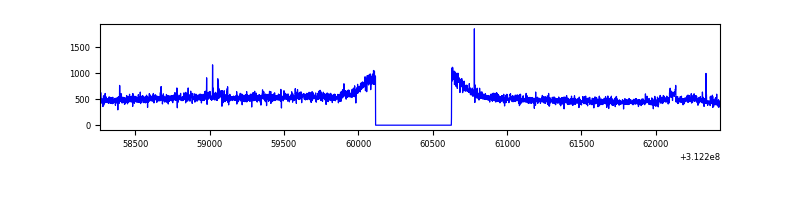 |
| C | 4168 | 3658 | 0 | 0 | 0.00% | 0.00% | 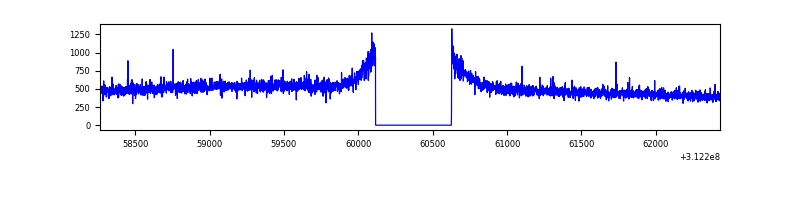 |
| D | 4168 | 3659 | 143 | 143 | 3.43% | 3.91% | 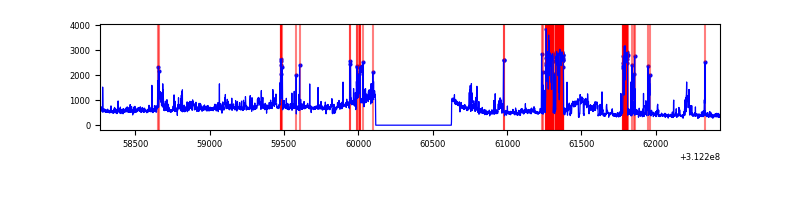 |
Top three noisy pixels from each quadrant. If the there are fewer than three noisy pixels in the level2.evt file, extra rows are filled as -1
| Pixel properties | Quadrant properties | ||||||
|---|---|---|---|---|---|---|---|
| Quadrant | DetID | PixID | Counts | Sigma | Mean | Median | Sigma |
| A | 15 | 174 | 18599 | 183.02 | 476 | 465 | 99.1 |
| A | 3 | 1 | 13504 | 131.6 | 476 | 465 | 99.1 |
| A | 13 | 254 | 5750 | 53.34 | 476 | 465 | 99.1 |
| B | 0 | 244 | 38642 | 402.49 | 479 | 466 | 94.8 |
| B | 12 | 111 | 11555 | 116.91 | 479 | 466 | 94.8 |
| B | 11 | 111 | 9925 | 99.73 | 479 | 466 | 94.8 |
| C | 14 | 238 | 71816 | 648.36 | 460 | 460 | 110.1 |
| C | 9 | 54 | 4357 | 35.41 | 460 | 460 | 110.1 |
| C | 13 | 61 | 3247 | 25.32 | 460 | 460 | 110.1 |
| D | 1 | 52 | 732268 | 6467.4 | 454 | 440 | 113.2 |
| D | 1 | 20 | 243893 | 2151.47 | 454 | 440 | 113.2 |
| D | 13 | 249 | 39883 | 348.57 | 454 | 440 | 113.2 |
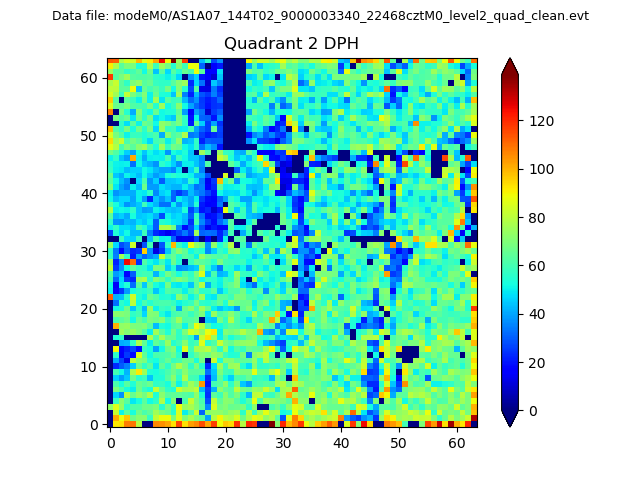
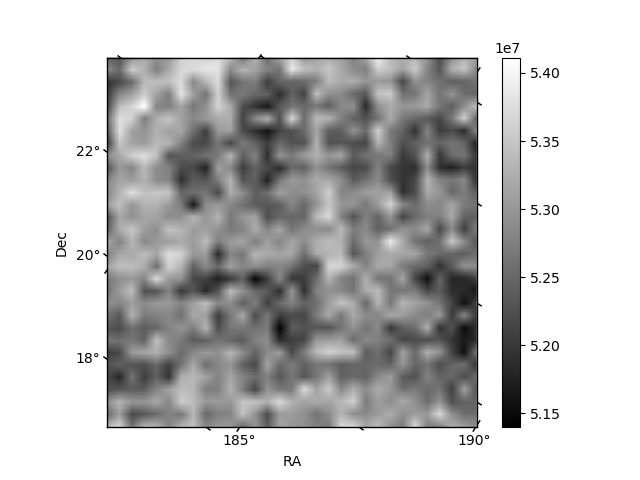
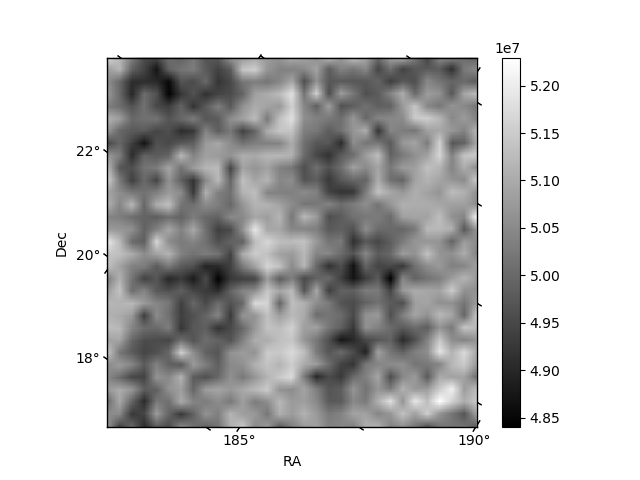
Histogram calculated using DETX and DETY for each event in the final _common_clean file
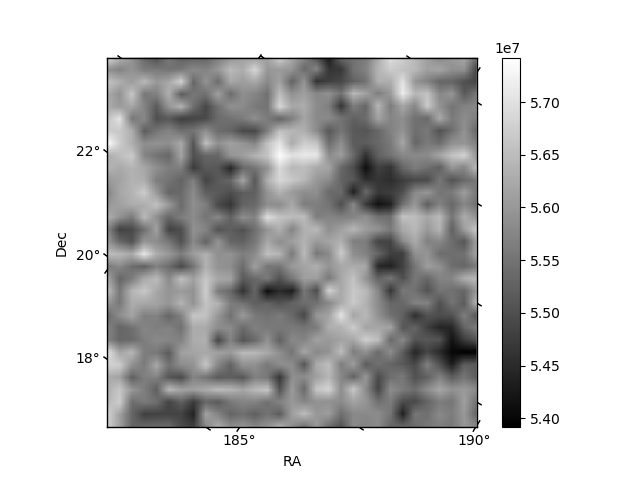
| Quadrant A | 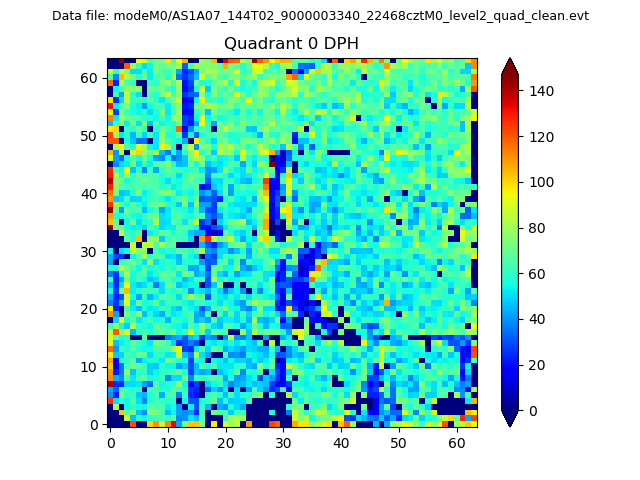 |
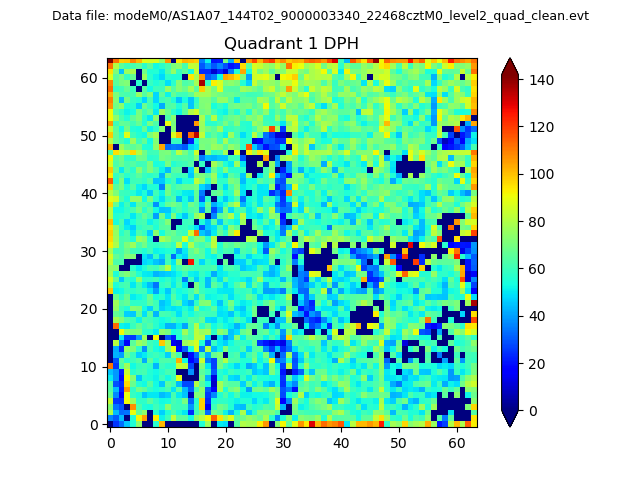 |
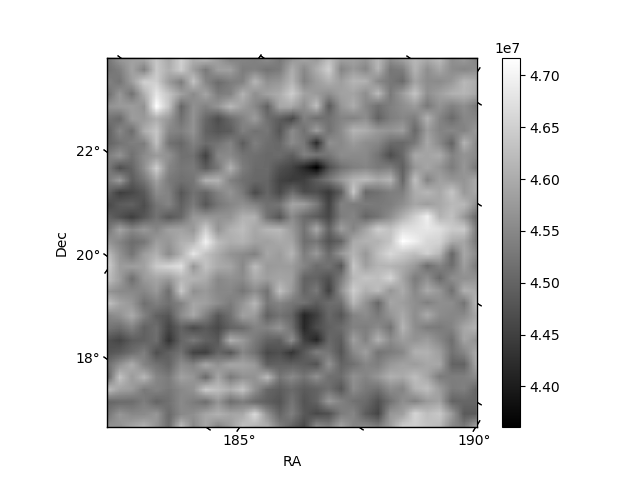
Quadrant B |
|---|---|---|---|
| Quadrant D | 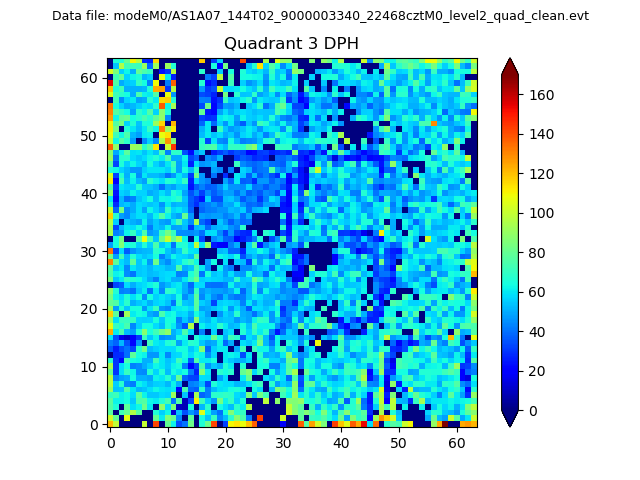 |
 |
Quadrant C |
| Plot type | Count rate plots | Images |
|---|---|---|
| Comparison with Poisson distribution Blue bars denote a histogram of data divided into 1 sec bins. Red curve is a Poisson curve with rate = median count rate of data. |
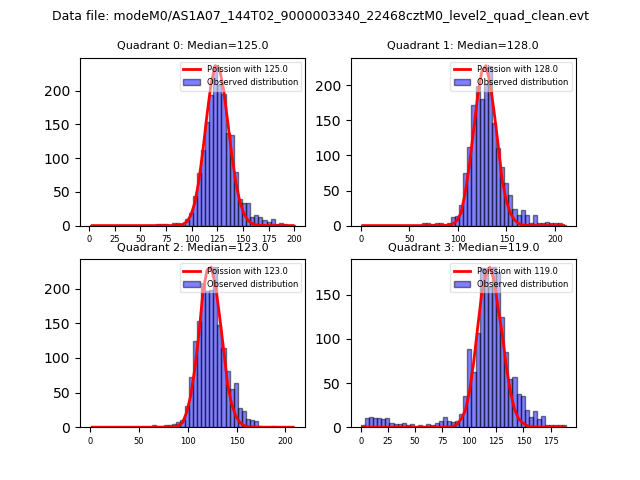 |
 |
| Quadrant-wise count rates Data is divided into 100 sec bins |
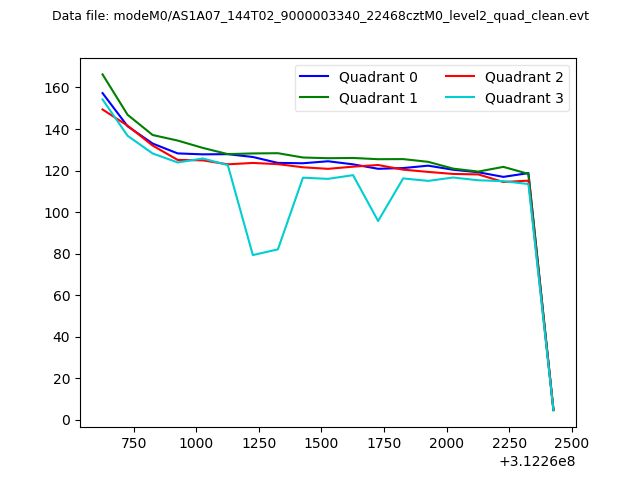 |
|
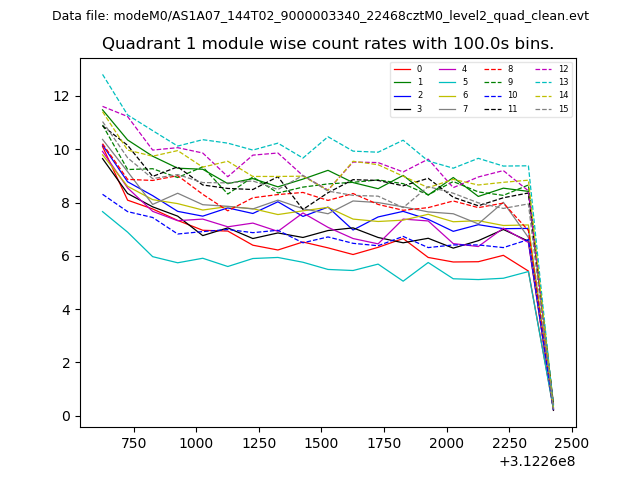
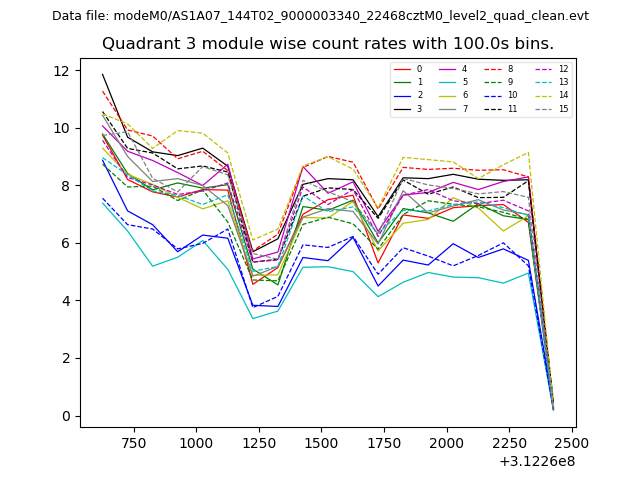
| Module-wise count rates for Quadrant A Data is divided into 100 sec bins |
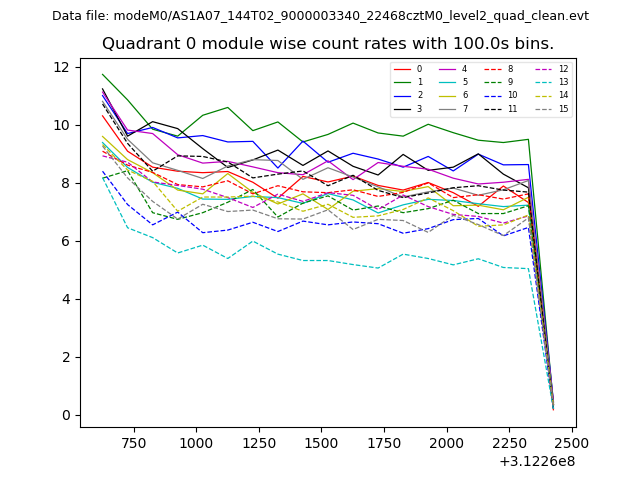 |
 |
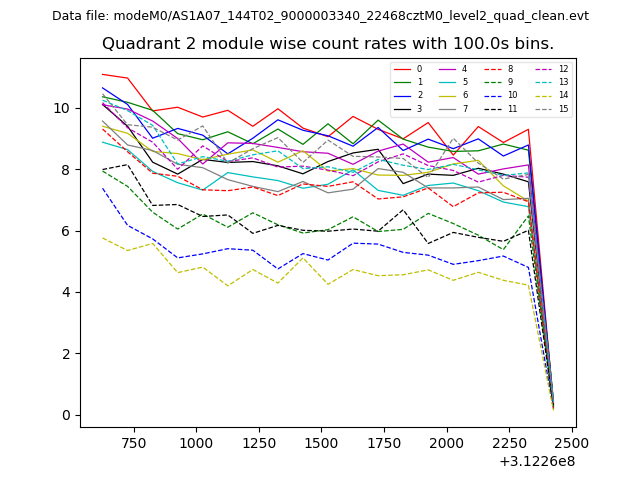
| Module-wise count rates for Quadrant B Data is divided into 100 sec bins |
 |
 |
| Module-wise count rates for Quadrant C Data is divided into 100 sec bins |
 |
 |
| Module-wise count rates for Quadrant D Data is divided into 100 sec bins |
 |
 |
| Parameter | Plot |
|---|---|
| CZT HV Monitor | 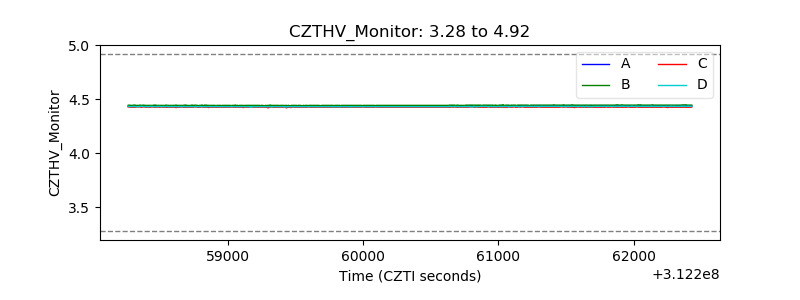 |
| D_VDD | 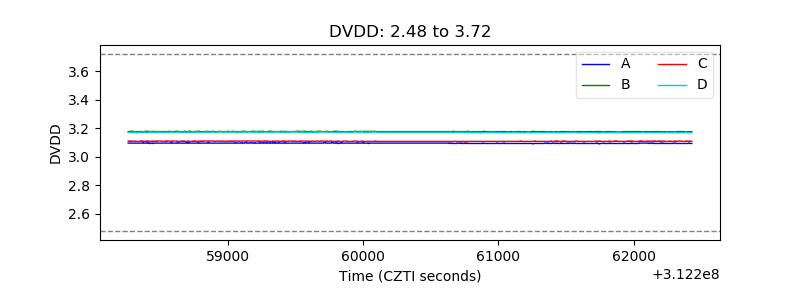 |
| Temperature 1 |  |
| Veto HV Monitor | 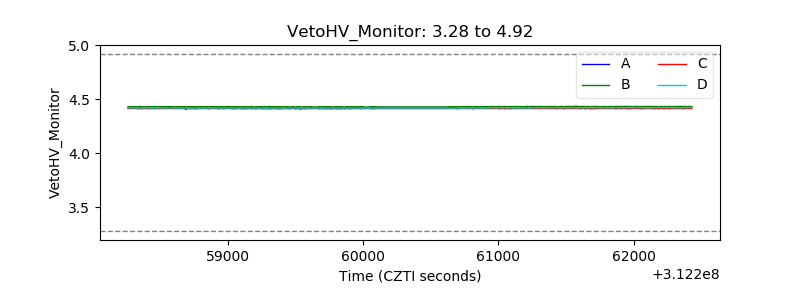 |
| Veto LLD | 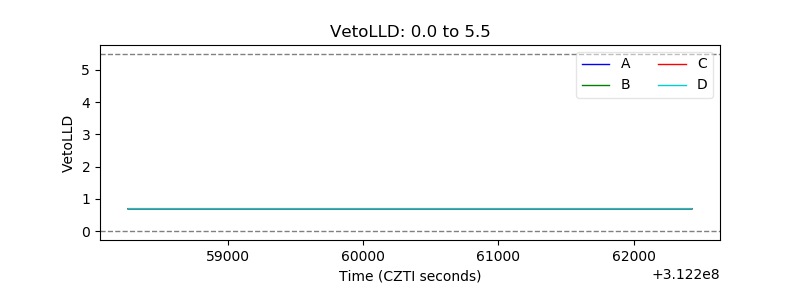 |
| Alpha Counter | 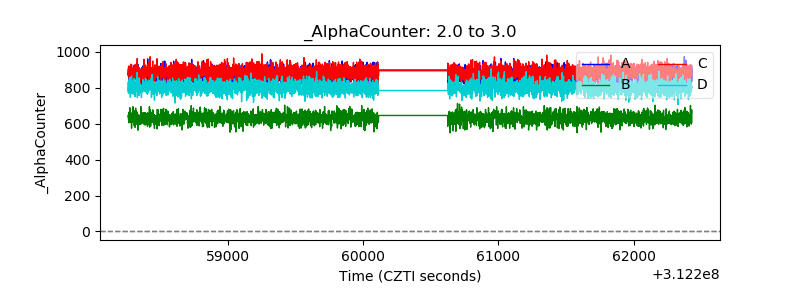 |
| _CPM_Rate | 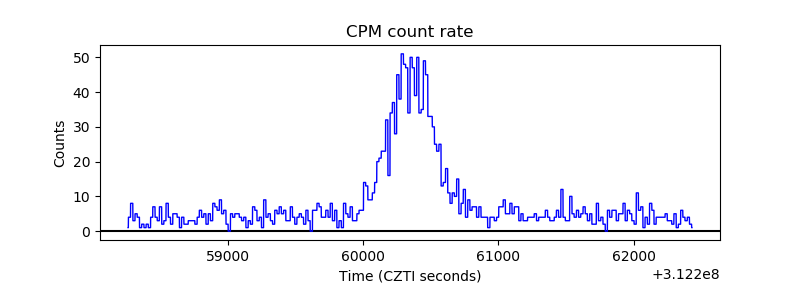 |
| CZT Counter | 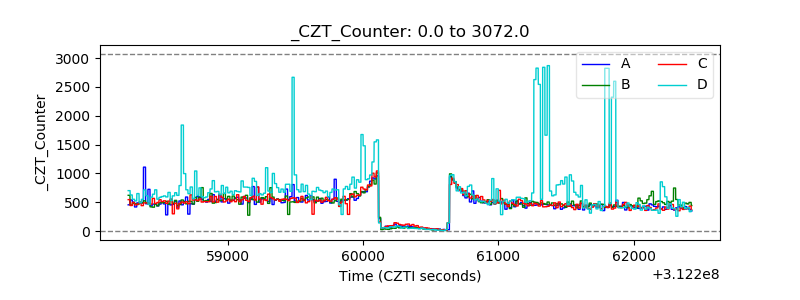 |
| +2.5 Volts monitor |  |
| +5 Volts monitor |  |
| _ROLL_ROT | 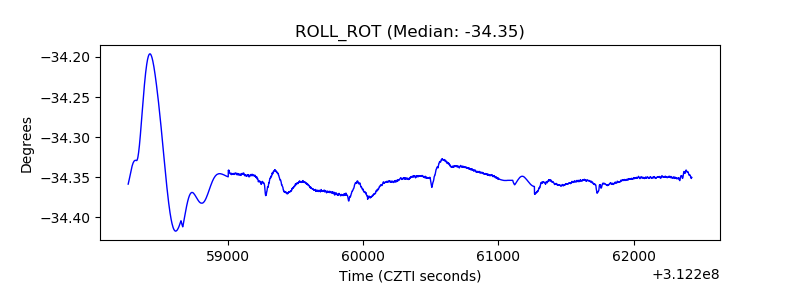 |
| _Roll_DEC | 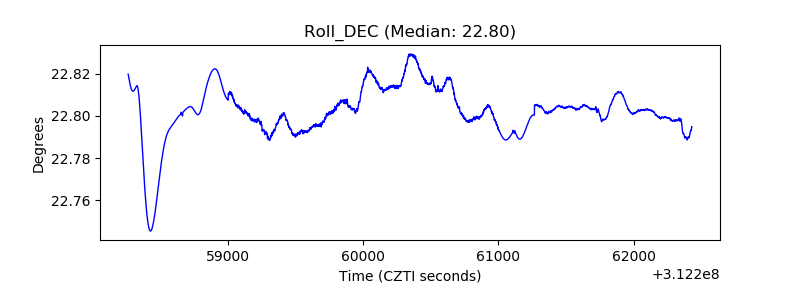 |
| _Roll_RA |  |
| Veto Counter | 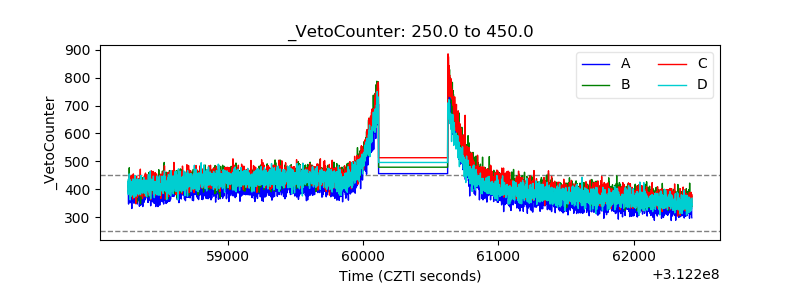 |