| Param | Original file | Final file |
|---|---|---|
| Filename | modeM0/AS1C05_006T01_9000003356_22604cztM0_level2.evt | modeM0/AS1C05_006T01_9000003356_22604cztM0_level2_quad_clean.evt |
| Size (bytes) | 453,516,480 | 92,260,800 |
| Size | 432.5 MB | 88.0 MB |
| Events in quadrant A | 3,240,779 | 592,817 |
| Events in quadrant B | 3,318,718 | 600,471 |
| Events in quadrant C | 3,251,878 | 569,231 |
| Events in quadrant D | 3,466,773 | 563,148 |
| Mode SS | |||
|---|---|---|---|
| Quadrant | BADHDUFLAG | Total packets | Discarded packets |
| A | 0 | 136 | 0 |
| B | 0 | 136 | 0 |
| C | 0 | 136 | 0 |
| D | 0 | 136 | 0 |
| Mode M0 | |||
|---|---|---|---|
| Quadrant | BADHDUFLAG | Total packets | Discarded packets |
| A | 0 | 13934 | 2 |
| B | 0 | 14052 | 2 |
| C | 0 | 13952 | 2 |
| D | 0 | 14552 | 2 |
| Mode M9 | |||
|---|---|---|---|
| Quadrant | BADHDUFLAG | Total packets | Discarded packets |
| A | 0 | 13 | 0 |
| B | 0 | 14 | 0 |
| C | 0 | 14 | 0 |
| D | 0 | 14 | 0 |
| Quadrant | Total seconds | Saturated seconds | Saturation percentage |
|---|---|---|---|
| A | 6720 | 51 | 0.758929% |
| B | 6720 | 60 | 0.892857% |
| C | 6720 | 93 | 1.383929% |
| D | 6720 | 29 | 0.431548% |
Noise dominated data is calculated using 1-second bins in cleaned event files. If a bin has >2000 counts, and if more than 50% of those come from <1% of pixels, then it is considered to be noise-dominated and hence unusable.
| Quadrant | # 1 sec bins | Bins with >0 counts | Bins with >2000 counts | High rate bins dominated by noise | Noise dominated (total time) | Noise dominated (detector-on time) | Marked lightcurve |
|---|---|---|---|---|---|---|---|
| A | 7680 | 6721 | 0 | 0 | 0.00% | 0.00% | 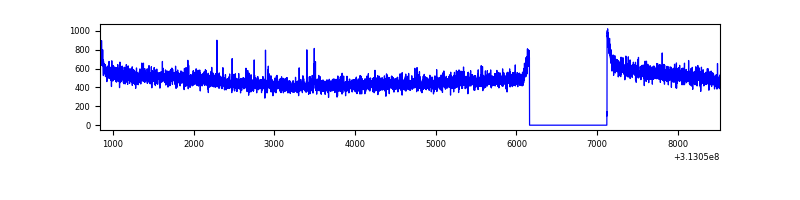 |
| B | 7680 | 6721 | 0 | 0 | 0.00% | 0.00% | 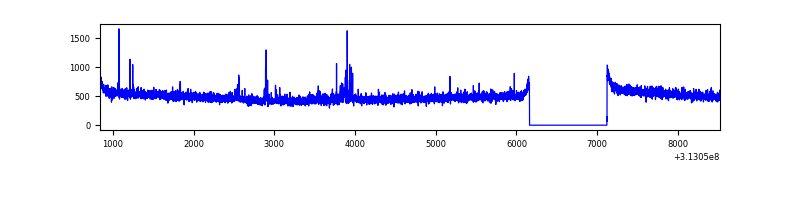 |
| C | 7680 | 6721 | 0 | 0 | 0.00% | 0.00% | 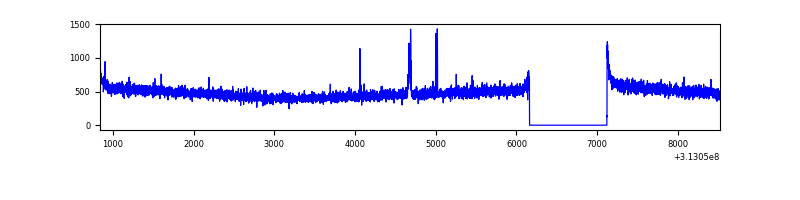 |
| D | 7680 | 6721 | 1 | 1 | 0.01% | 0.01% | 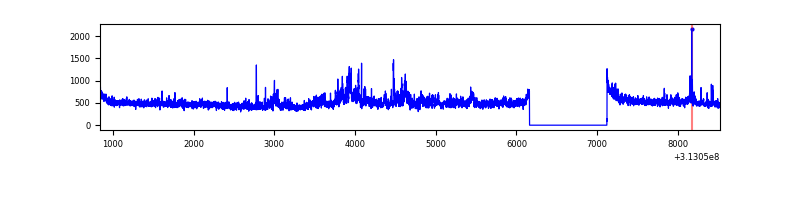 |
Top three noisy pixels from each quadrant. If the there are fewer than three noisy pixels in the level2.evt file, extra rows are filled as -1
| Pixel properties | Quadrant properties | ||||||
|---|---|---|---|---|---|---|---|
| Quadrant | DetID | PixID | Counts | Sigma | Mean | Median | Sigma |
| A | 13 | 254 | 10219 | 55.22 | 839 | 821 | 170.2 |
| A | 0 | 226 | 7330 | 38.24 | 839 | 821 | 170.2 |
| A | 14 | 238 | 7277 | 37.93 | 839 | 821 | 170.2 |
| B | 0 | 229 | 34966 | 211.98 | 833 | 813 | 161.1 |
| B | 12 | 111 | 19688 | 117.15 | 833 | 813 | 161.1 |
| B | 11 | 111 | 17439 | 103.19 | 833 | 813 | 161.1 |
| C | 14 | 238 | 128212 | 689.87 | 792 | 798 | 184.7 |
| C | 10 | 22 | 29104 | 153.26 | 792 | 798 | 184.7 |
| C | 0 | 10 | 5857 | 27.39 | 792 | 798 | 184.7 |
| D | 12 | 227 | 318535 | 1613.36 | 811 | 785 | 196.9 |
| D | 1 | 52 | 63125 | 316.53 | 811 | 785 | 196.9 |
| D | 2 | 234 | 25074 | 123.33 | 811 | 785 | 196.9 |
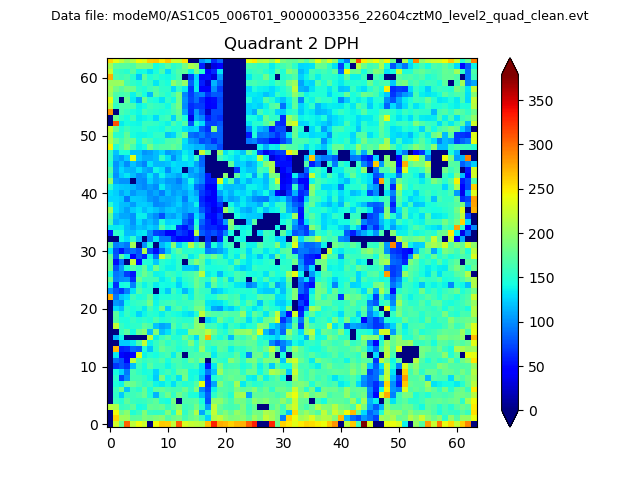
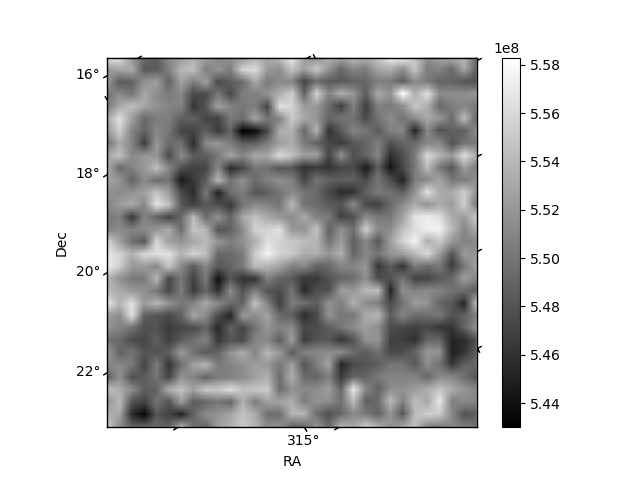
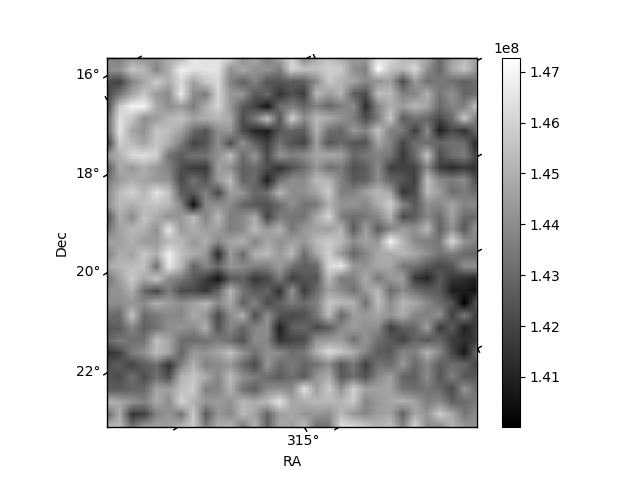
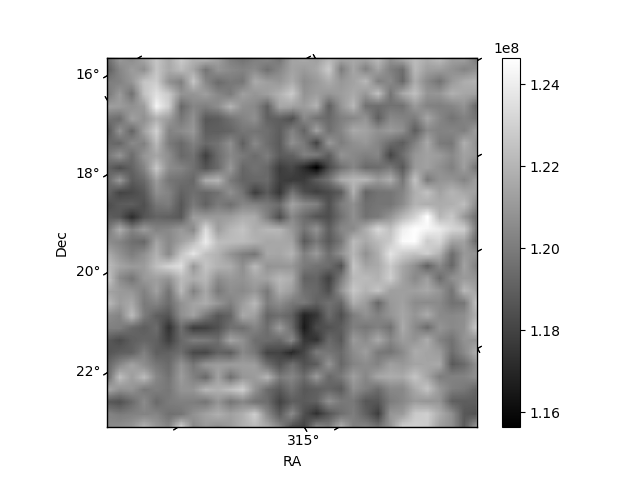
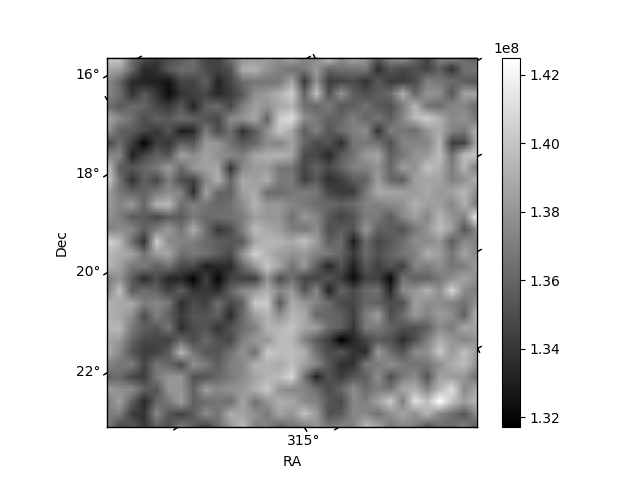
Histogram calculated using DETX and DETY for each event in the final _common_clean file
| Quadrant A | 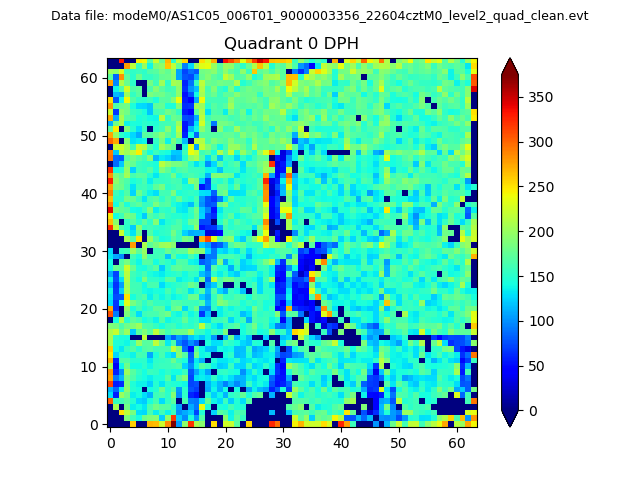 |
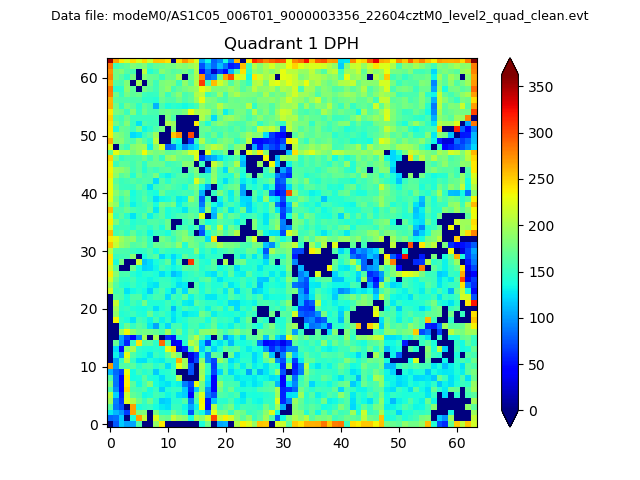 |
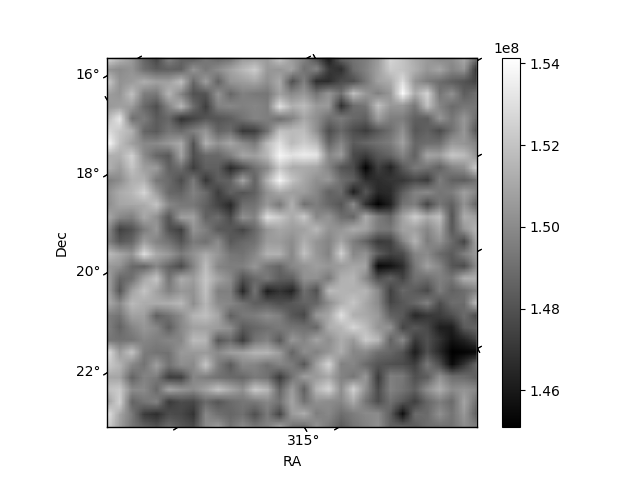
Quadrant B |
|---|---|---|---|
| Quadrant D | 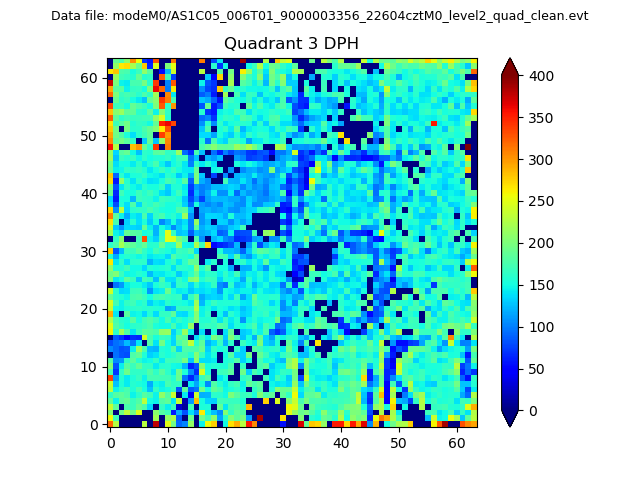 |
 |
Quadrant C |
| Plot type | Count rate plots | Images |
|---|---|---|
| Comparison with Poisson distribution Blue bars denote a histogram of data divided into 1 sec bins. Red curve is a Poisson curve with rate = median count rate of data. |
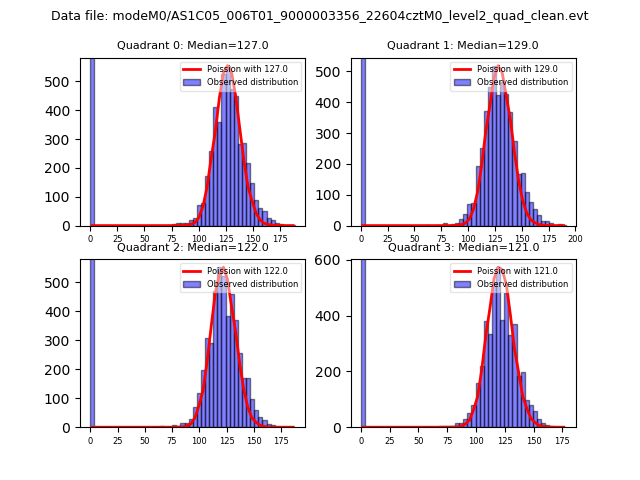 |
 |
| Quadrant-wise count rates Data is divided into 100 sec bins |
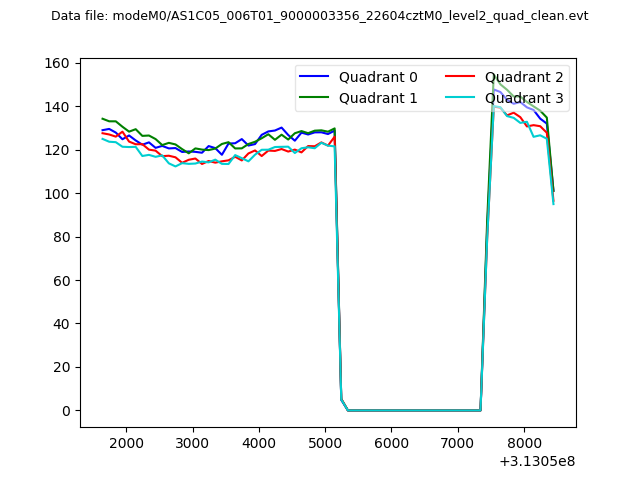 |
|
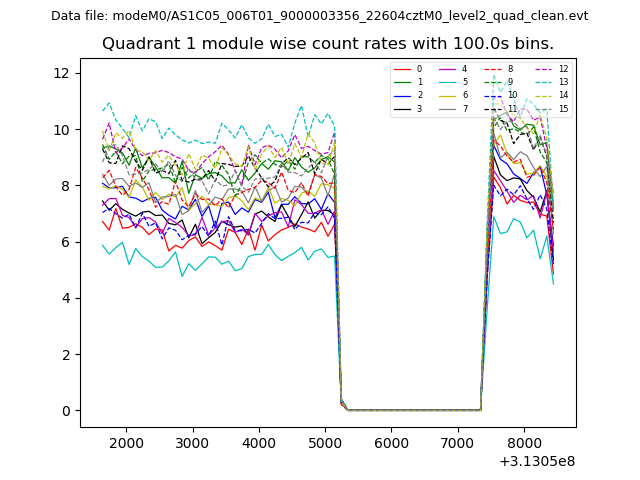
| Module-wise count rates for Quadrant A Data is divided into 100 sec bins |
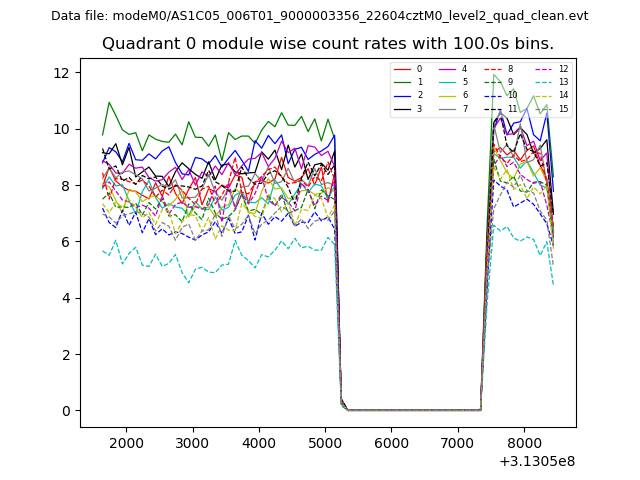 |
 |
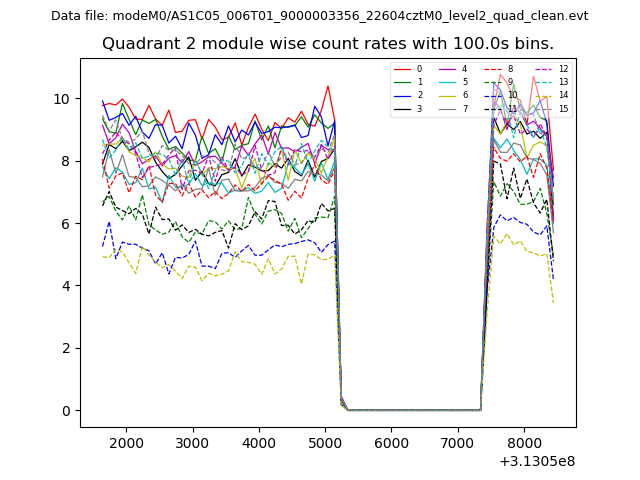
| Module-wise count rates for Quadrant B Data is divided into 100 sec bins |
 |
 |
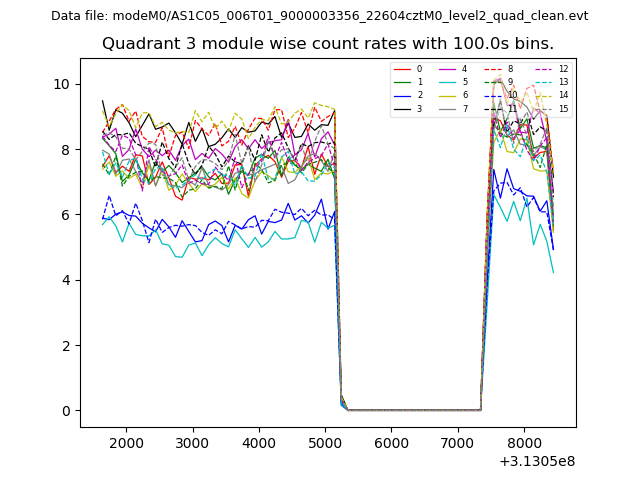
| Module-wise count rates for Quadrant C Data is divided into 100 sec bins |
 |
 |
| Module-wise count rates for Quadrant D Data is divided into 100 sec bins |
 |
 |
| Parameter | Plot |
|---|---|
| CZT HV Monitor | 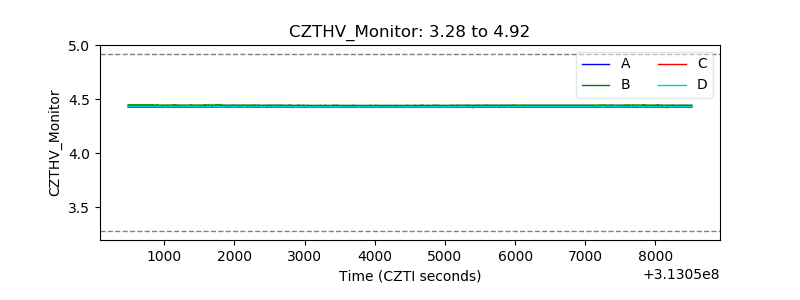 |
| D_VDD | 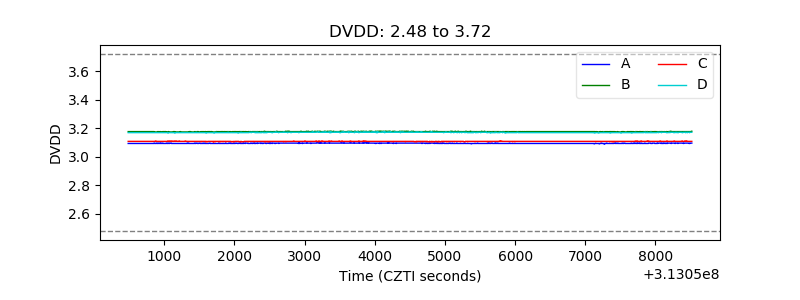 |
| Temperature 1 | 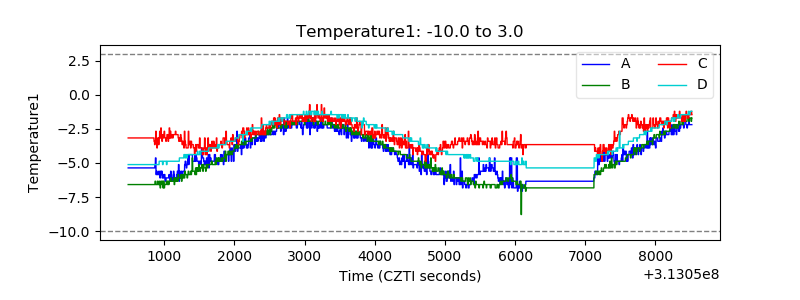 |
| Veto HV Monitor | 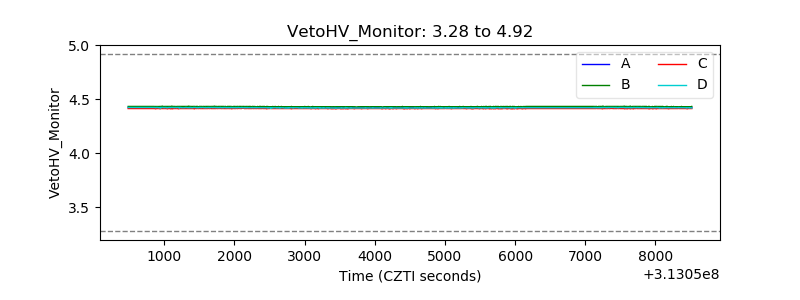 |
| Veto LLD | 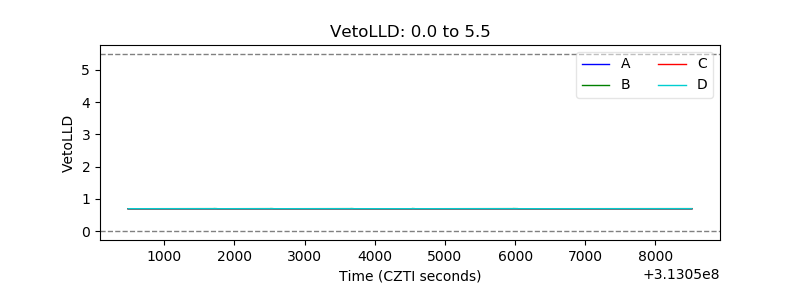 |
| Alpha Counter |  |
| _CPM_Rate | 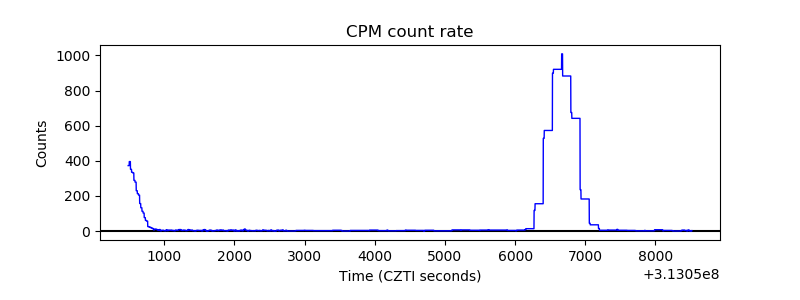 |
| CZT Counter | 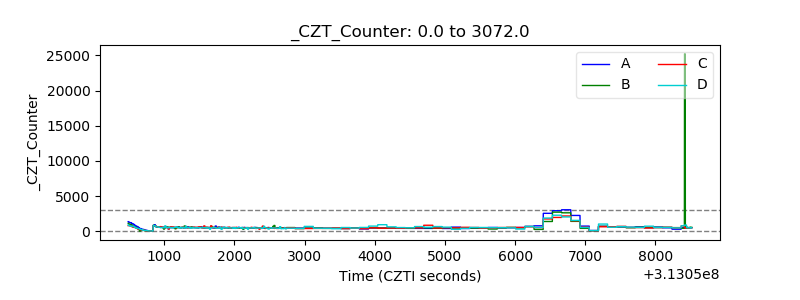 |
| +2.5 Volts monitor |  |
| +5 Volts monitor |  |
| _ROLL_ROT | 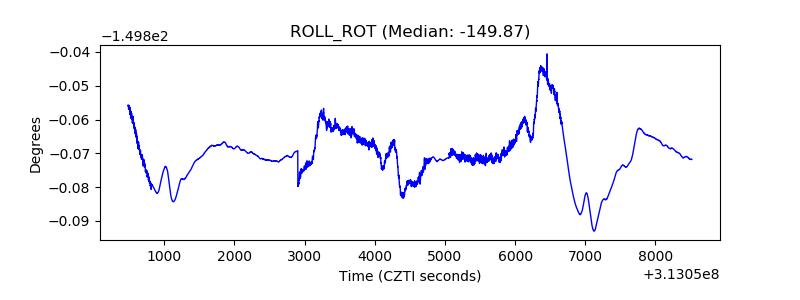 |
| _Roll_DEC | 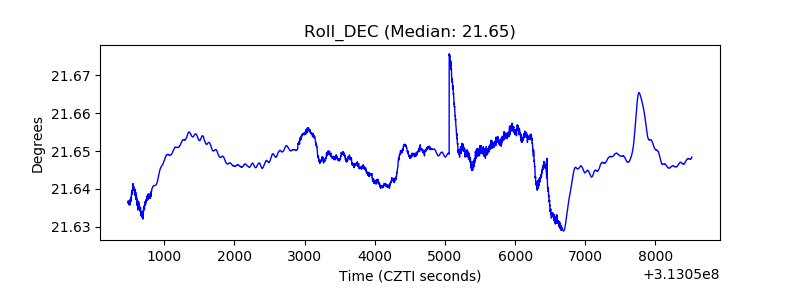 |
| _Roll_RA |  |
| Veto Counter | 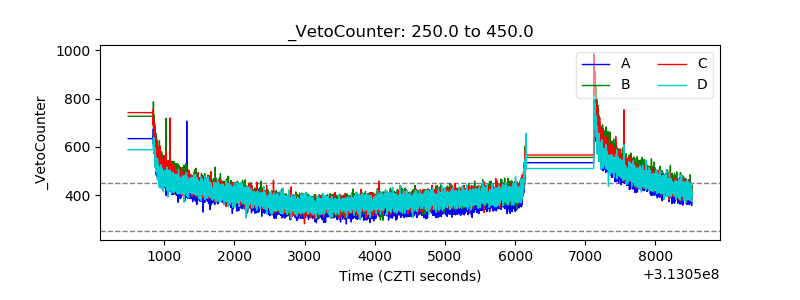 |