| Param | Original file | Final file |
|---|---|---|
| Filename | modeM0/AS1C05_012T02_9000003372_22815cztM0_level2.evt | modeM0/AS1C05_012T02_9000003372_22815cztM0_level2_quad_clean.evt |
| Size (bytes) | 164,436,480 | 47,522,880 |
| Size | 156.8 MB | 45.3 MB |
| Events in quadrant A | 1,193,424 | 323,704 |
| Events in quadrant B | 1,236,417 | 325,187 |
| Events in quadrant C | 1,174,442 | 308,241 |
| Events in quadrant D | 1,208,870 | 307,765 |
| Mode M0 | |||
|---|---|---|---|
| Quadrant | BADHDUFLAG | Total packets | Discarded packets |
| A | 0 | 5032 | 1 |
| B | 0 | 5151 | 1 |
| C | 0 | 5013 | 1 |
| D | 0 | 5134 | 1 |
| Mode M9 | |||
|---|---|---|---|
| Quadrant | BADHDUFLAG | Total packets | Discarded packets |
| A | 0 | 7 | 0 |
| B | 0 | 7 | 0 |
| C | 0 | 7 | 0 |
| D | 0 | 7 | 0 |
| Mode SS | |||
|---|---|---|---|
| Quadrant | BADHDUFLAG | Total packets | Discarded packets |
| A | 0 | 50 | 0 |
| B | 0 | 50 | 0 |
| C | 0 | 50 | 0 |
| D | 0 | 50 | 0 |
| Quadrant | Total seconds | Saturated seconds | Saturation percentage |
|---|---|---|---|
| A | 2419 | 61 | 2.521703% |
| B | 2419 | 65 | 2.687061% |
| C | 2419 | 74 | 3.059115% |
| D | 2419 | 58 | 2.397685% |
Noise dominated data is calculated using 1-second bins in cleaned event files. If a bin has >2000 counts, and if more than 50% of those come from <1% of pixels, then it is considered to be noise-dominated and hence unusable.
| Quadrant | # 1 sec bins | Bins with >0 counts | Bins with >2000 counts | High rate bins dominated by noise | Noise dominated (total time) | Noise dominated (detector-on time) | Marked lightcurve |
|---|---|---|---|---|---|---|---|
| A | 3144 | 2420 | 0 | 0 | 0.00% | 0.00% | 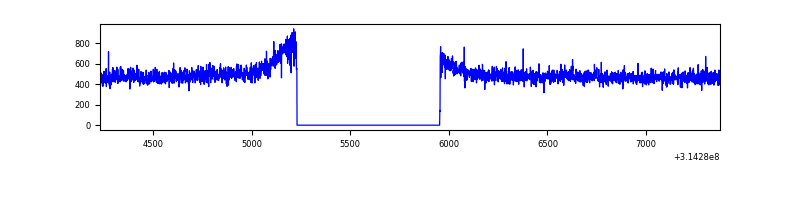 |
| B | 3144 | 2420 | 0 | 0 | 0.00% | 0.00% | 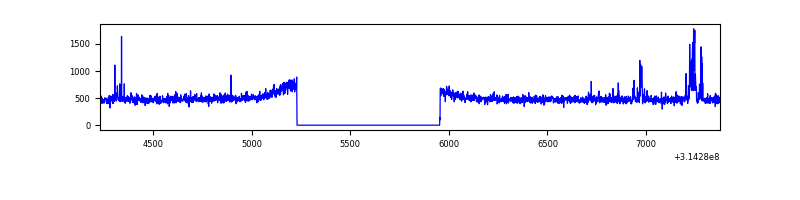 |
| C | 3144 | 2420 | 0 | 0 | 0.00% | 0.00% | 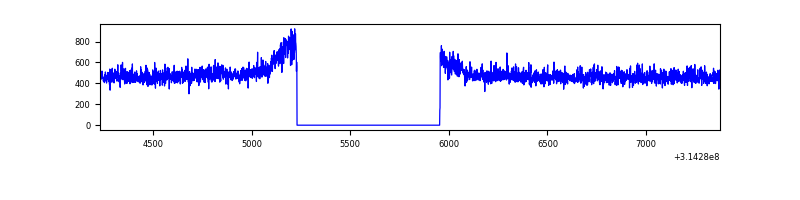 |
| D | 3144 | 2420 | 3 | 3 | 0.10% | 0.12% | 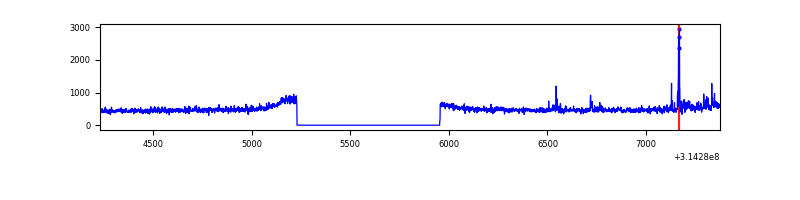 |
Top three noisy pixels from each quadrant. If the there are fewer than three noisy pixels in the level2.evt file, extra rows are filled as -1
| Pixel properties | Quadrant properties | ||||||
|---|---|---|---|---|---|---|---|
| Quadrant | DetID | PixID | Counts | Sigma | Mean | Median | Sigma |
| A | 13 | 254 | 4053 | 58.98 | 308 | 301 | 63.6 |
| A | 0 | 226 | 2801 | 39.3 | 308 | 301 | 63.6 |
| A | 3 | 137 | 2597 | 36.09 | 308 | 301 | 63.6 |
| B | 0 | 190 | 35081 | 581.29 | 303 | 295 | 59.8 |
| B | 12 | 111 | 6975 | 111.62 | 303 | 295 | 59.8 |
| B | 11 | 111 | 6298 | 100.31 | 303 | 295 | 59.8 |
| C | 14 | 238 | 45607 | 667.5 | 288 | 289 | 67.9 |
| C | 13 | 61 | 2084 | 26.44 | 288 | 289 | 67.9 |
| C | 0 | 239 | 1705 | 20.86 | 288 | 289 | 67.9 |
| D | 8 | 195 | 34321 | 463.04 | 296 | 286 | 73.5 |
| D | 7 | 238 | 20723 | 278.04 | 296 | 286 | 73.5 |
| D | 9 | 85 | 19168 | 256.89 | 296 | 286 | 73.5 |
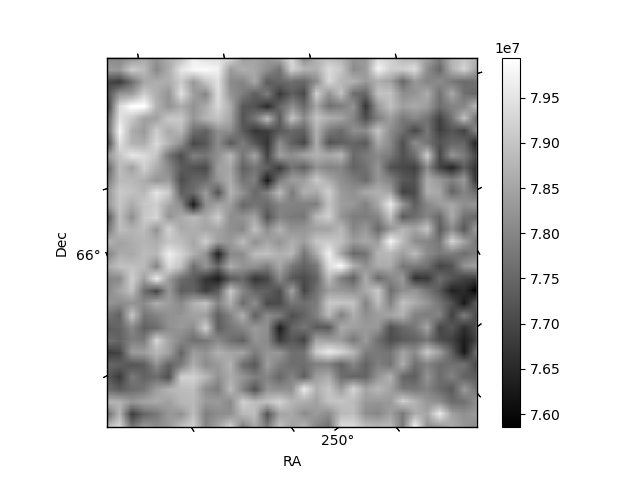
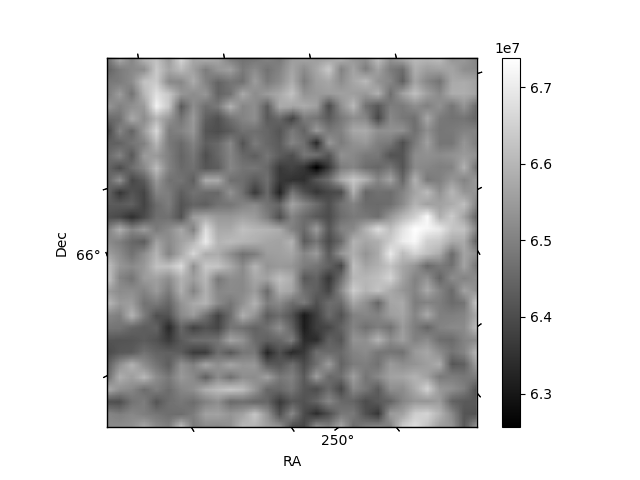
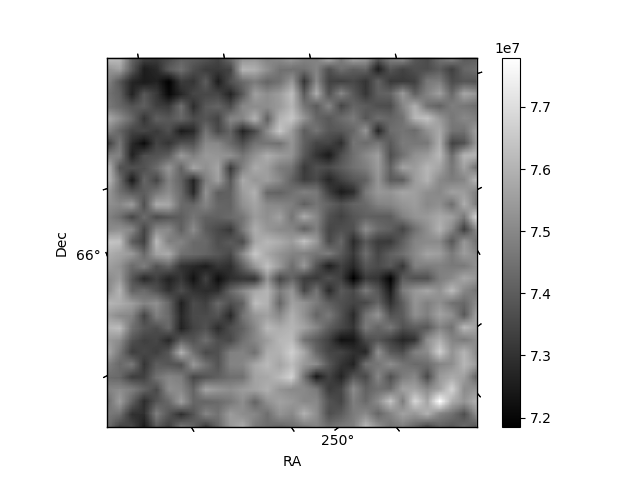
Histogram calculated using DETX and DETY for each event in the final _common_clean file
| Quadrant A | 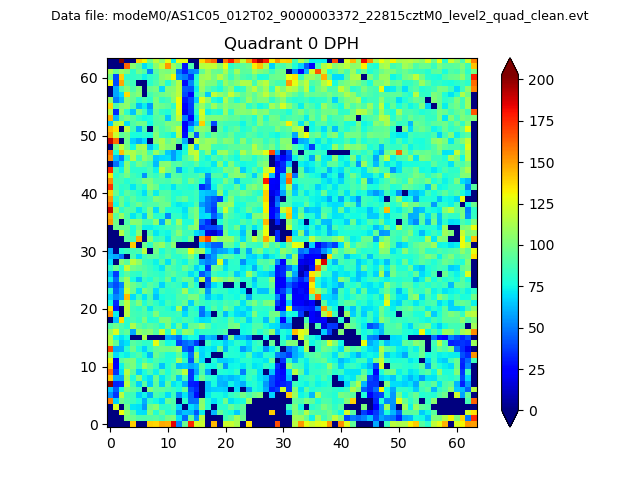 |
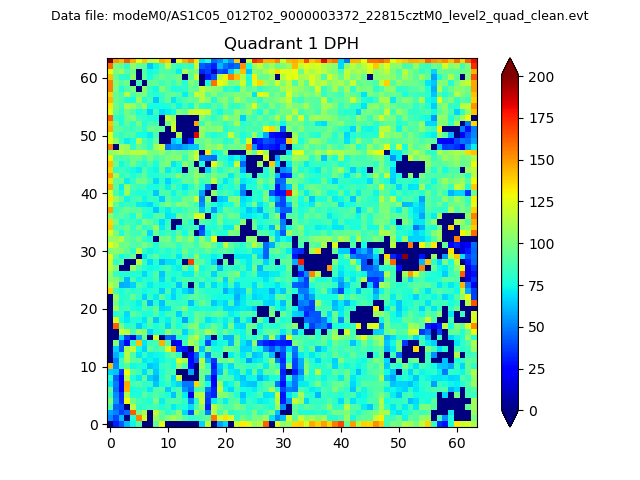 |
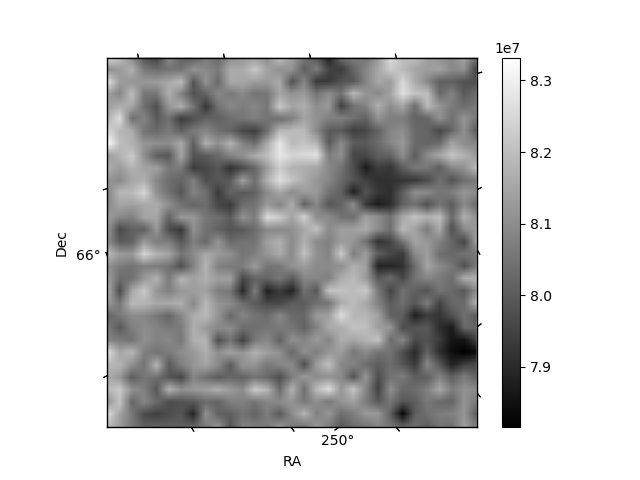
Quadrant B |
|---|---|---|---|
| Quadrant D | 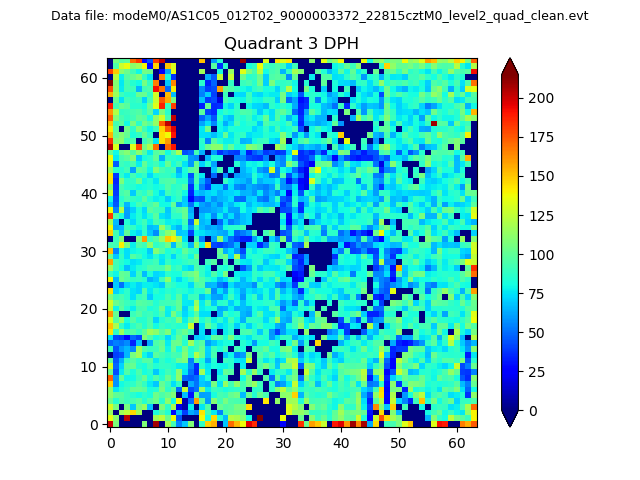 |
 |
Quadrant C |
| Plot type | Count rate plots | Images |
|---|---|---|
| Comparison with Poisson distribution Blue bars denote a histogram of data divided into 1 sec bins. Red curve is a Poisson curve with rate = median count rate of data. |
 |
 |
| Quadrant-wise count rates Data is divided into 100 sec bins |
 |
|
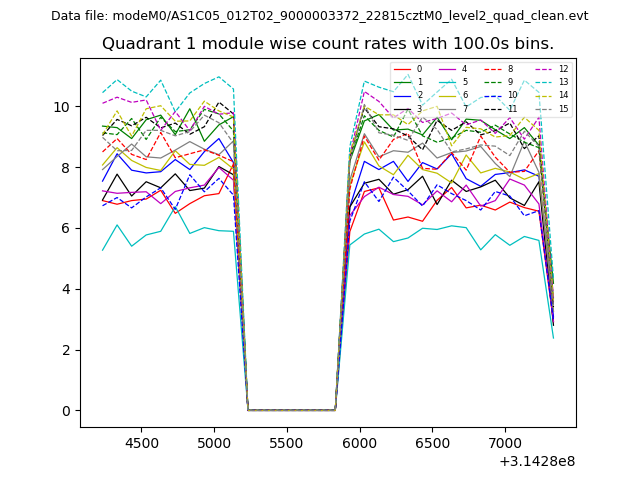
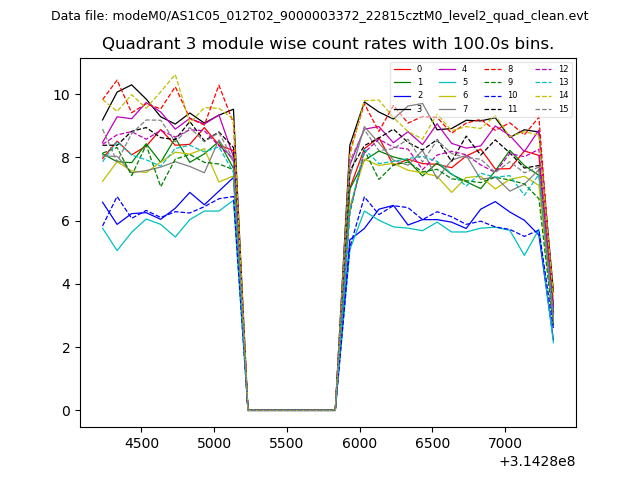
| Module-wise count rates for Quadrant A Data is divided into 100 sec bins |
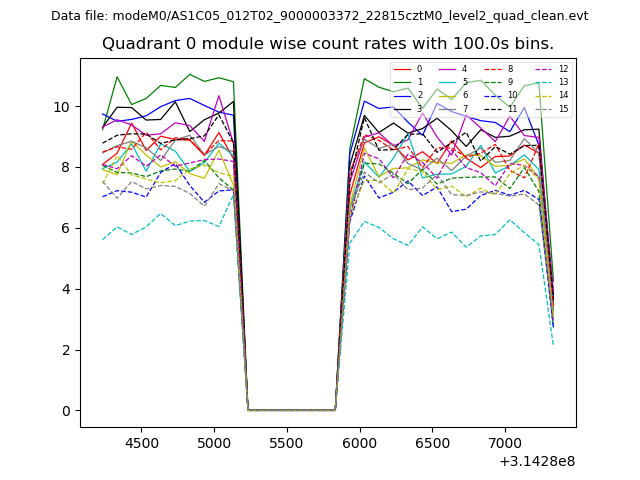 |
 |
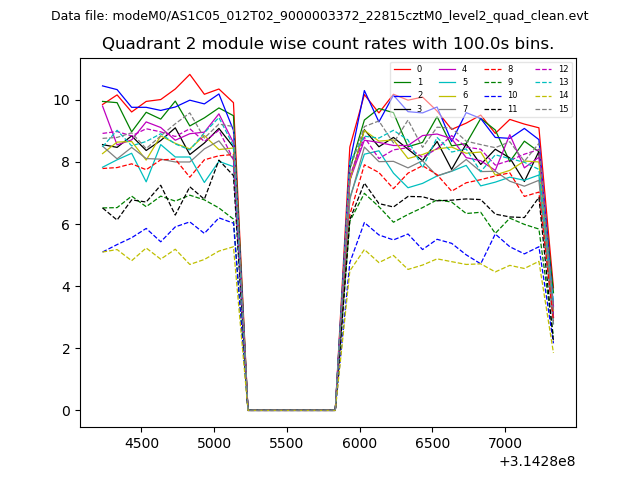
| Module-wise count rates for Quadrant B Data is divided into 100 sec bins |
 |
 |
| Module-wise count rates for Quadrant C Data is divided into 100 sec bins |
 |
 |
| Module-wise count rates for Quadrant D Data is divided into 100 sec bins |
 |
 |
| Parameter | Plot |
|---|---|
| CZT HV Monitor | 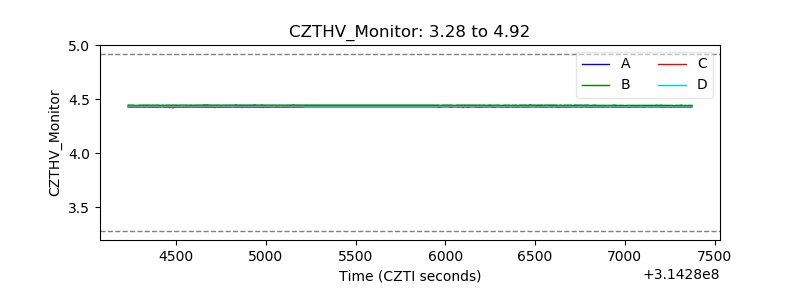 |
| D_VDD | 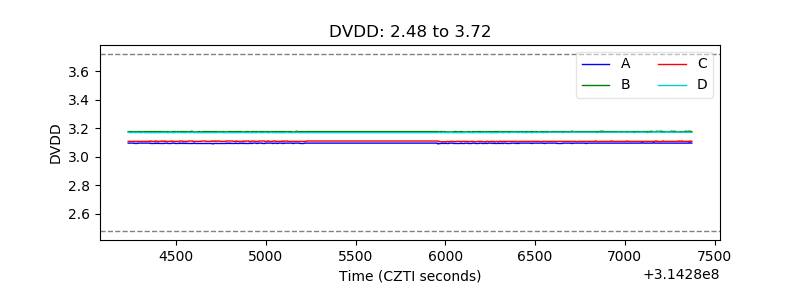 |
| Temperature 1 |  |
| Veto HV Monitor | 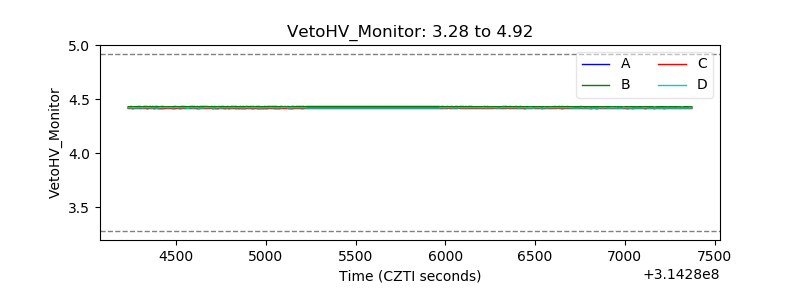 |
| Veto LLD | 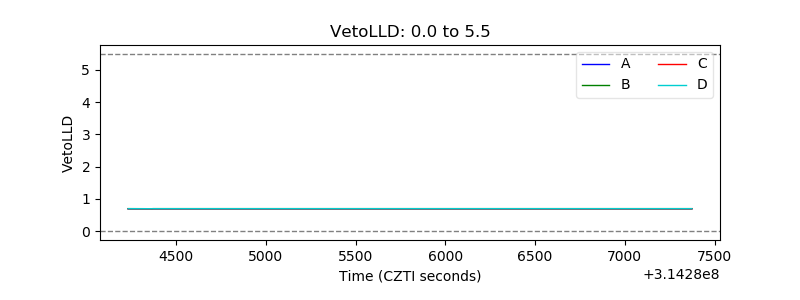 |
| Alpha Counter |  |
| _CPM_Rate | 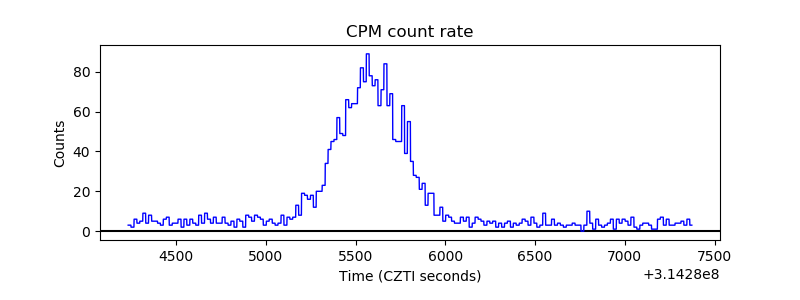 |
| CZT Counter | 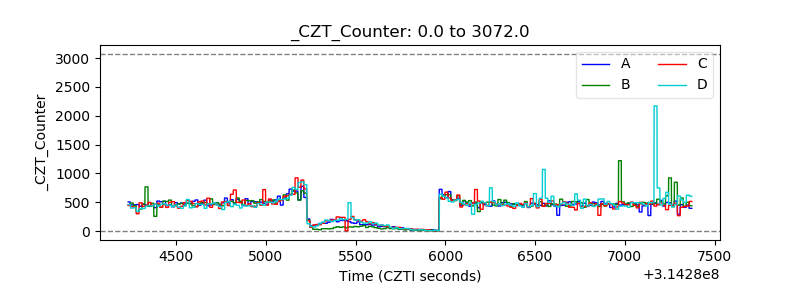 |
| +2.5 Volts monitor |  |
| +5 Volts monitor |  |
| _ROLL_ROT | 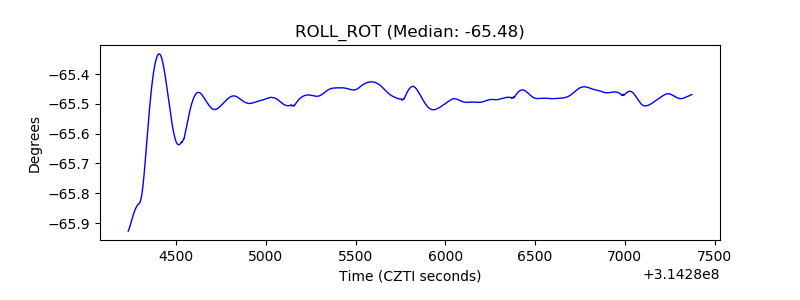 |
| _Roll_DEC | 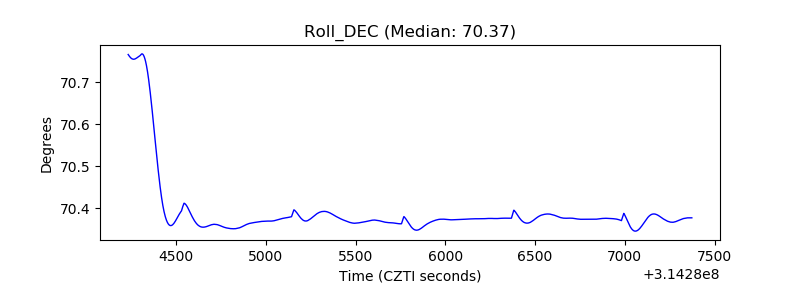 |
| _Roll_RA |  |
| Veto Counter | 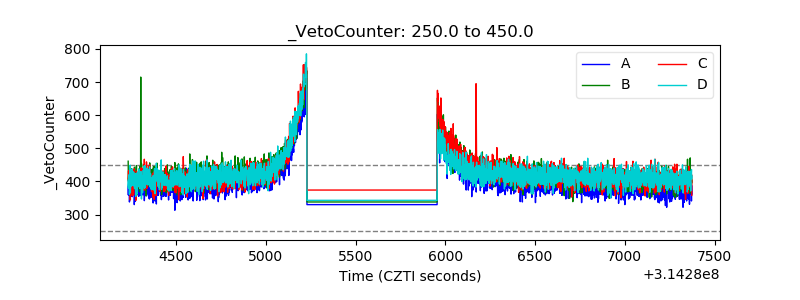 |