| Param | Original file | Final file |
|---|---|---|
| Filename | modeM0/AS1A07_047T09_9000003386_22921cztM0_level2.evt | modeM0/AS1A07_047T09_9000003386_22921cztM0_level2_quad_clean.evt |
| Size (bytes) | 405,820,800 | 80,424,000 |
| Size | 387.0 MB | 76.7 MB |
| Events in quadrant A | 2,397,652 | 534,958 |
| Events in quadrant B | 2,508,705 | 538,038 |
| Events in quadrant C | 2,486,961 | 508,987 |
| Events in quadrant D | 4,532,375 | 477,953 |
| Mode M0 | |||
|---|---|---|---|
| Quadrant | BADHDUFLAG | Total packets | Discarded packets |
| A | 0 | 10794 | 0 |
| B | 0 | 10980 | 0 |
| C | 0 | 10893 | 0 |
| D | 0 | 17144 | 0 |
| Mode SS | |||
|---|---|---|---|
| Quadrant | BADHDUFLAG | Total packets | Discarded packets |
| A | 0 | 110 | 0 |
| B | 0 | 110 | 0 |
| C | 0 | 110 | 0 |
| D | 0 | 110 | 0 |
| Mode M9 | |||
|---|---|---|---|
| Quadrant | BADHDUFLAG | Total packets | Discarded packets |
| A | 0 | 4 | 0 |
| B | 0 | 4 | 0 |
| C | 0 | 4 | 0 |
| D | 0 | 4 | 0 |
| Quadrant | Total seconds | Saturated seconds | Saturation percentage |
|---|---|---|---|
| A | 5357 | 12 | 0.224006% |
| B | 5357 | 13 | 0.242673% |
| C | 5357 | 30 | 0.560015% |
| D | 5357 | 405 | 7.560202% |
Noise dominated data is calculated using 1-second bins in cleaned event files. If a bin has >2000 counts, and if more than 50% of those come from <1% of pixels, then it is considered to be noise-dominated and hence unusable.
| Quadrant | # 1 sec bins | Bins with >0 counts | Bins with >2000 counts | High rate bins dominated by noise | Noise dominated (total time) | Noise dominated (detector-on time) | Marked lightcurve |
|---|---|---|---|---|---|---|---|
| A | 5357 | 5357 | 0 | 0 | 0.00% | 0.00% | 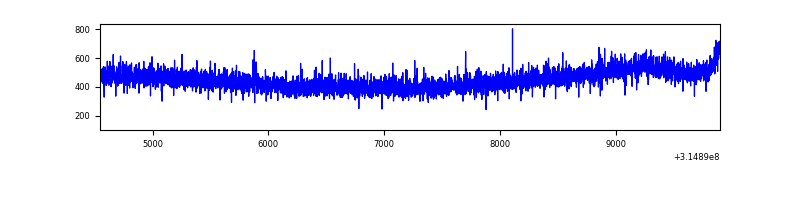 |
| B | 5357 | 5357 | 0 | 0 | 0.00% | 0.00% | 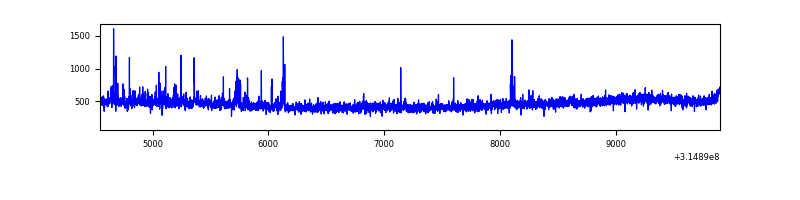 |
| C | 5357 | 5357 | 1 | 1 | 0.02% | 0.02% | 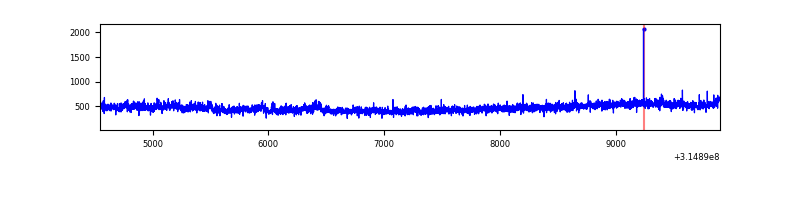 |
| D | 5357 | 5357 | 331 | 331 | 6.18% | 6.18% | 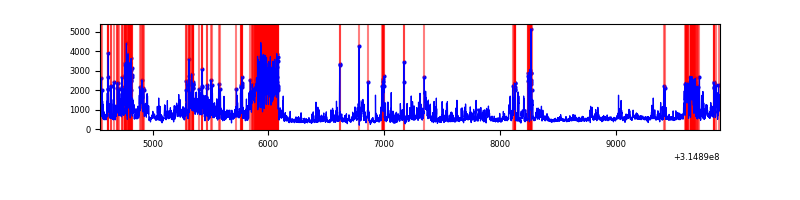 |
Top three noisy pixels from each quadrant. If the there are fewer than three noisy pixels in the level2.evt file, extra rows are filled as -1
| Pixel properties | Quadrant properties | ||||||
|---|---|---|---|---|---|---|---|
| Quadrant | DetID | PixID | Counts | Sigma | Mean | Median | Sigma |
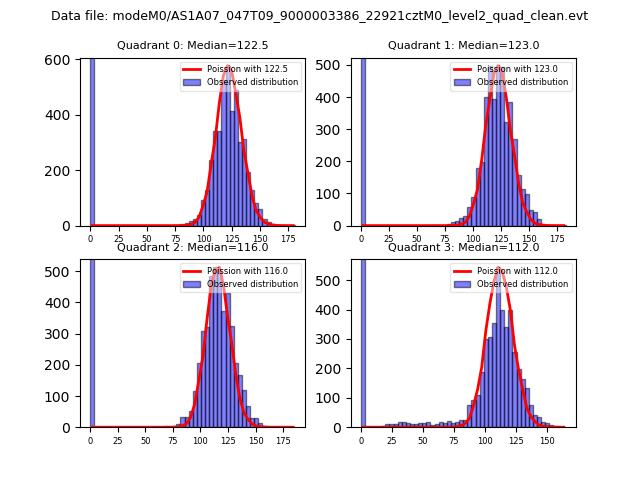
| A | 13 | 254 | 9624 | 71.96 | 616 | 603 | 125.4 |
| A | 0 | 23 | 9092 | 67.71 | 616 | 603 | 125.4 |
| A | 0 | 226 | 5821 | 41.62 | 616 | 603 | 125.4 |
| B | 0 | 190 | 32656 | 272.86 | 616 | 601 | 117.5 |
| B | 0 | 228 | 18437 | 151.83 | 616 | 601 | 117.5 |
| B | 0 | 230 | 17275 | 141.94 | 616 | 601 | 117.5 |
| C | 14 | 238 | 93466 | 670.37 | 588 | 590 | 138.5 |
| C | 6 | 80 | 86207 | 617.97 | 588 | 590 | 138.5 |
| C | 7 | 247 | 8644 | 58.13 | 588 | 590 | 138.5 |
| D | 1 | 52 | 1095325 | 7683.61 | 580 | 562 | 142.5 |
| D | 13 | 172 | 942774 | 6612.93 | 580 | 562 | 142.5 |
| D | 12 | 233 | 120123 | 839.14 | 580 | 562 | 142.5 |
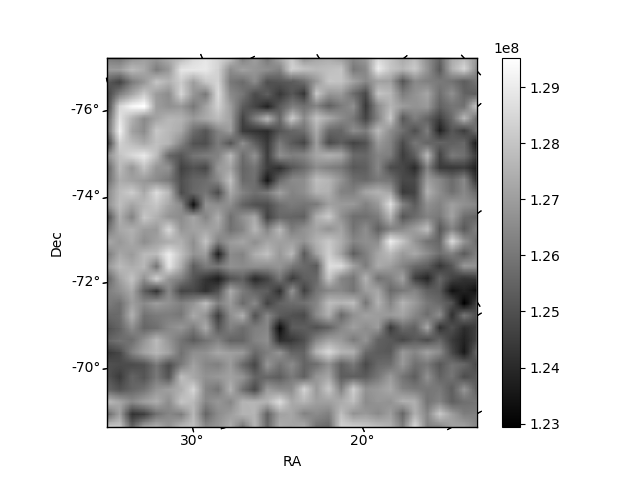
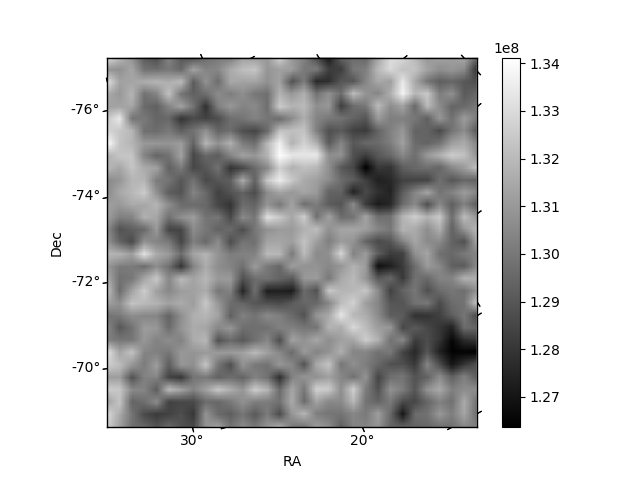
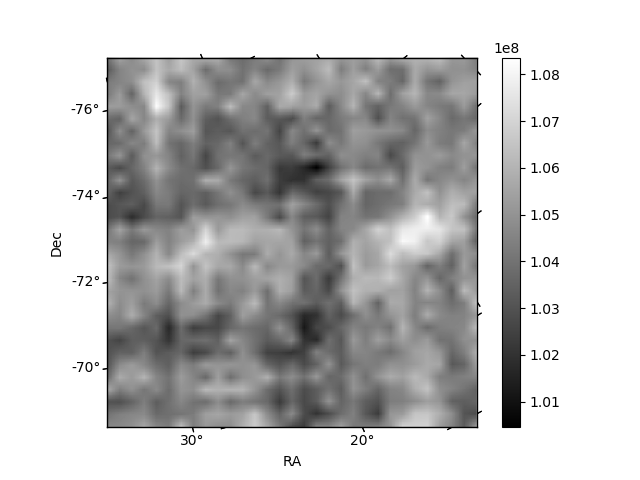
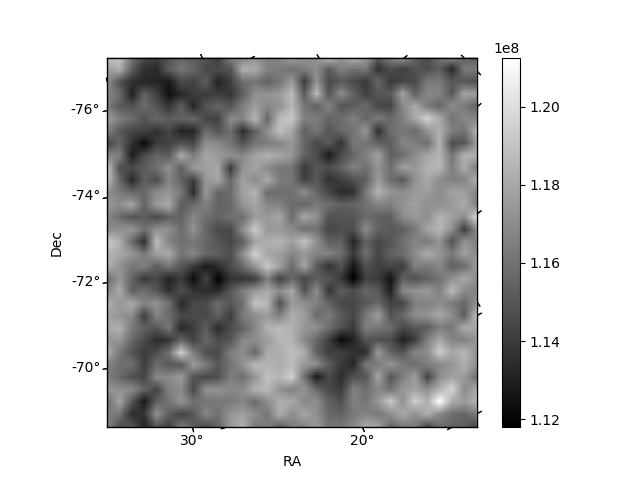
Histogram calculated using DETX and DETY for each event in the final _common_clean file
| Quadrant A |  |
 |
Quadrant B |
|---|---|---|---|
| Quadrant D |  |
 |
Quadrant C |
| Plot type | Count rate plots | Images |
|---|---|---|
| Comparison with Poisson distribution Blue bars denote a histogram of data divided into 1 sec bins. Red curve is a Poisson curve with rate = median count rate of data. |
 |
 |
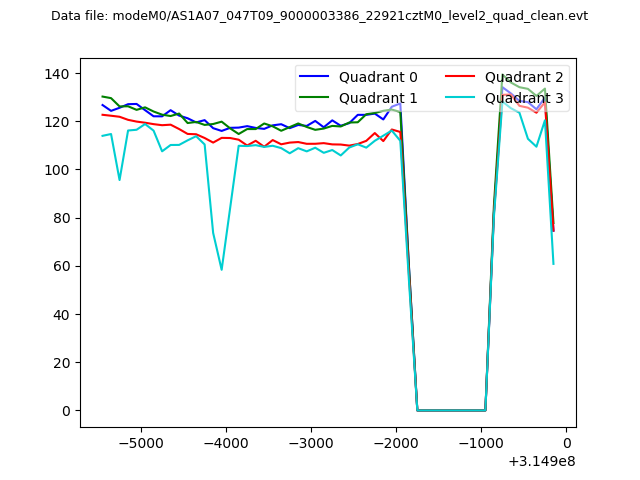
| Quadrant-wise count rates Data is divided into 100 sec bins |
 |
|
| Module-wise count rates for Quadrant A Data is divided into 100 sec bins |
 |
 |
| Module-wise count rates for Quadrant B Data is divided into 100 sec bins |
 |
 |
| Module-wise count rates for Quadrant C Data is divided into 100 sec bins |
 |
 |
| Module-wise count rates for Quadrant D Data is divided into 100 sec bins |
 |
 |
| Parameter | Plot |
|---|---|
| CZT HV Monitor |  |
| D_VDD | 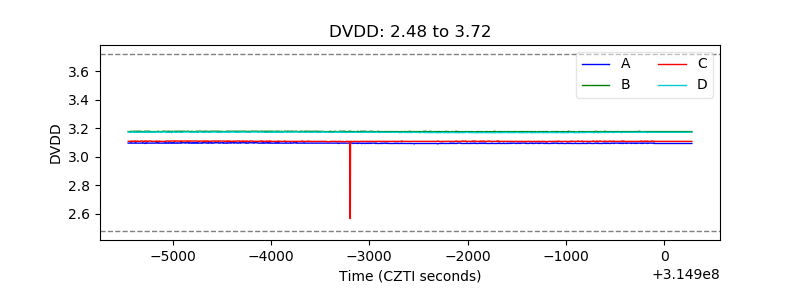 |
| Temperature 1 |  |
| Veto HV Monitor |  |
| Veto LLD |  |
| Alpha Counter | 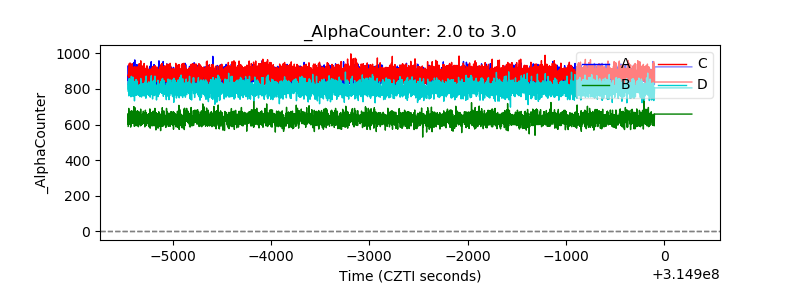 |
| _CPM_Rate | 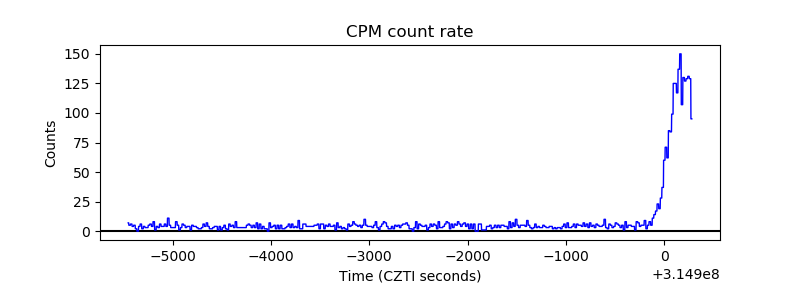 |
| CZT Counter |  |
| +2.5 Volts monitor |  |
| +5 Volts monitor |  |
| _ROLL_ROT |  |
| _Roll_DEC |  |
| _Roll_RA |  |
| Veto Counter |  |