| Param | Original file | Final file |
|---|---|---|
| Filename | modeM0/AS1C05_002T04_9000003454cztM0_level2.fits | modeM0/AS1C05_002T04_9000003454cztM0_level2_quad_clean.evt |
| Size (bytes) | 52,346,880 | 27,567,360 |
| Size | 49.9 MB | 26.3 MB |
| Events in quadrant A | 335,020 | 133,781 |
| Events in quadrant B | 317,164 | 133,156 |
| Events in quadrant C | 325,528 | 127,187 |
| Events in quadrant D | 289,136 | 120,892 |
| Mode M9 | |||
|---|---|---|---|
| Quadrant | BADHDUFLAG | Total packets | Discarded packets |
| A | 0 | 13 | 0 |
| B | 0 | 13 | 0 |
| C | 0 | 13 | 0 |
| D | 0 | 13 | 0 |
| Mode SS | |||
|---|---|---|---|
| Quadrant | BADHDUFLAG | Total packets | Discarded packets |
| A | 0 | 92 | 0 |
| B | 0 | 92 | 0 |
| C | 0 | 92 | 0 |
| D | 0 | 92 | 0 |
| Mode M0 | |||
|---|---|---|---|
| Quadrant | BADHDUFLAG | Total packets | Discarded packets |
| A | 0 | 9925 | 0 |
| B | 0 | 10162 | 0 |
| C | 0 | 13034 | 0 |
| D | 0 | 11183 | 0 |
| Quadrant | Total seconds | Saturated seconds | Saturation percentage |
|---|---|---|---|
| A | 4535 | 74 | 1.631753% |
| B | 4535 | 79 | 1.742007% |
| C | 4535 | 153 | 3.373760% |
| D | 4535 | 114 | 2.513782% |
Noise dominated data is calculated using 1-second bins in cleaned event files. If a bin has >2000 counts, and if more than 50% of those come from <1% of pixels, then it is considered to be noise-dominated and hence unusable.
| Quadrant | # 1 sec bins | Bins with >0 counts | Bins with >2000 counts | High rate bins dominated by noise | Noise dominated (total time) | Noise dominated (detector-on time) | Marked lightcurve |
|---|---|---|---|---|---|---|---|
| A | 5860 | 4534 | 0 | 0 | 0.00% | 0.00% | 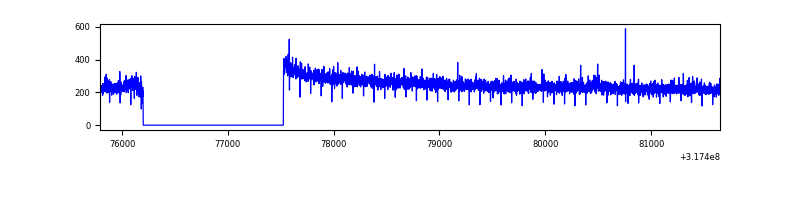 |
| B | 5860 | 4535 | 0 | 0 | 0.00% | 0.00% |  |
| C | 5860 | 4534 | 0 | 0 | 0.00% | 0.00% | 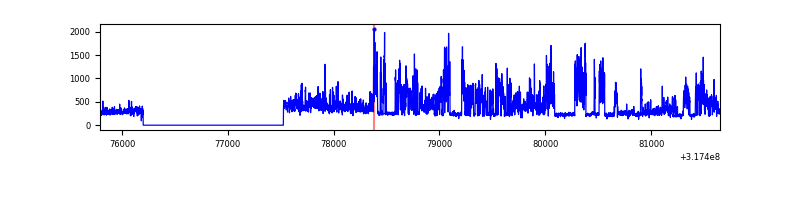 |
| D | 5860 | 4534 | 0 | 0 | 0.00% | 0.00% | 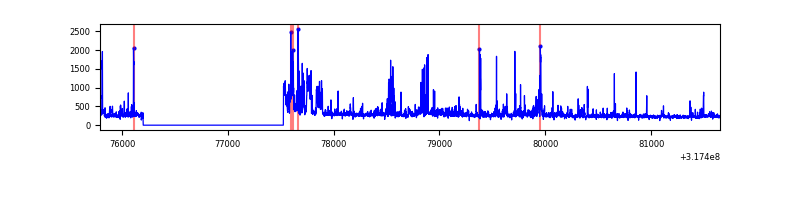 |
Top three noisy pixels from each quadrant. If the there are fewer than three noisy pixels in the level2.evt file, extra rows are filled as -1
| Pixel properties | Quadrant properties | ||||||
|---|---|---|---|---|---|---|---|
| Quadrant | DetID | PixID | Counts | Sigma | Mean | Median | Sigma |
| A | 0 | 29 | 344 | 11.4 | 87 | 83 | 22.9 |
| A | 0 | 30 | 290 | 9.04 | 87 | 83 | 22.9 |
| A | 7 | 110 | 275 | 8.38 | 87 | 83 | 22.9 |
| B | 2 | 9 | 247 | 8.97 | 84 | 81 | 18.5 |
| B | 5 | 128 | 218 | 7.4 | 84 | 81 | 18.5 |
| B | 5 | 255 | 208 | 6.86 | 84 | 81 | 18.5 |
| C | 3 | 126 | 237 | 6.66 | 86 | 81 | 23.4 |
| C | 9 | 209 | 235 | 6.57 | 86 | 81 | 23.4 |
| C | 1 | 80 | 234 | 6.53 | 86 | 81 | 23.4 |
| D | 3 | 14 | 219 | 6.28 | 82 | 75 | 22.9 |
| D | 7 | 3 | 214 | 6.06 | 82 | 75 | 22.9 |
| D | 1 | 3 | 211 | 5.93 | 82 | 75 | 22.9 |
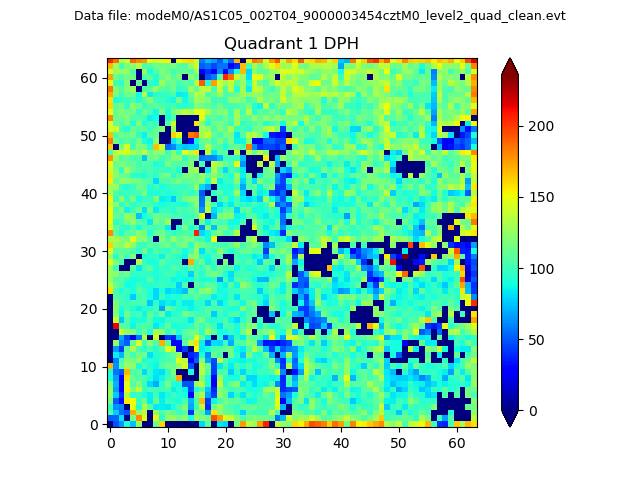
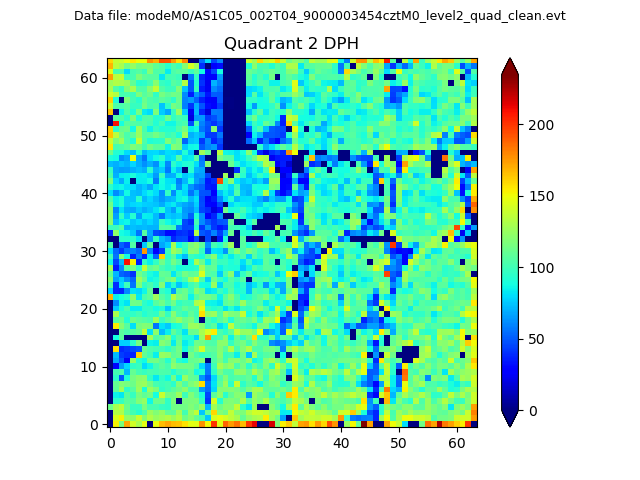
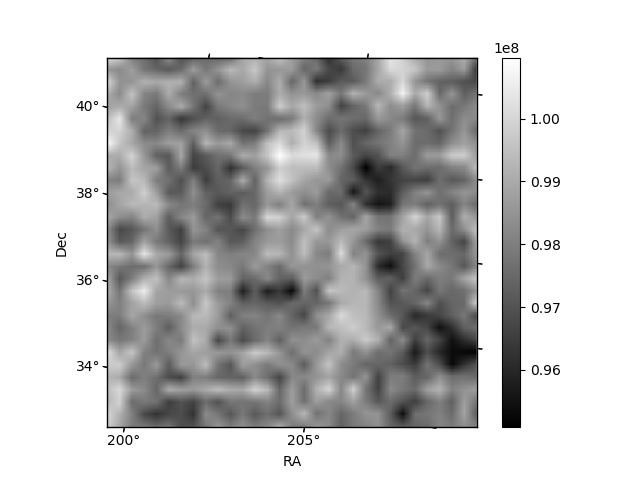
Histogram calculated using DETX and DETY for each event in the final _common_clean file
| Quadrant A | 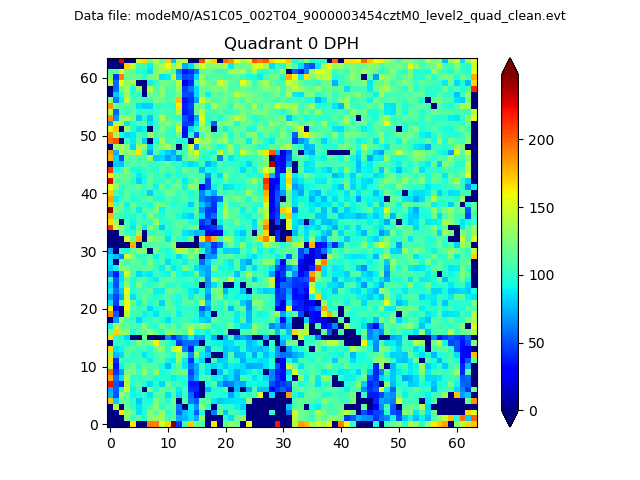 |
 |
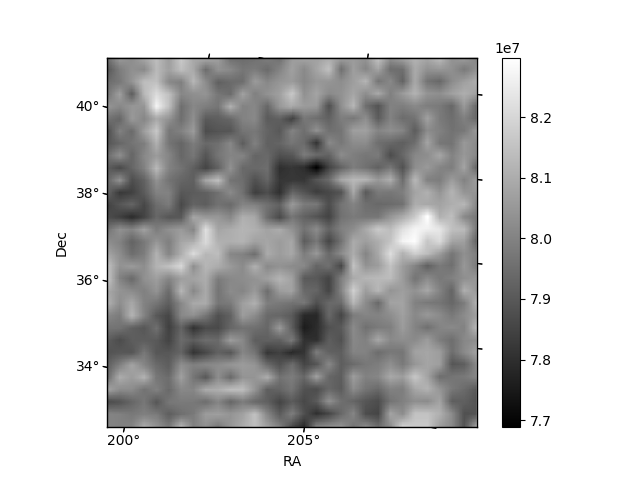
Quadrant B |
|---|---|---|---|
| Quadrant D |  |
 |
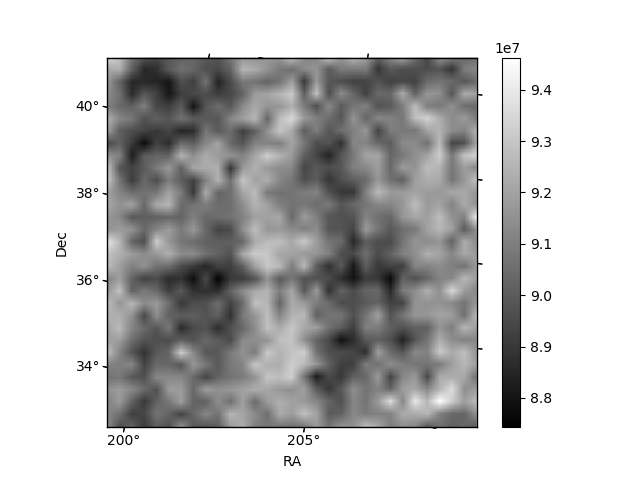
Quadrant C |
| Plot type | Count rate plots | Images |
|---|---|---|
| Comparison with Poisson distribution Blue bars denote a histogram of data divided into 1 sec bins. Red curve is a Poisson curve with rate = median count rate of data. |
 |
 |
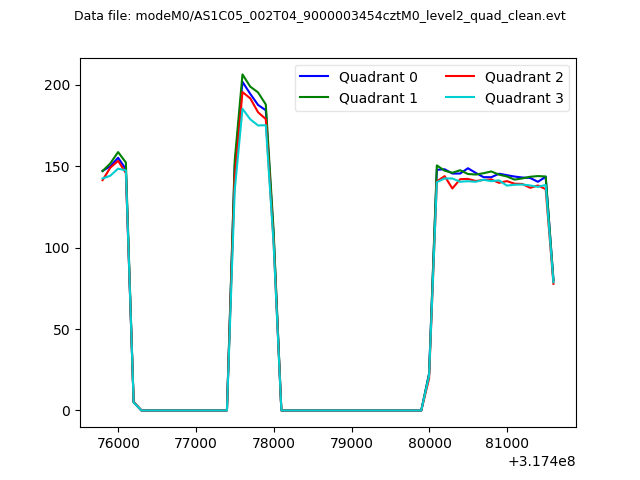
| Quadrant-wise count rates Data is divided into 100 sec bins |
 |
|
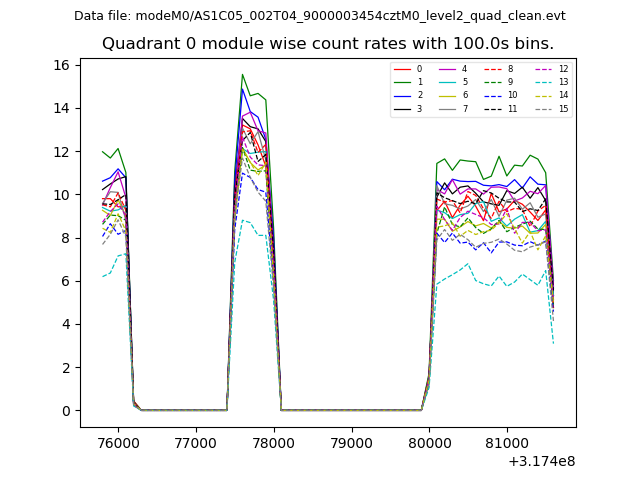
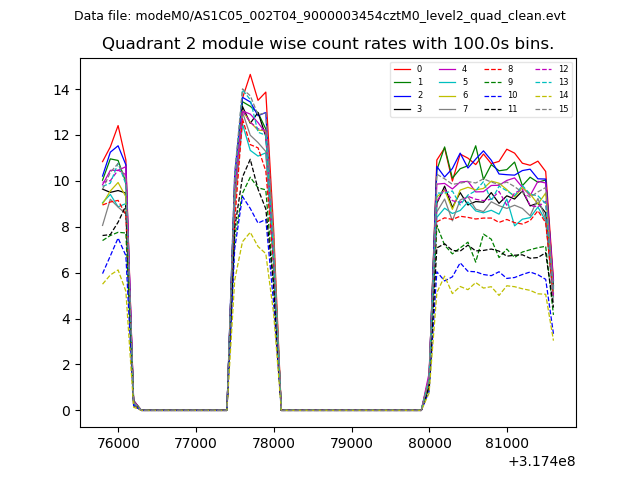
| Module-wise count rates for Quadrant A Data is divided into 100 sec bins |
 |
 |
| Module-wise count rates for Quadrant B Data is divided into 100 sec bins |
 |
 |
| Module-wise count rates for Quadrant C Data is divided into 100 sec bins |
 |
 |
| Module-wise count rates for Quadrant D Data is divided into 100 sec bins |
 |
 |
| Parameter | Plot |
|---|---|
| CZT HV Monitor | 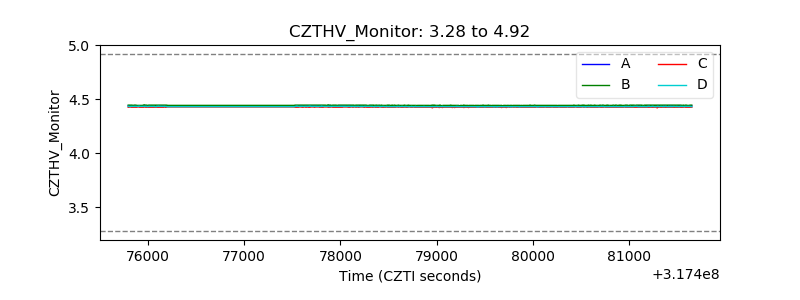 |
| D_VDD |  |
| Temperature 1 |  |
| Veto HV Monitor |  |
| Veto LLD | 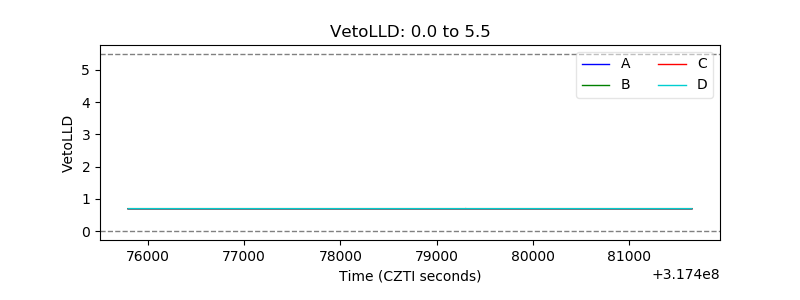 |
| Alpha Counter |  |
| _CPM_Rate |  |
| CZT Counter | 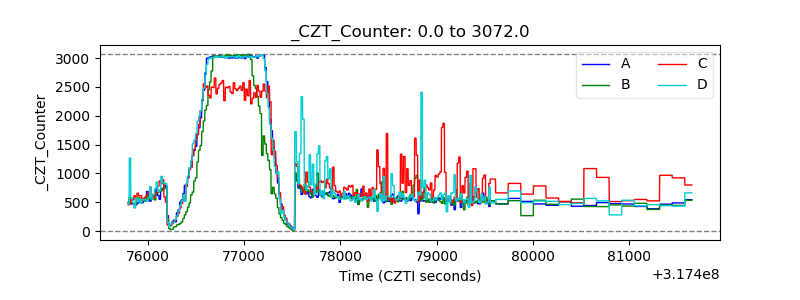 |
| +2.5 Volts monitor | 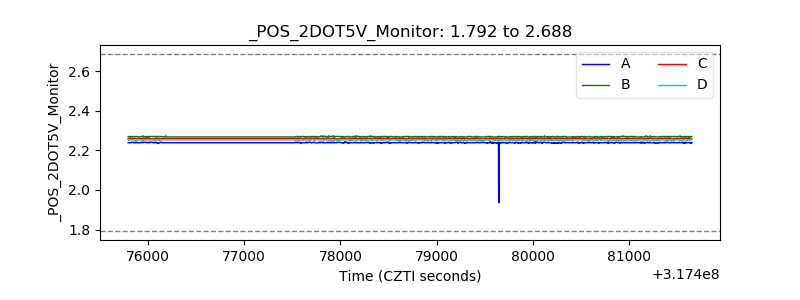 |
| +5 Volts monitor | 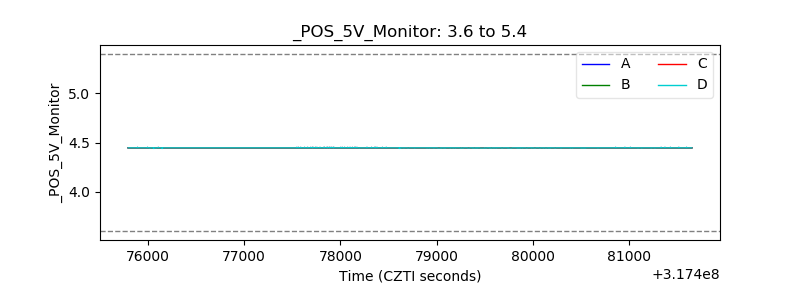 |
| _ROLL_ROT |  |
| _Roll_DEC |  |
| _Roll_RA | 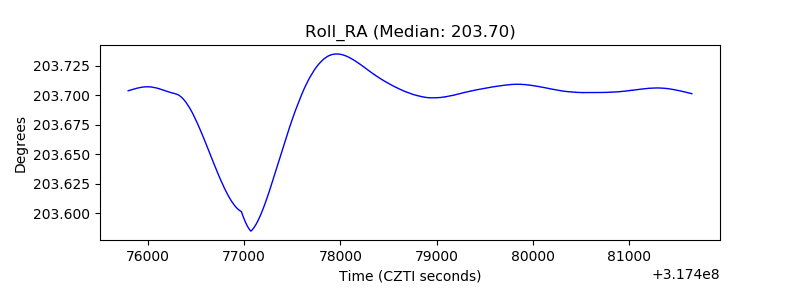 |
| Veto Counter | 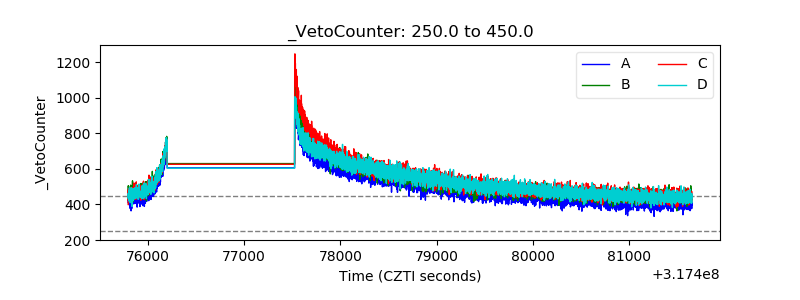 |