| Param | Original file | Final file |
|---|---|---|
| Filename | modeM0/AS1A07_138T02_9000003464_23430cztM0_level2.evt | modeM0/AS1A07_138T02_9000003464_23430cztM0_level2_quad_clean.evt |
| Size (bytes) | 343,978,560 | 64,437,120 |
| Size | 328.0 MB | 61.5 MB |
| Events in quadrant A | 2,358,113 | 402,226 |
| Events in quadrant B | 2,507,805 | 409,247 |
| Events in quadrant C | 2,491,261 | 393,185 |
| Events in quadrant D | 2,709,723 | 385,999 |
| Mode SS | |||
|---|---|---|---|
| Quadrant | BADHDUFLAG | Total packets | Discarded packets |
| A | 0 | 106 | 0 |
| B | 0 | 106 | 0 |
| C | 0 | 106 | 0 |
| D | 0 | 106 | 0 |
| Mode M0 | |||
|---|---|---|---|
| Quadrant | BADHDUFLAG | Total packets | Discarded packets |
| A | 0 | 10526 | 1 |
| B | 0 | 10936 | 1 |
| C | 0 | 10756 | 1 |
| D | 0 | 11844 | 1 |
| Mode M9 | |||
|---|---|---|---|
| Quadrant | BADHDUFLAG | Total packets | Discarded packets |
| A | 0 | 6 | 0 |
| B | 0 | 6 | 0 |
| C | 0 | 6 | 0 |
| D | 0 | 6 | 0 |
| Quadrant | Total seconds | Saturated seconds | Saturation percentage |
|---|---|---|---|
| A | 5138 | 14 | 0.272480% |
| B | 5139 | 44 | 0.856198% |
| C | 5139 | 59 | 1.148083% |
| D | 5139 | 127 | 2.471298% |
Noise dominated data is calculated using 1-second bins in cleaned event files. If a bin has >2000 counts, and if more than 50% of those come from <1% of pixels, then it is considered to be noise-dominated and hence unusable.
| Quadrant | # 1 sec bins | Bins with >0 counts | Bins with >2000 counts | High rate bins dominated by noise | Noise dominated (total time) | Noise dominated (detector-on time) | Marked lightcurve |
|---|---|---|---|---|---|---|---|
| A | 5748 | 5138 | 0 | 0 | 0.00% | 0.00% | 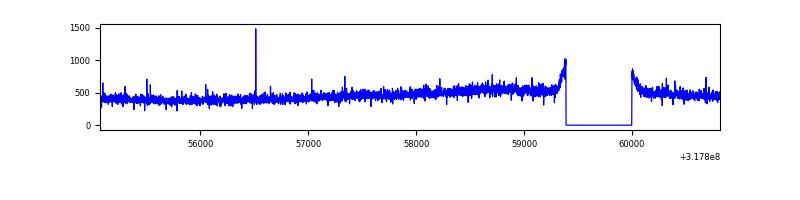 |
| B | 5749 | 5139 | 1 | 1 | 0.02% | 0.02% | 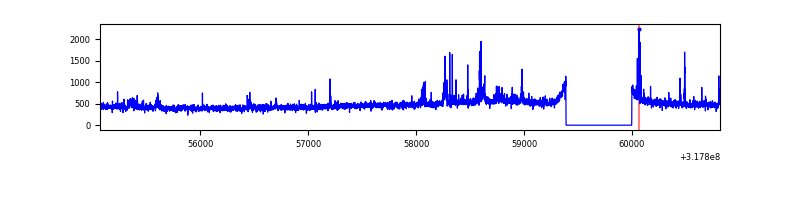 |
| C | 5749 | 5139 | 0 | 0 | 0.00% | 0.00% | 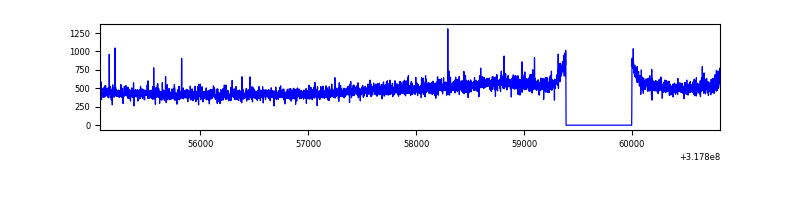 |
| D | 5749 | 5140 | 108 | 108 | 1.88% | 2.10% | 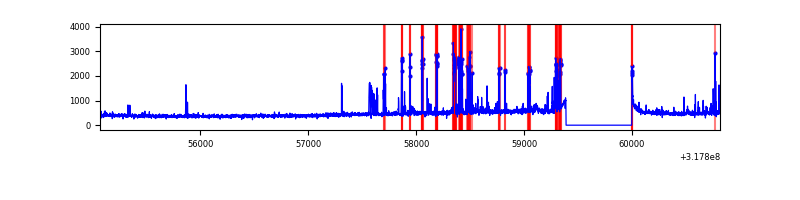 |
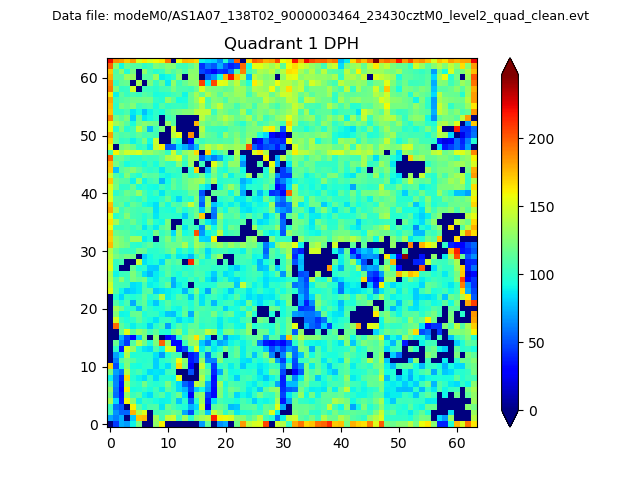
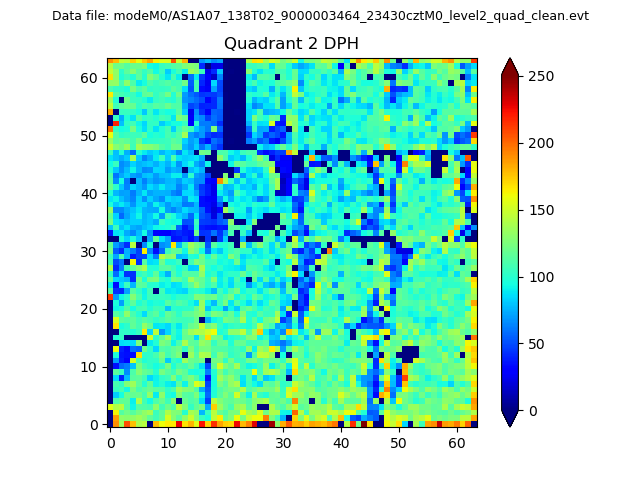
Top three noisy pixels from each quadrant. If the there are fewer than three noisy pixels in the level2.evt file, extra rows are filled as -1
| Pixel properties | Quadrant properties | ||||||
|---|---|---|---|---|---|---|---|
| Quadrant | DetID | PixID | Counts | Sigma | Mean | Median | Sigma |
| A | 13 | 254 | 7777 | 57.87 | 610 | 599 | 124.0 |
| A | 3 | 137 | 5459 | 39.19 | 610 | 599 | 124.0 |
| A | 0 | 226 | 5244 | 37.45 | 610 | 599 | 124.0 |
| B | 0 | 189 | 58903 | 494.09 | 608 | 592 | 118.0 |
| B | 0 | 190 | 20435 | 168.14 | 608 | 592 | 118.0 |
| B | 5 | 172 | 15863 | 129.4 | 608 | 592 | 118.0 |
| C | 10 | 9 | 115401 | 826.26 | 584 | 587 | 139.0 |
| C | 14 | 238 | 93606 | 669.41 | 584 | 587 | 139.0 |
| C | 7 | 247 | 5057 | 32.17 | 584 | 587 | 139.0 |
| D | 1 | 52 | 367964 | 2568.9 | 583 | 566 | 143.0 |
| D | 9 | 65 | 25916 | 177.25 | 583 | 566 | 143.0 |
| D | 12 | 227 | 24953 | 170.52 | 583 | 566 | 143.0 |
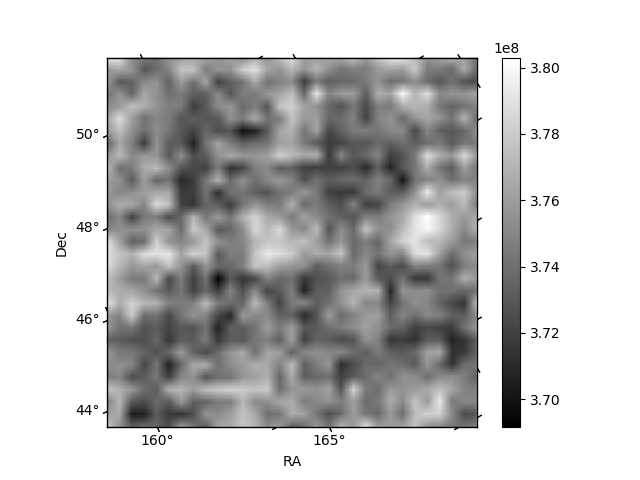
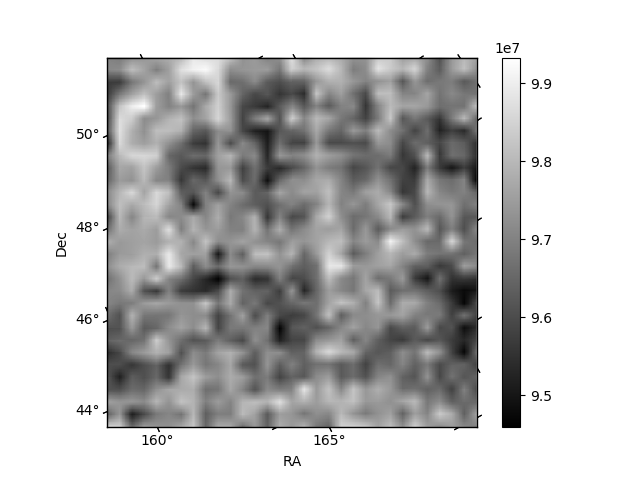
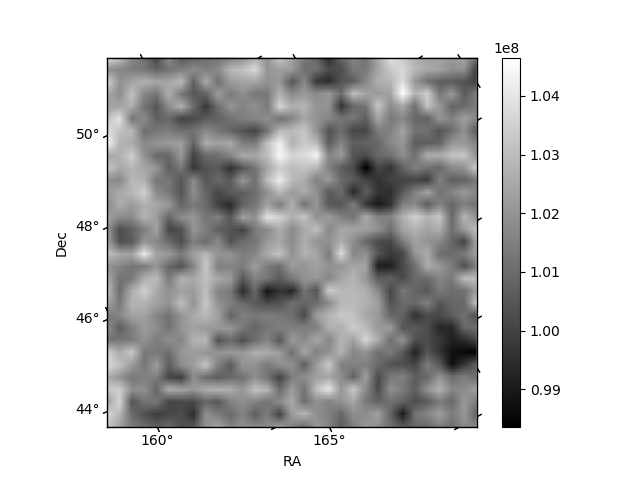
Histogram calculated using DETX and DETY for each event in the final _common_clean file
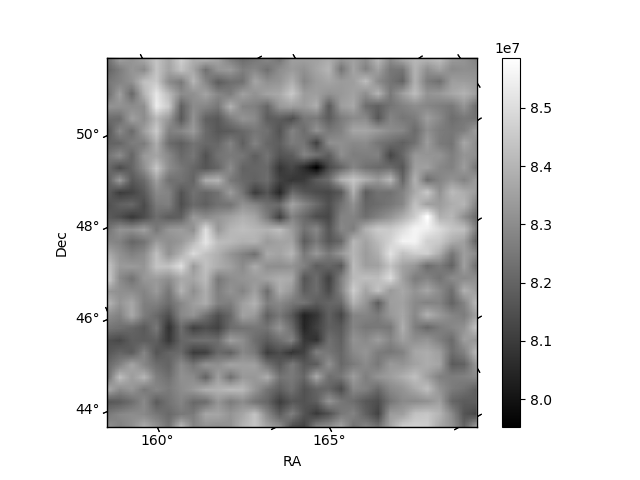
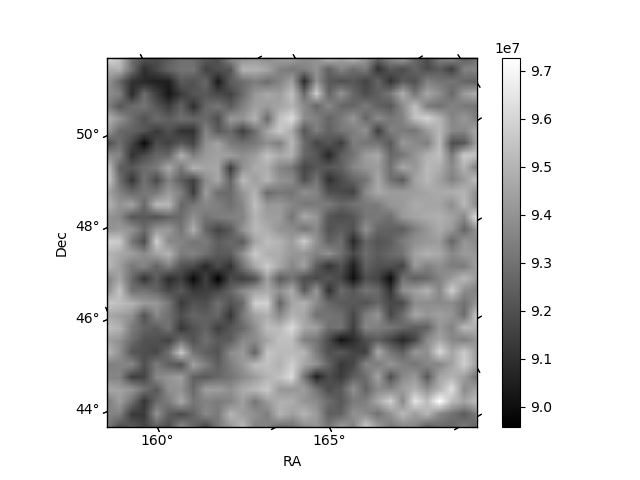
| Quadrant A | 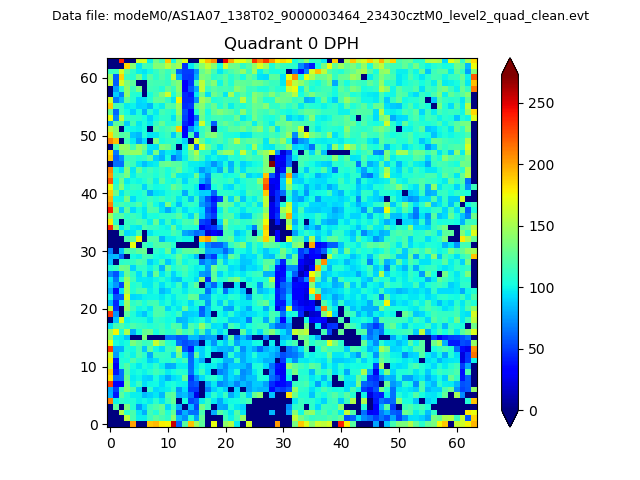 |
 |
Quadrant B |
|---|---|---|---|
| Quadrant D | 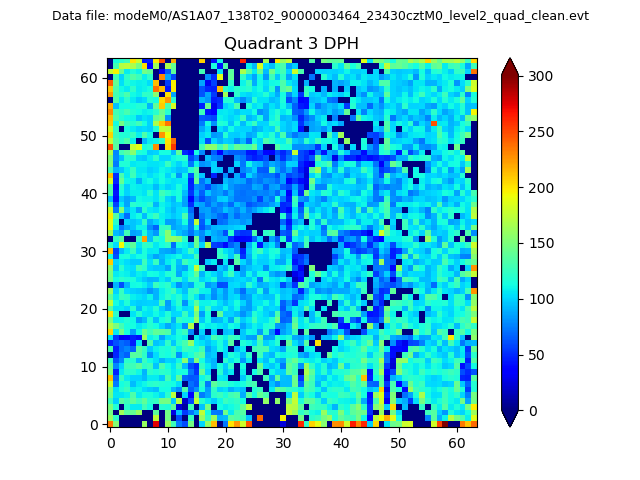 |
 |
Quadrant C |
| Plot type | Count rate plots | Images |
|---|---|---|
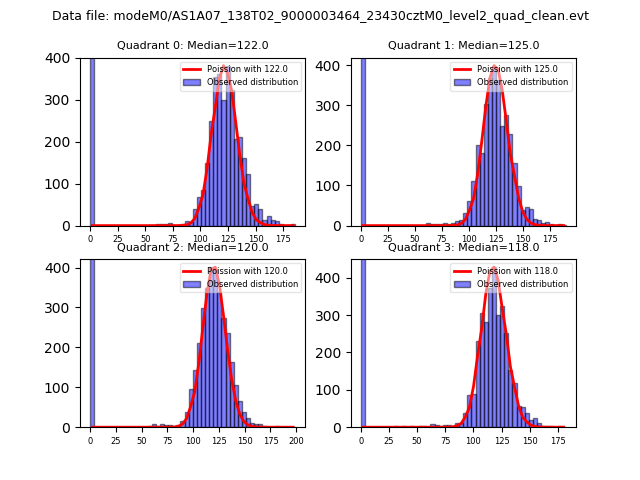
| Comparison with Poisson distribution Blue bars denote a histogram of data divided into 1 sec bins. Red curve is a Poisson curve with rate = median count rate of data. |
 |
 |
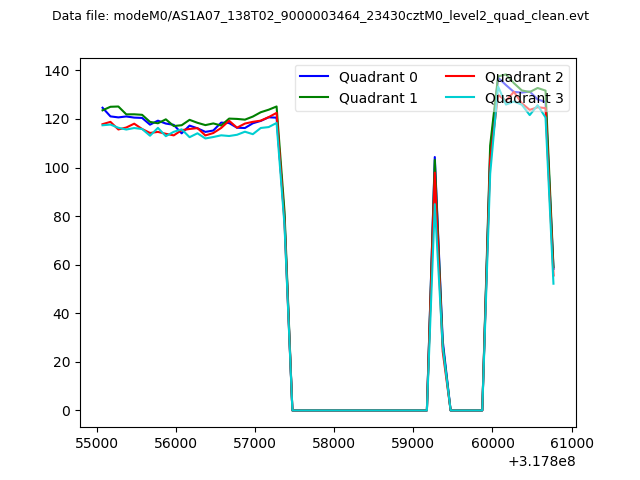
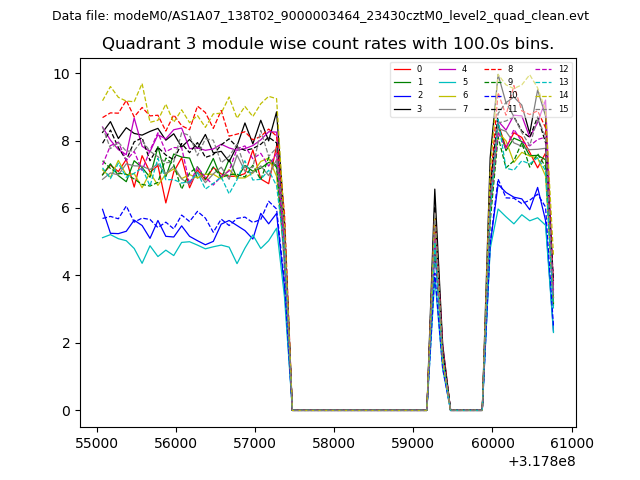
| Quadrant-wise count rates Data is divided into 100 sec bins |
 |
|
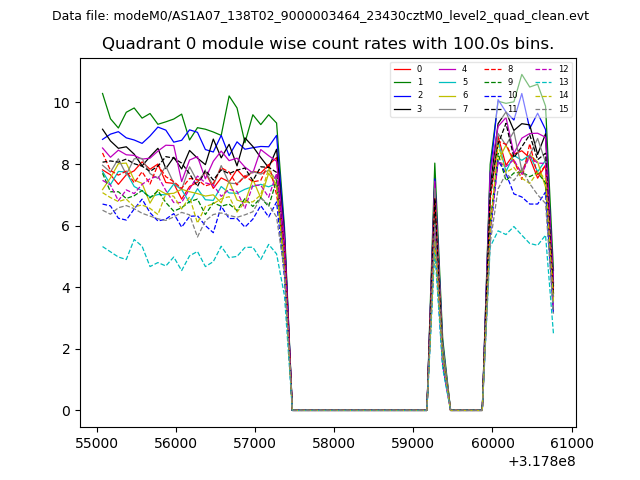
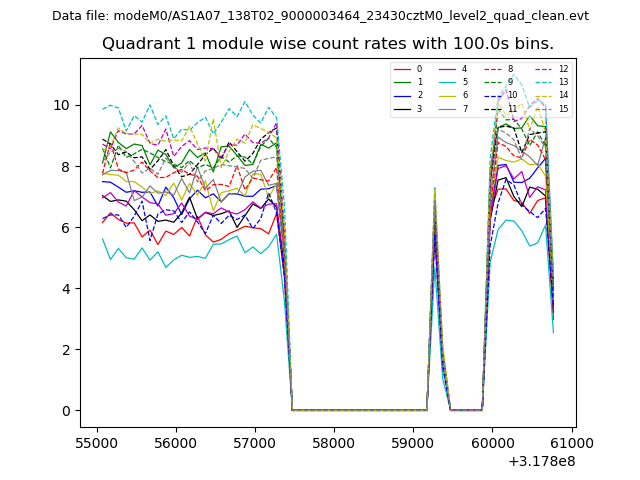
| Module-wise count rates for Quadrant A Data is divided into 100 sec bins |
 |
 |
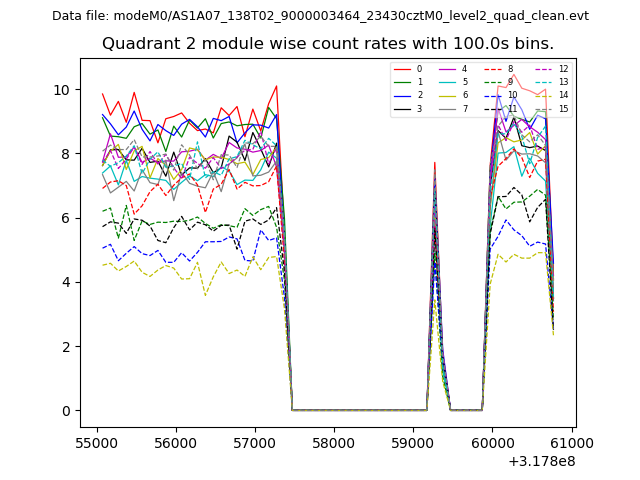
| Module-wise count rates for Quadrant B Data is divided into 100 sec bins |
 |
 |
| Module-wise count rates for Quadrant C Data is divided into 100 sec bins |
 |
 |
| Module-wise count rates for Quadrant D Data is divided into 100 sec bins |
 |
 |
| Parameter | Plot |
|---|---|
| CZT HV Monitor | 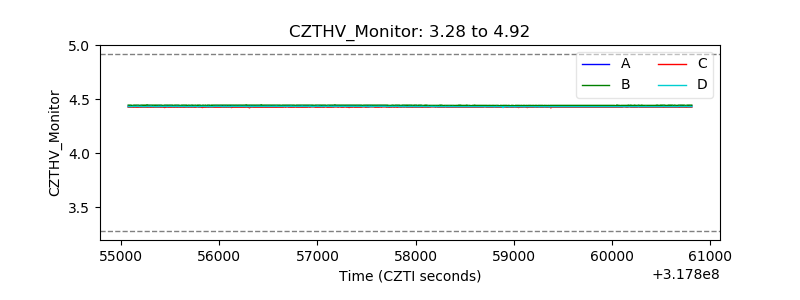 |
| D_VDD | 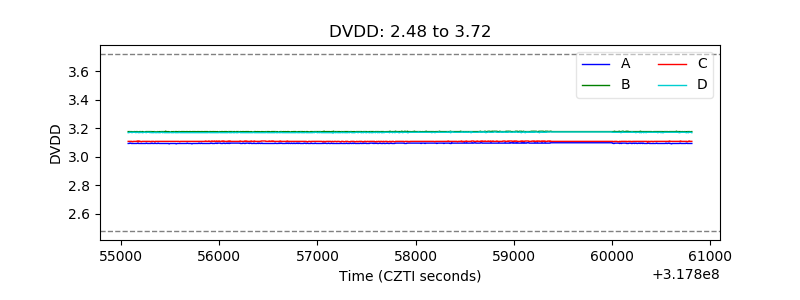 |
| Temperature 1 | 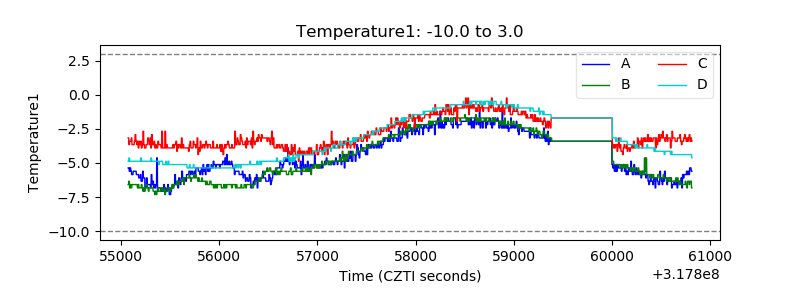 |
| Veto HV Monitor | 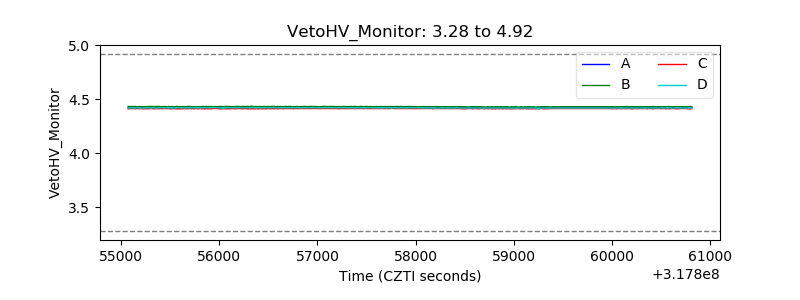 |
| Veto LLD | 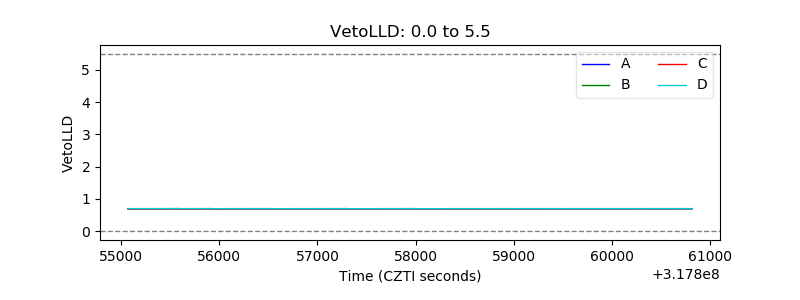 |
| Alpha Counter | 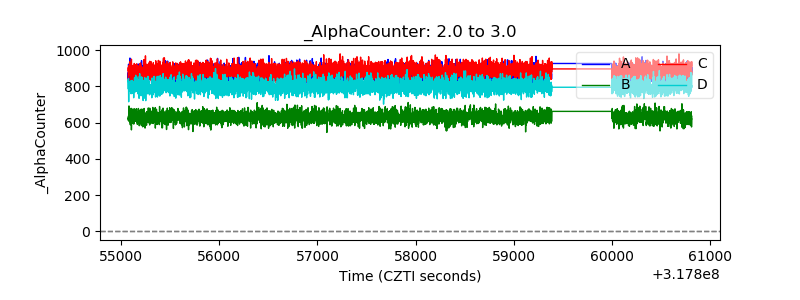 |
| _CPM_Rate | 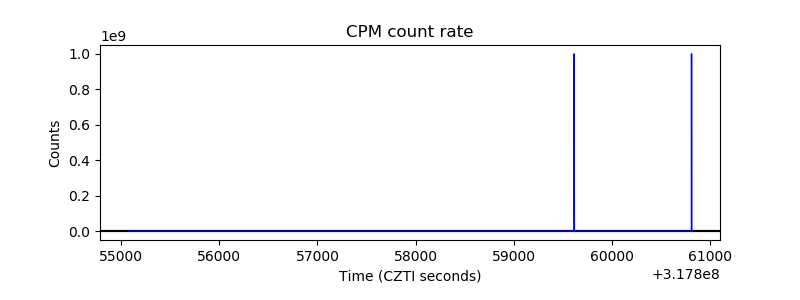 |
| CZT Counter | 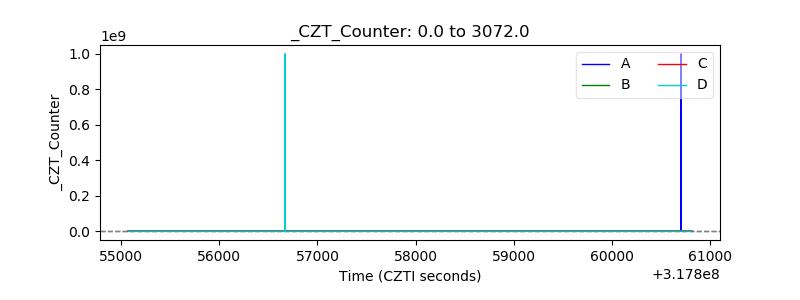 |
| +2.5 Volts monitor | 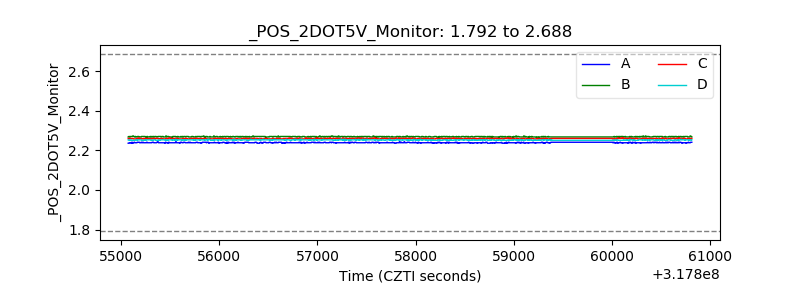 |
| +5 Volts monitor |  |
| _ROLL_ROT | 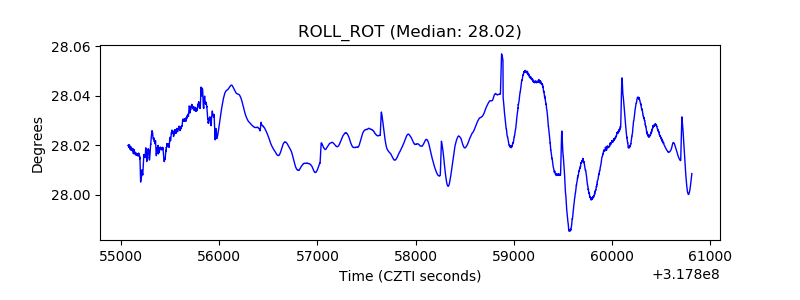 |
| _Roll_DEC | 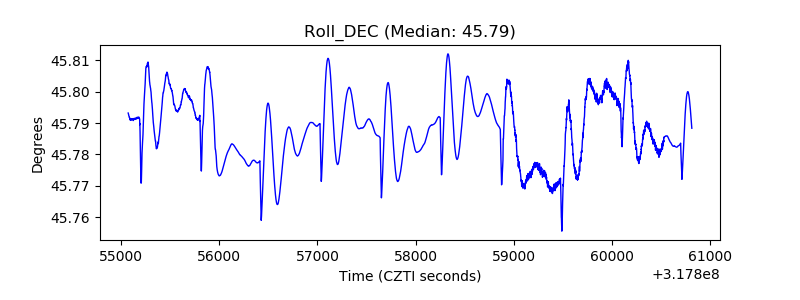 |
| _Roll_RA | 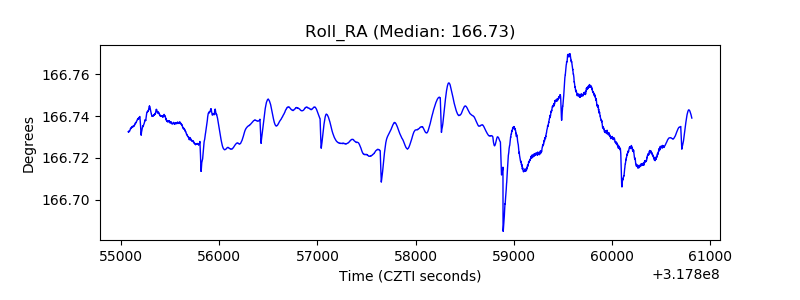 |
| Veto Counter | 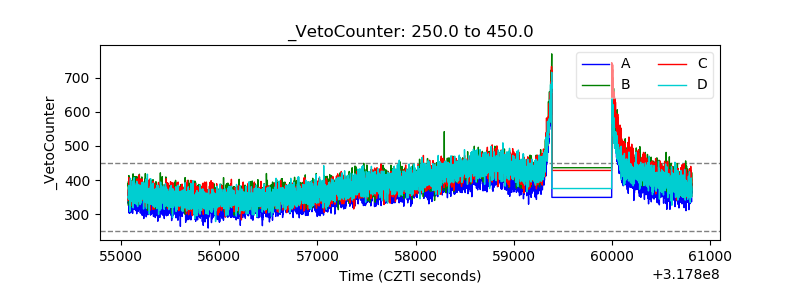 |