| Param | Original file | Final file |
|---|---|---|
| Filename | modeM0/AS1A07_138T04_9000003462_23423cztM0_level2.evt | modeM0/AS1A07_138T04_9000003462_23423cztM0_level2_quad_clean.evt |
| Size (bytes) | 473,489,280 | 75,061,440 |
| Size | 451.6 MB | 71.6 MB |
| Events in quadrant A | 3,103,624 | 463,269 |
| Events in quadrant B | 3,279,899 | 465,455 |
| Events in quadrant C | 3,288,385 | 447,403 |
| Events in quadrant D | 4,226,310 | 443,553 |
| Mode M0 | |||
|---|---|---|---|
| Quadrant | BADHDUFLAG | Total packets | Discarded packets |
| A | 0 | 13315 | 1 |
| B | 0 | 13755 | 1 |
| C | 0 | 13612 | 1 |
| D | 0 | 16884 | 1 |
| Mode SS | |||
|---|---|---|---|
| Quadrant | BADHDUFLAG | Total packets | Discarded packets |
| A | 0 | 132 | 0 |
| B | 0 | 132 | 0 |
| C | 0 | 132 | 0 |
| D | 0 | 132 | 0 |
| Mode M9 | |||
|---|---|---|---|
| Quadrant | BADHDUFLAG | Total packets | Discarded packets |
| A | 0 | 7 | 0 |
| B | 0 | 7 | 0 |
| C | 0 | 7 | 0 |
| D | 0 | 7 | 0 |
| Quadrant | Total seconds | Saturated seconds | Saturation percentage |
|---|---|---|---|
| A | 6495 | 76 | 1.170131% |
| B | 6495 | 101 | 1.555042% |
| C | 6495 | 122 | 1.878368% |
| D | 6496 | 364 | 5.603448% |
Noise dominated data is calculated using 1-second bins in cleaned event files. If a bin has >2000 counts, and if more than 50% of those come from <1% of pixels, then it is considered to be noise-dominated and hence unusable.
| Quadrant | # 1 sec bins | Bins with >0 counts | Bins with >2000 counts | High rate bins dominated by noise | Noise dominated (total time) | Noise dominated (detector-on time) | Marked lightcurve |
|---|---|---|---|---|---|---|---|
| A | 7165 | 6495 | 0 | 0 | 0.00% | 0.00% | 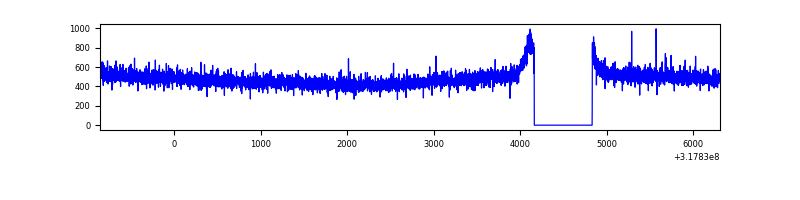 |
| B | 7165 | 6495 | 1 | 1 | 0.01% | 0.02% | 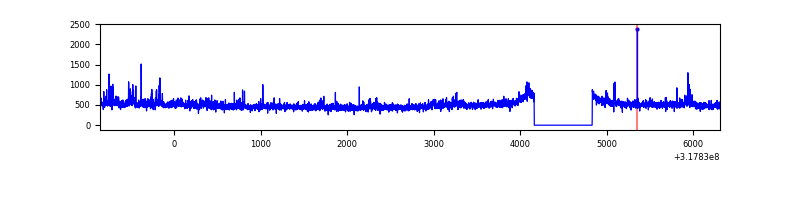 |
| C | 7165 | 6495 | 0 | 0 | 0.00% | 0.00% | 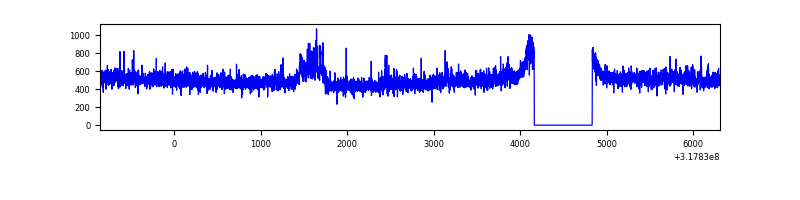 |
| D | 7166 | 6496 | 257 | 257 | 3.59% | 3.96% | 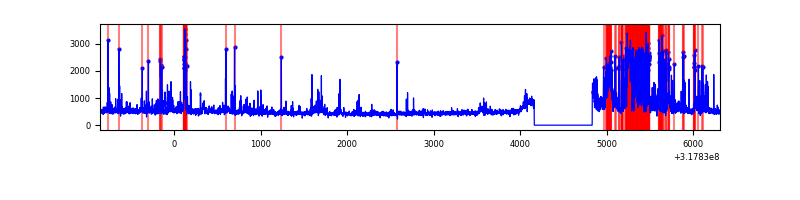 |
Top three noisy pixels from each quadrant. If the there are fewer than three noisy pixels in the level2.evt file, extra rows are filled as -1
| Pixel properties | Quadrant properties | ||||||
|---|---|---|---|---|---|---|---|
| Quadrant | DetID | PixID | Counts | Sigma | Mean | Median | Sigma |
| A | 13 | 254 | 9264 | 51.88 | 803 | 785 | 163.4 |
| A | 3 | 137 | 6994 | 37.99 | 803 | 785 | 163.4 |
| A | 0 | 226 | 6965 | 37.82 | 803 | 785 | 163.4 |
| B | 0 | 190 | 56492 | 367.97 | 795 | 776 | 151.4 |
| B | 0 | 189 | 56267 | 366.48 | 795 | 776 | 151.4 |
| B | 3 | 209 | 37038 | 239.49 | 795 | 776 | 151.4 |
| C | 14 | 238 | 122317 | 684.3 | 764 | 768 | 177.6 |
| C | 10 | 9 | 112319 | 628.02 | 764 | 768 | 177.6 |
| C | 8 | 208 | 66008 | 367.29 | 764 | 768 | 177.6 |
| D | 1 | 52 | 968139 | 5214.4 | 767 | 745 | 185.5 |
| D | 12 | 233 | 117884 | 631.4 | 767 | 745 | 185.5 |
| D | 7 | 38 | 94133 | 503.38 | 767 | 745 | 185.5 |
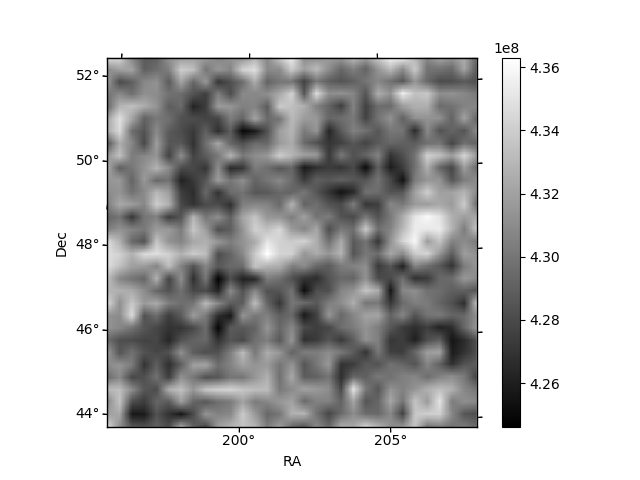
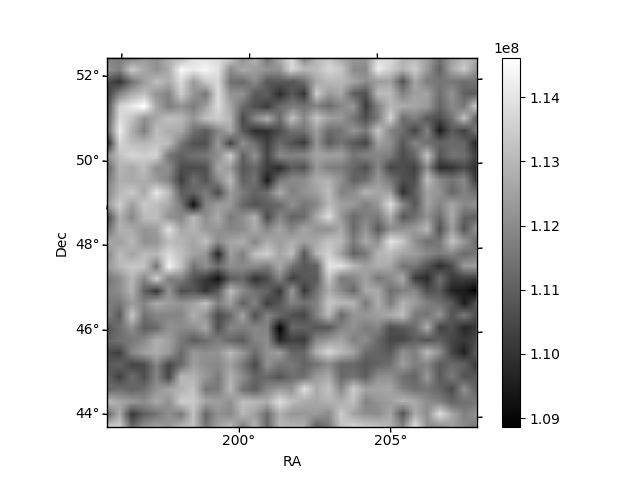
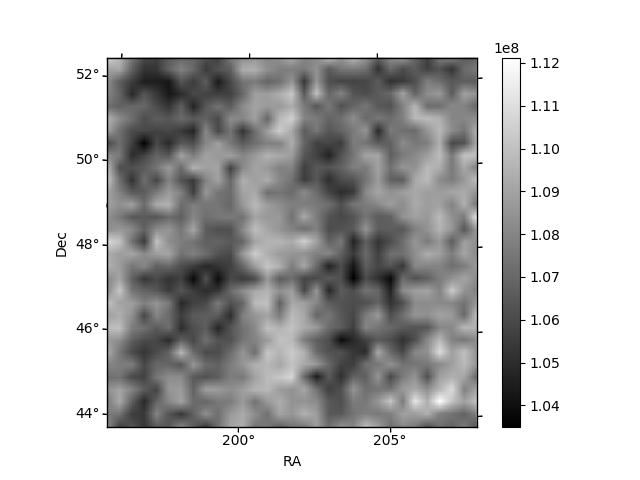
Histogram calculated using DETX and DETY for each event in the final _common_clean file
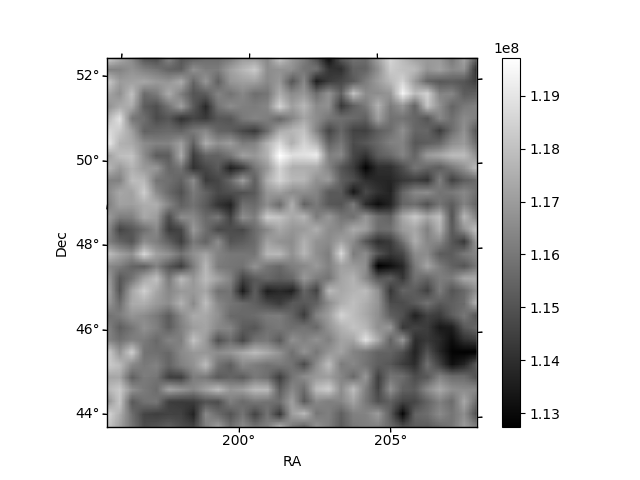
| Quadrant A | 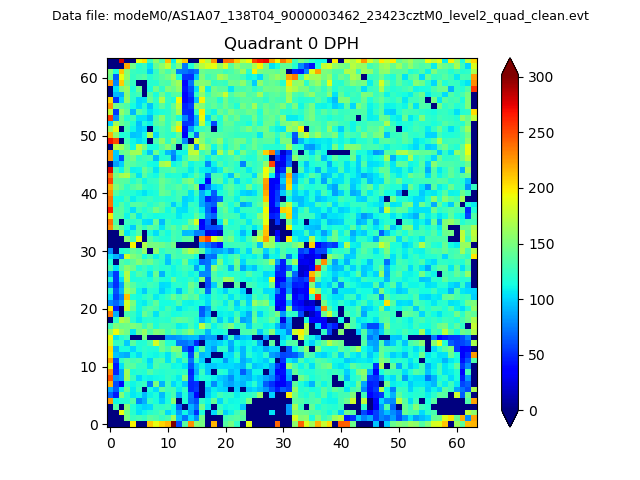 |
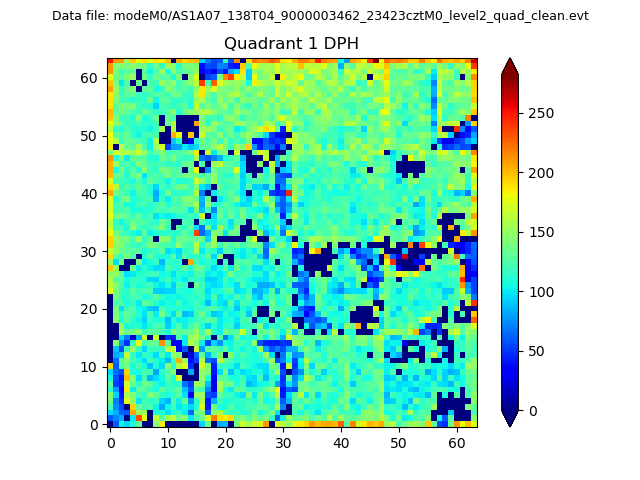 |
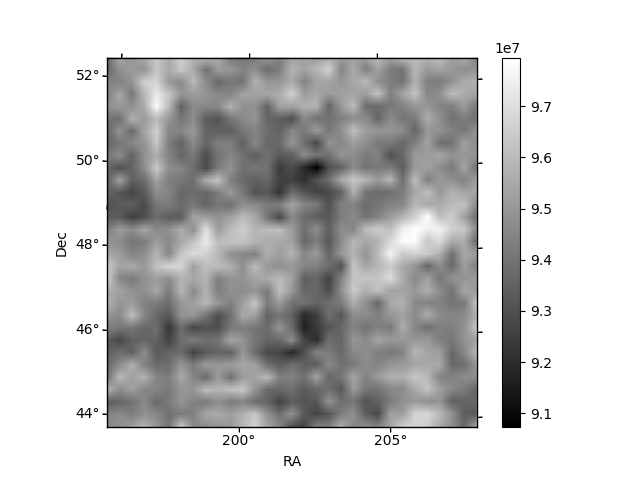
Quadrant B |
|---|---|---|---|
| Quadrant D | 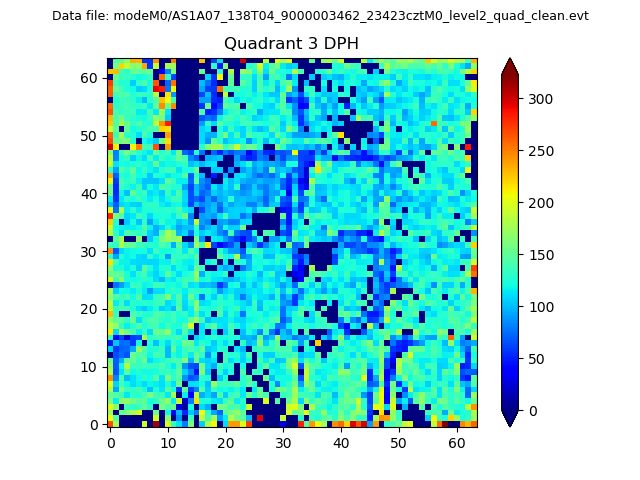 |
 |
Quadrant C |
| Plot type | Count rate plots | Images |
|---|---|---|
| Comparison with Poisson distribution Blue bars denote a histogram of data divided into 1 sec bins. Red curve is a Poisson curve with rate = median count rate of data. |
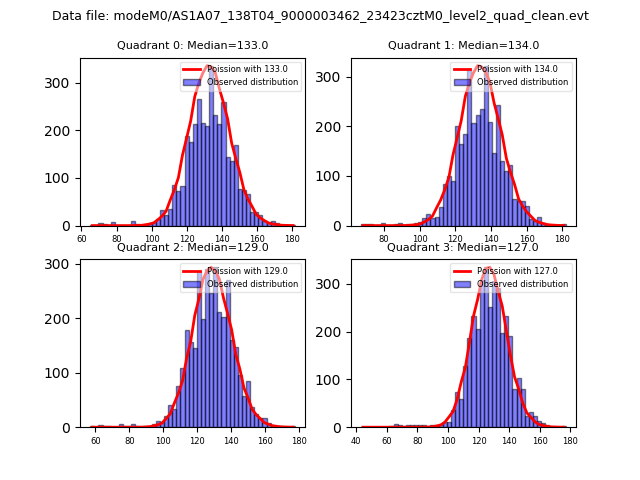 |
 |
| Quadrant-wise count rates Data is divided into 100 sec bins |
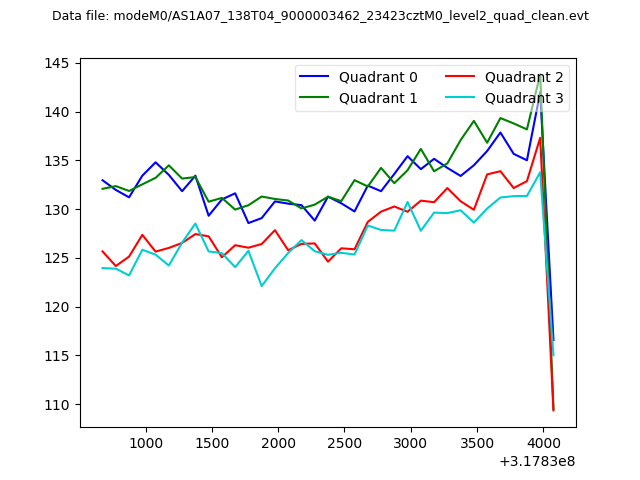 |
|
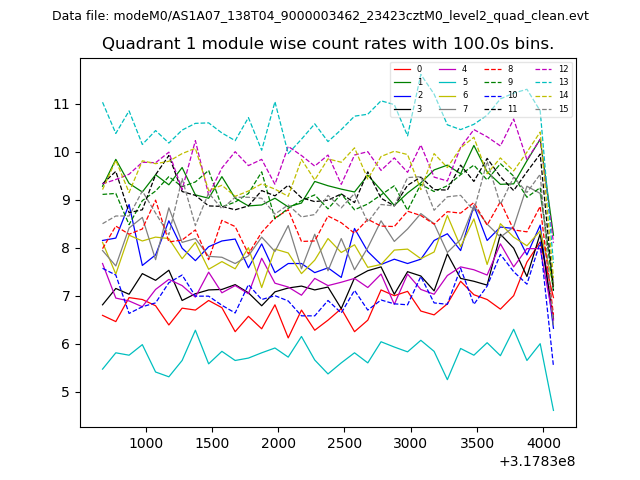
| Module-wise count rates for Quadrant A Data is divided into 100 sec bins |
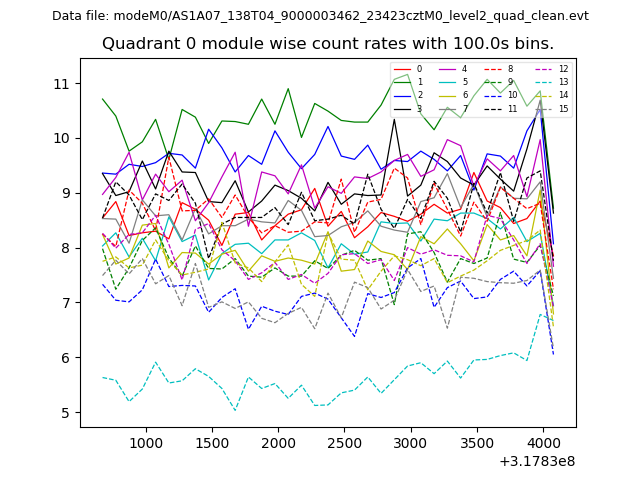 |
 |
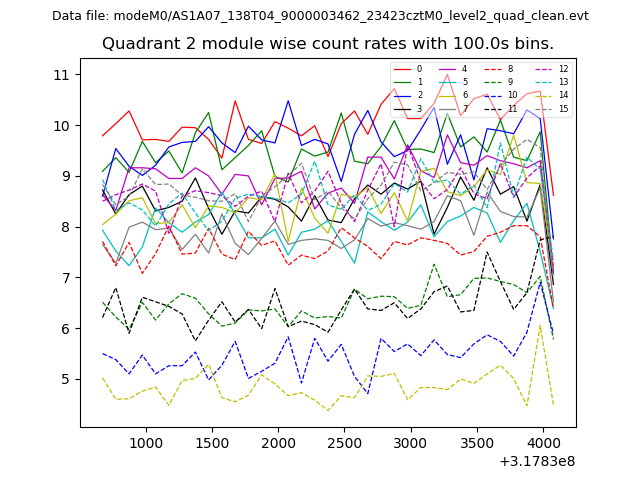
| Module-wise count rates for Quadrant B Data is divided into 100 sec bins |
 |
 |
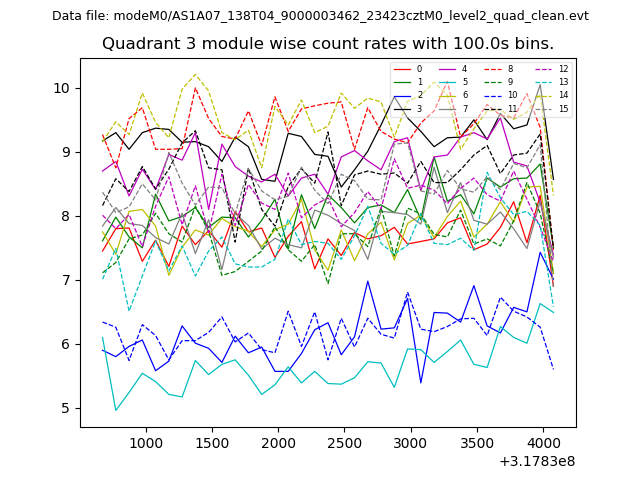
| Module-wise count rates for Quadrant C Data is divided into 100 sec bins |
 |
 |
| Module-wise count rates for Quadrant D Data is divided into 100 sec bins |
 |
 |
| Parameter | Plot |
|---|---|
| CZT HV Monitor | 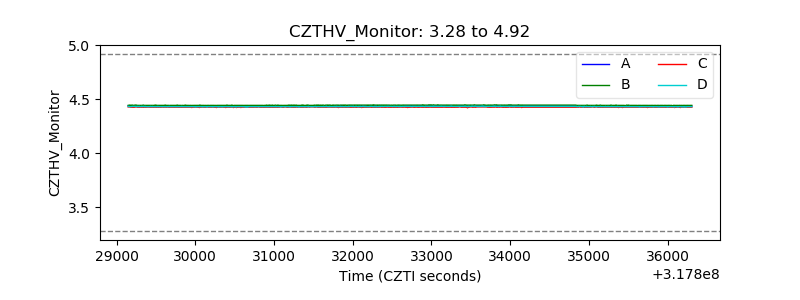 |
| D_VDD | 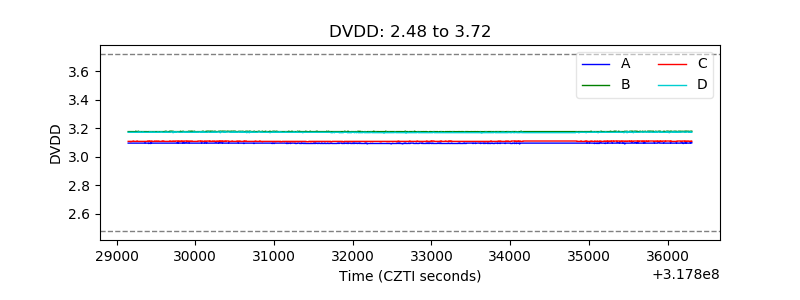 |
| Temperature 1 | 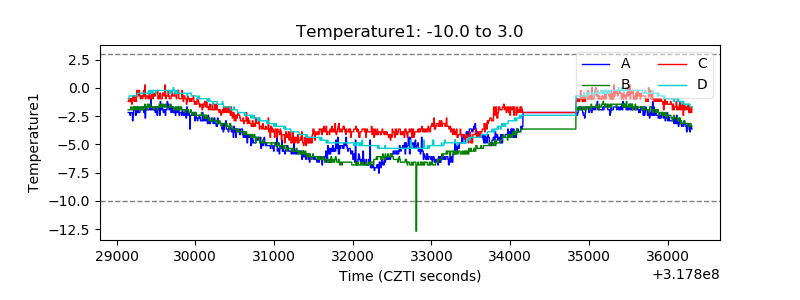 |
| Veto HV Monitor | 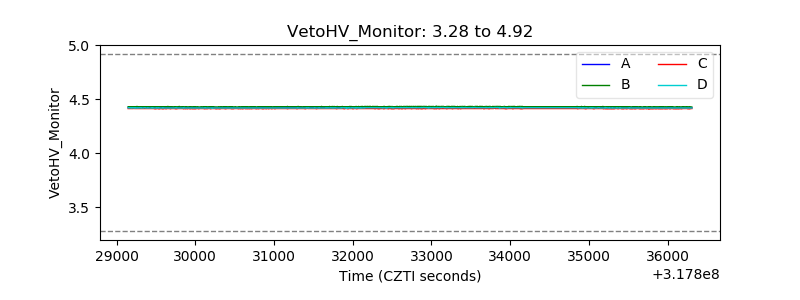 |
| Veto LLD | 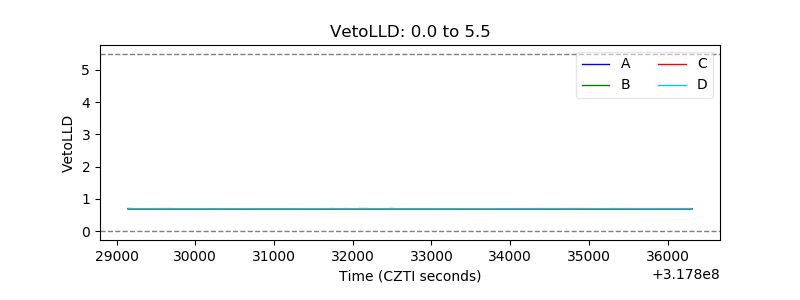 |
| Alpha Counter | 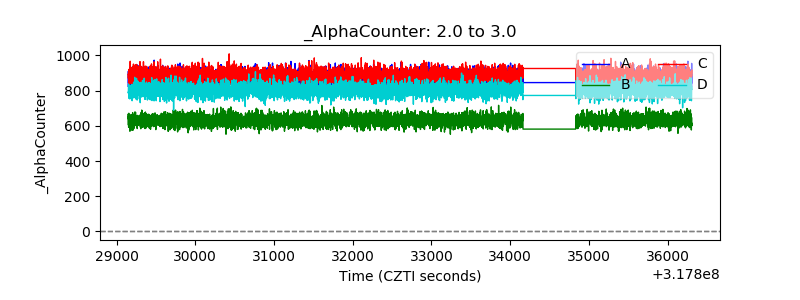 |
| _CPM_Rate | 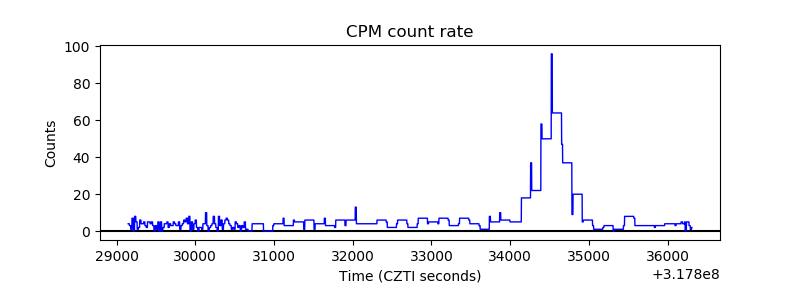 |
| CZT Counter | 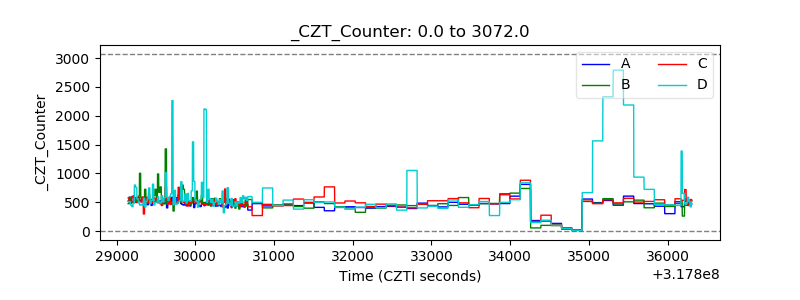 |
| +2.5 Volts monitor |  |
| +5 Volts monitor | 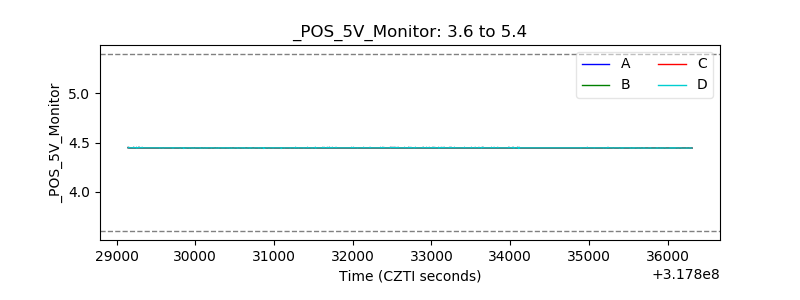 |
| _ROLL_ROT | 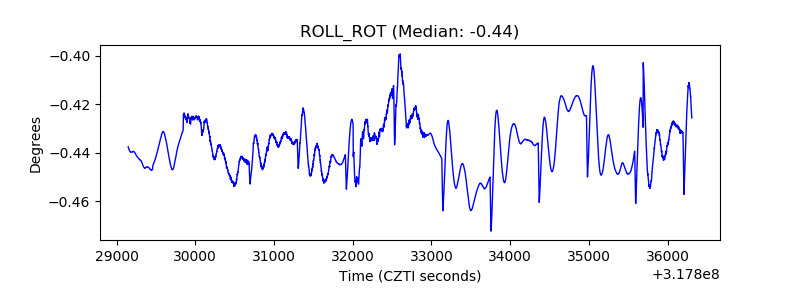 |
| _Roll_DEC |  |
| _Roll_RA | 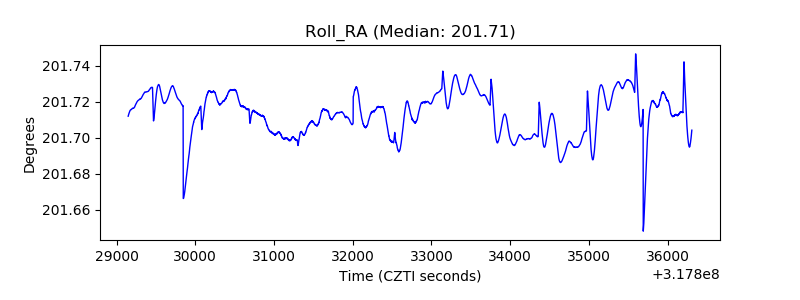 |
| Veto Counter | 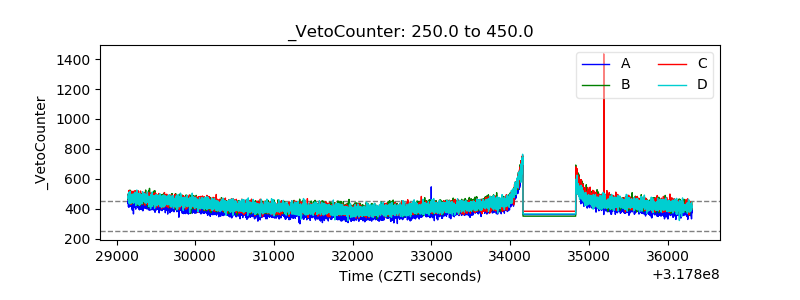 |