| Param | Original file | Final file |
|---|---|---|
| Filename | modeM0/AS1A07_101T02_9000003544_23947cztM0_level2.evt | modeM0/AS1A07_101T02_9000003544_23947cztM0_level2_quad_clean.evt |
| Size (bytes) | 619,931,520 | 109,391,040 |
| Size | 591.2 MB | 104.3 MB |
| Events in quadrant A | 3,955,153 | 691,667 |
| Events in quadrant B | 4,052,506 | 702,403 |
| Events in quadrant C | 4,034,838 | 683,032 |
| Events in quadrant D | 6,171,151 | 660,993 |
| Mode SS | |||
|---|---|---|---|
| Quadrant | BADHDUFLAG | Total packets | Discarded packets |
| A | 0 | 172 | 0 |
| B | 0 | 172 | 0 |
| C | 0 | 172 | 0 |
| D | 0 | 172 | 0 |
| Mode M0 | |||
|---|---|---|---|
| Quadrant | BADHDUFLAG | Total packets | Discarded packets |
| A | 0 | 17334 | 21 |
| B | 0 | 17435 | 26 |
| C | 0 | 17391 | 26 |
| D | 0 | 24060 | 19 |
| Mode M9 | |||
|---|---|---|---|
| Quadrant | BADHDUFLAG | Total packets | Discarded packets |
| A | 0 | 7 | 0 |
| B | 0 | 7 | 0 |
| C | 0 | 7 | 0 |
| D | 0 | 7 | 0 |
| Quadrant | Total seconds | Saturated seconds | Saturation percentage |
|---|---|---|---|
| A | 8273 | 64 | 0.773601% |
| B | 8271 | 133 | 1.608028% |
| C | 8270 | 172 | 2.079807% |
| D | 8273 | 474 | 5.729481% |
Noise dominated data is calculated using 1-second bins in cleaned event files. If a bin has >2000 counts, and if more than 50% of those come from <1% of pixels, then it is considered to be noise-dominated and hence unusable.
| Quadrant | # 1 sec bins | Bins with >0 counts | Bins with >2000 counts | High rate bins dominated by noise | Noise dominated (total time) | Noise dominated (detector-on time) | Marked lightcurve |
|---|---|---|---|---|---|---|---|
| A | 8958 | 8286 | 0 | 0 | 0.00% | 0.00% | 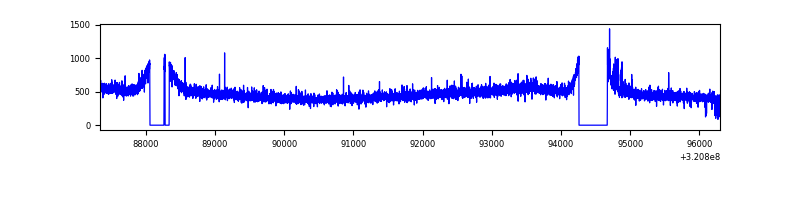 |
| B | 8958 | 8286 | 0 | 0 | 0.00% | 0.00% | 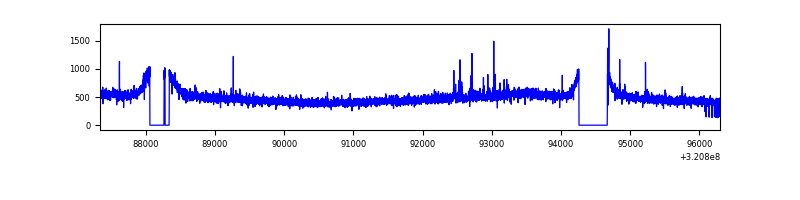 |
| C | 8957 | 8284 | 1 | 1 | 0.01% | 0.01% | 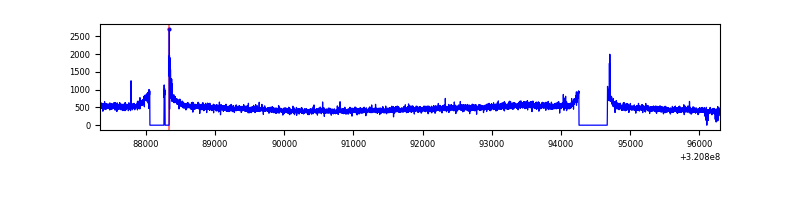 |
| D | 8957 | 8285 | 179 | 179 | 2.00% | 2.16% | 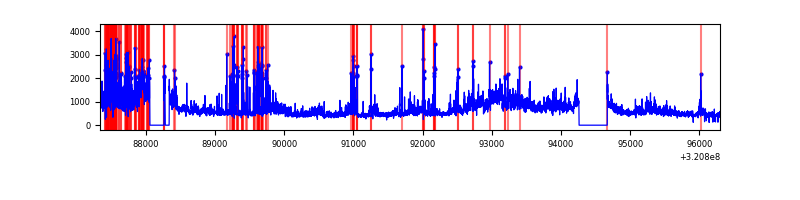 |
Top three noisy pixels from each quadrant. If the there are fewer than three noisy pixels in the level2.evt file, extra rows are filled as -1
| Pixel properties | Quadrant properties | ||||||
|---|---|---|---|---|---|---|---|
| Quadrant | DetID | PixID | Counts | Sigma | Mean | Median | Sigma |
| A | 14 | 111 | 25168 | 117.38 | 1018 | 996 | 205.9 |
| A | 13 | 254 | 12822 | 57.43 | 1018 | 996 | 205.9 |
| A | 3 | 137 | 9303 | 40.34 | 1018 | 996 | 205.9 |
| B | 0 | 197 | 30362 | 149.66 | 1018 | 990 | 196.3 |
| B | 12 | 111 | 24479 | 119.69 | 1018 | 990 | 196.3 |
| B | 11 | 111 | 21261 | 103.29 | 1018 | 990 | 196.3 |
| C | 14 | 238 | 153713 | 666.35 | 978 | 982 | 229.2 |
| C | 0 | 10 | 27916 | 117.51 | 978 | 982 | 229.2 |
| C | 8 | 128 | 14562 | 59.25 | 978 | 982 | 229.2 |
| D | 12 | 218 | 969090 | 4091.98 | 964 | 935 | 236.6 |
| D | 8 | 195 | 932444 | 3937.1 | 964 | 935 | 236.6 |
| D | 1 | 52 | 239411 | 1007.94 | 964 | 935 | 236.6 |
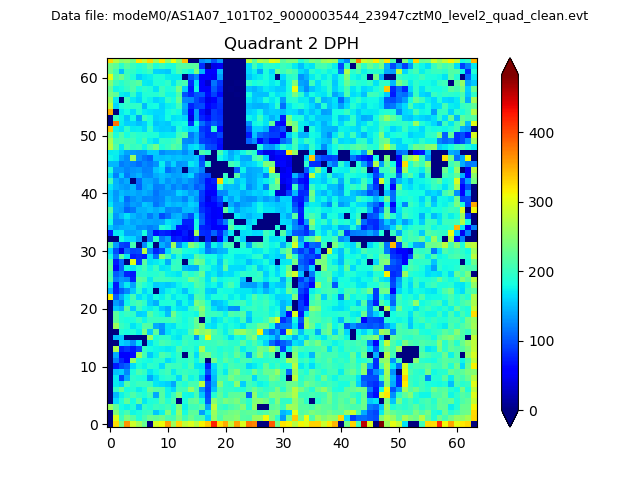
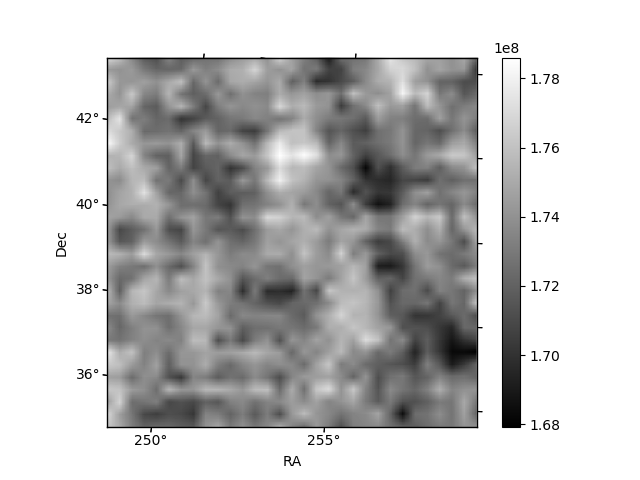
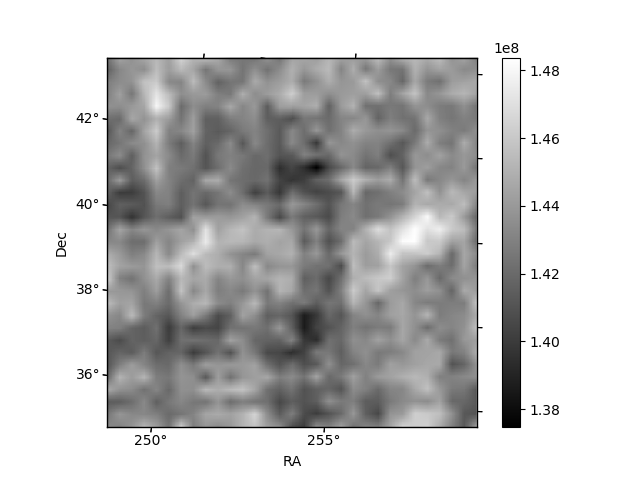
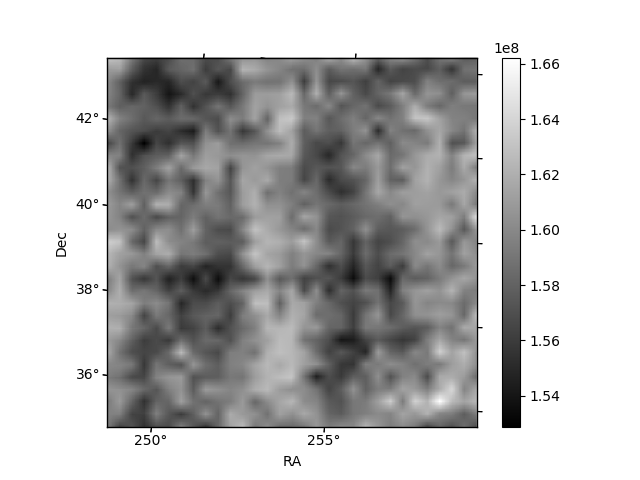
Histogram calculated using DETX and DETY for each event in the final _common_clean file
| Quadrant A | 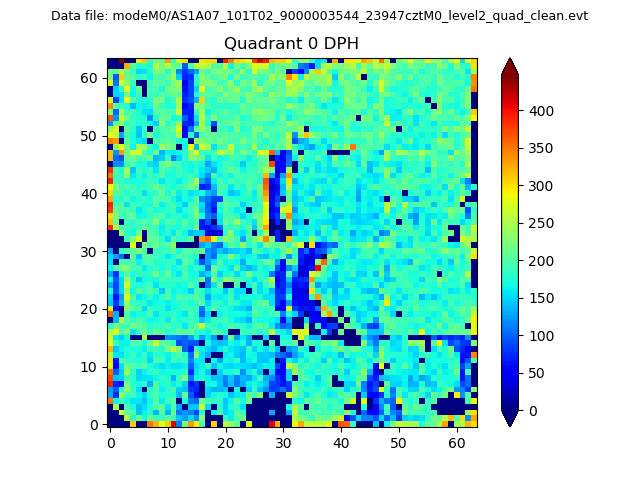 |
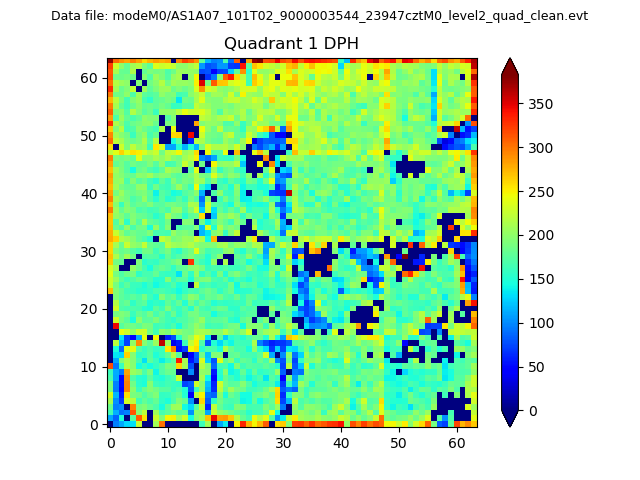 |
Quadrant B |
|---|---|---|---|
| Quadrant D | 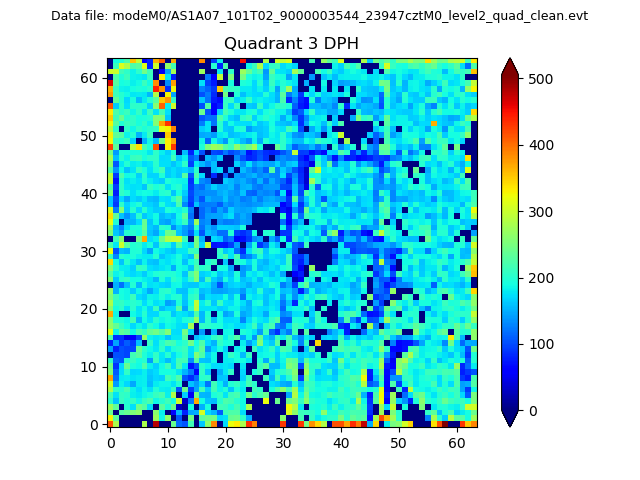 |
 |
Quadrant C |
| Plot type | Count rate plots | Images |
|---|---|---|
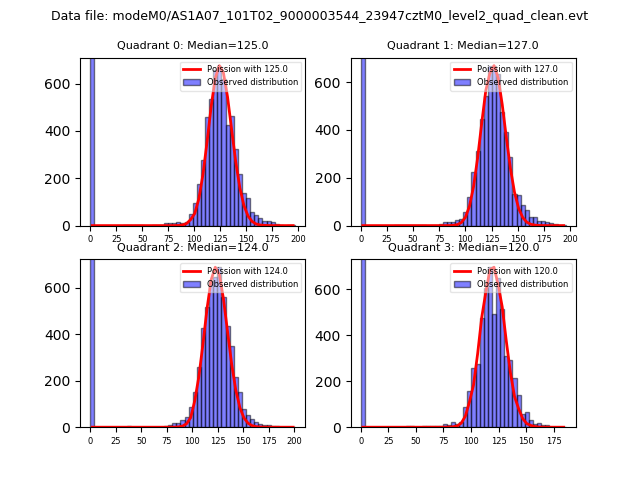
| Comparison with Poisson distribution Blue bars denote a histogram of data divided into 1 sec bins. Red curve is a Poisson curve with rate = median count rate of data. |
 |
 |
| Quadrant-wise count rates Data is divided into 100 sec bins |
 |
|
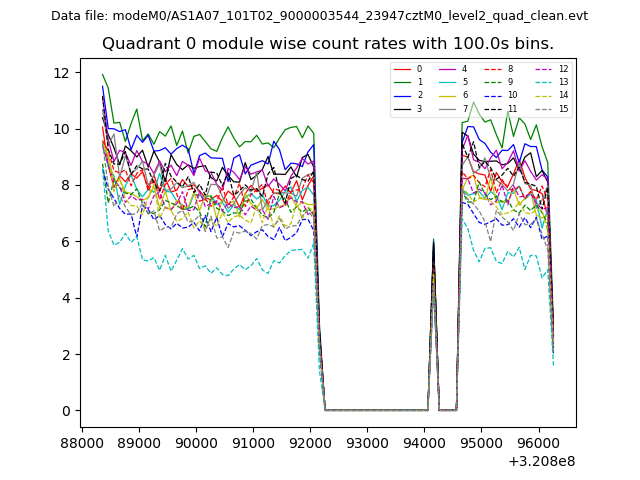
| Module-wise count rates for Quadrant A Data is divided into 100 sec bins |
 |
 |
| Module-wise count rates for Quadrant B Data is divided into 100 sec bins |
 |
 |
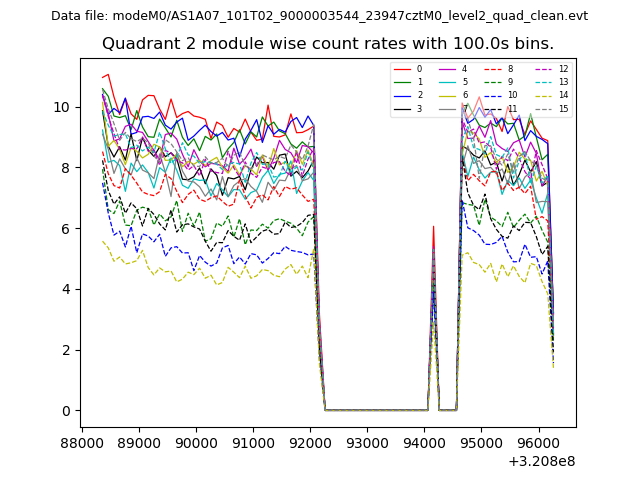
| Module-wise count rates for Quadrant C Data is divided into 100 sec bins |
 |
 |
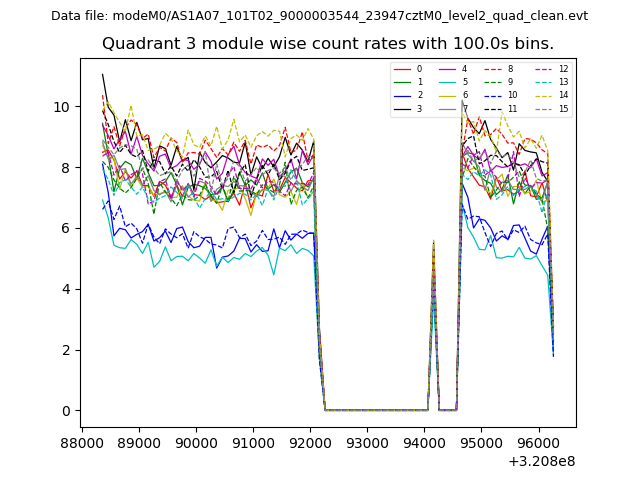
| Module-wise count rates for Quadrant D Data is divided into 100 sec bins |
 |
 |
| Parameter | Plot |
|---|---|
| CZT HV Monitor | 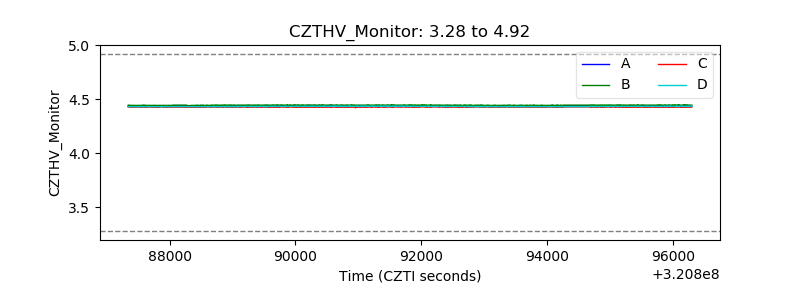 |
| D_VDD | 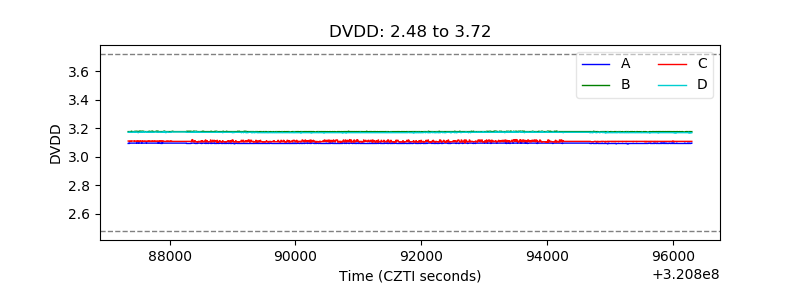 |
| Temperature 1 | 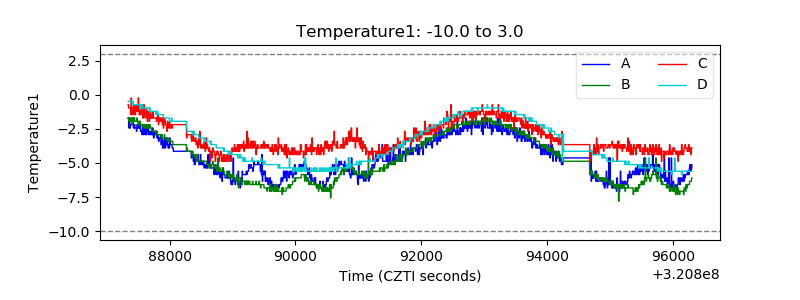 |
| Veto HV Monitor | 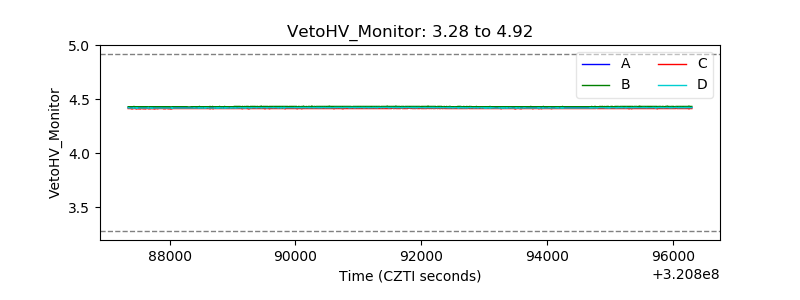 |
| Veto LLD | 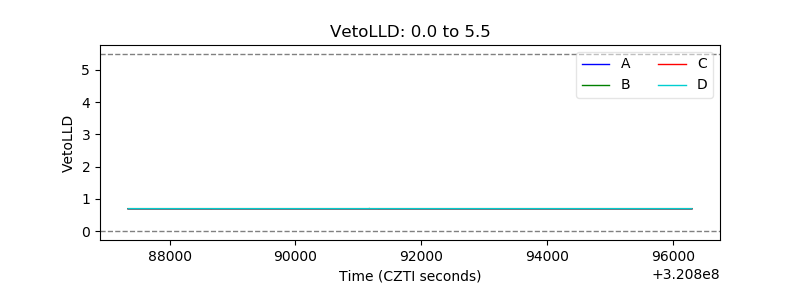 |
| Alpha Counter | 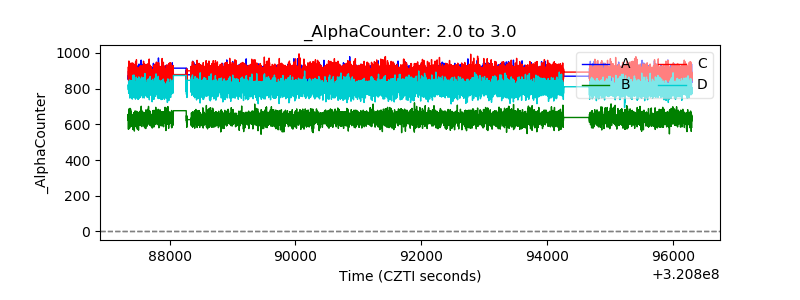 |
| _CPM_Rate | 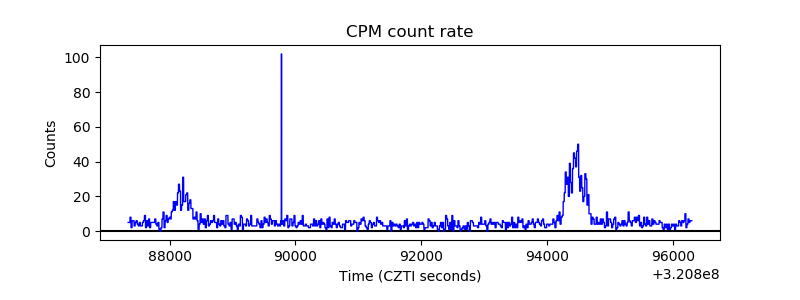 |
| CZT Counter | 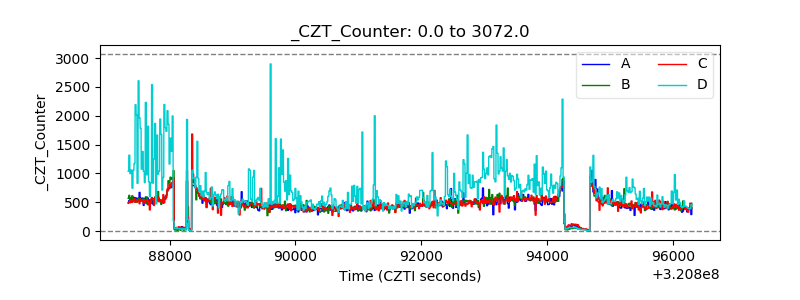 |
| +2.5 Volts monitor |  |
| +5 Volts monitor |  |
| _ROLL_ROT | 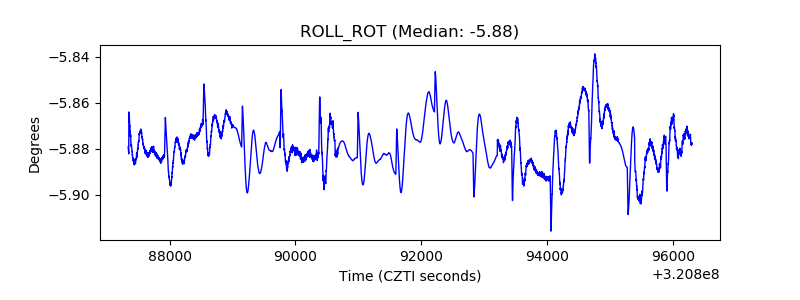 |
| _Roll_DEC | 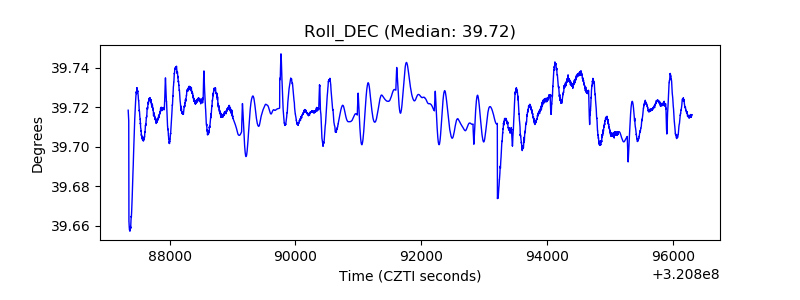 |
| _Roll_RA | 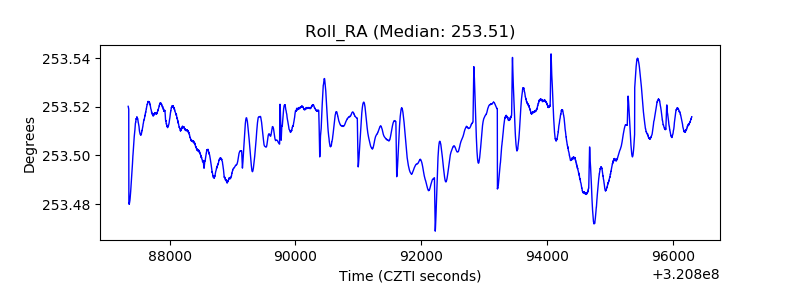 |
| Veto Counter | 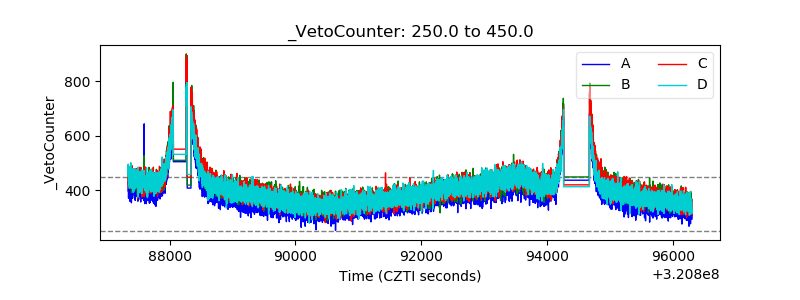 |