| Param | Original file | Final file |
|---|---|---|
| Filename | modeM0/AS1A07_101T02_9000003544_23964cztM0_level2.evt | modeM0/AS1A07_101T02_9000003544_23964cztM0_level2_quad_clean.evt |
| Size (bytes) | 278,328,960 | 70,050,240 |
| Size | 265.4 MB | 66.8 MB |
| Events in quadrant A | 1,847,205 | 462,853 |
| Events in quadrant B | 1,897,108 | 469,820 |
| Events in quadrant C | 1,919,335 | 458,421 |
| Events in quadrant D | 2,484,092 | 439,902 |
| Mode SS | |||
|---|---|---|---|
| Quadrant | BADHDUFLAG | Total packets | Discarded packets |
| A | 0 | 84 | 0 |
| B | 0 | 84 | 0 |
| C | 0 | 84 | 0 |
| D | 0 | 84 | 0 |
| Mode M0 | |||
|---|---|---|---|
| Quadrant | BADHDUFLAG | Total packets | Discarded packets |
| A | 0 | 8516 | 1 |
| B | 0 | 8583 | 1 |
| C | 0 | 8634 | 1 |
| D | 0 | 10402 | 1 |
| Mode M9 | |||
|---|---|---|---|
| Quadrant | BADHDUFLAG | Total packets | Discarded packets |
| A | 0 | 3 | 0 |
| B | 0 | 3 | 0 |
| C | 0 | 3 | 0 |
| D | 0 | 3 | 0 |
| Quadrant | Total seconds | Saturated seconds | Saturation percentage |
|---|---|---|---|
| A | 4119 | 30 | 0.728332% |
| B | 4120 | 69 | 1.674757% |
| C | 4120 | 76 | 1.844660% |
| D | 4120 | 188 | 4.563107% |
Noise dominated data is calculated using 1-second bins in cleaned event files. If a bin has >2000 counts, and if more than 50% of those come from <1% of pixels, then it is considered to be noise-dominated and hence unusable.
| Quadrant | # 1 sec bins | Bins with >0 counts | Bins with >2000 counts | High rate bins dominated by noise | Noise dominated (total time) | Noise dominated (detector-on time) | Marked lightcurve |
|---|---|---|---|---|---|---|---|
| A | 4444 | 4120 | 0 | 0 | 0.00% | 0.00% | 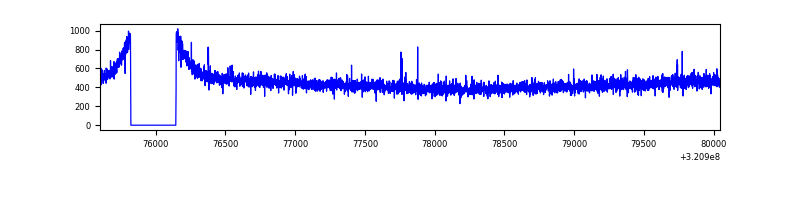 |
| B | 4445 | 4121 | 0 | 0 | 0.00% | 0.00% | 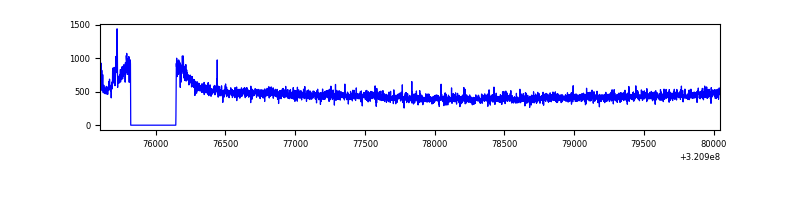 |
| C | 4445 | 4121 | 1 | 1 | 0.02% | 0.02% | 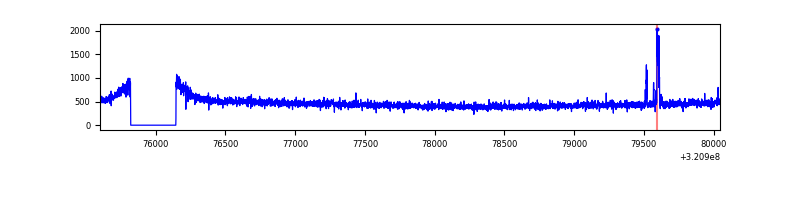 |
| D | 4445 | 4121 | 116 | 116 | 2.61% | 2.81% | 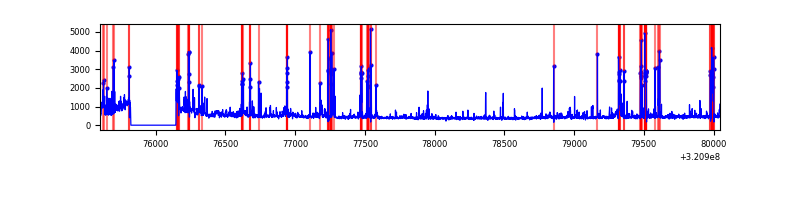 |
Top three noisy pixels from each quadrant. If the there are fewer than three noisy pixels in the level2.evt file, extra rows are filled as -1
| Pixel properties | Quadrant properties | ||||||
|---|---|---|---|---|---|---|---|
| Quadrant | DetID | PixID | Counts | Sigma | Mean | Median | Sigma |
| A | 13 | 254 | 6859 | 64.97 | 478 | 468 | 98.4 |
| A | 3 | 137 | 4312 | 39.08 | 478 | 468 | 98.4 |
| A | 0 | 226 | 4088 | 36.8 | 478 | 468 | 98.4 |
| B | 12 | 111 | 11521 | 118.38 | 480 | 469 | 93.4 |
| B | 0 | 197 | 10668 | 109.24 | 480 | 469 | 93.4 |
| B | 11 | 111 | 9859 | 100.58 | 480 | 469 | 93.4 |
| C | 14 | 238 | 72990 | 667.08 | 462 | 467 | 108.7 |
| C | 0 | 239 | 41128 | 374.01 | 462 | 467 | 108.7 |
| C | 13 | 61 | 3193 | 25.07 | 462 | 467 | 108.7 |
| D | 12 | 218 | 581521 | 5210.64 | 455 | 442 | 111.5 |
| D | 1 | 52 | 107783 | 962.55 | 455 | 442 | 111.5 |
| D | 12 | 250 | 32310 | 285.77 | 455 | 442 | 111.5 |
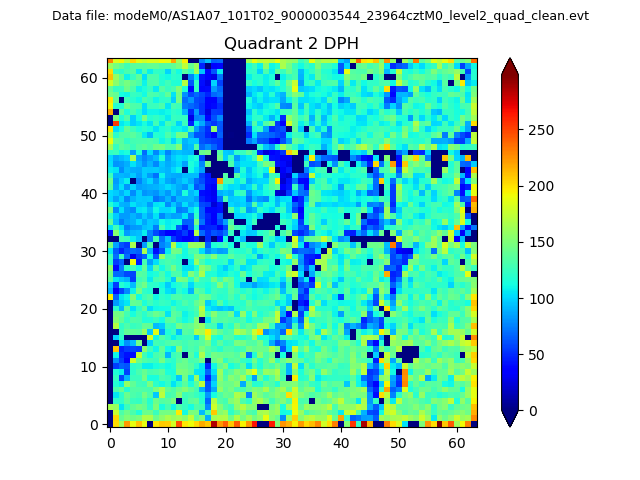
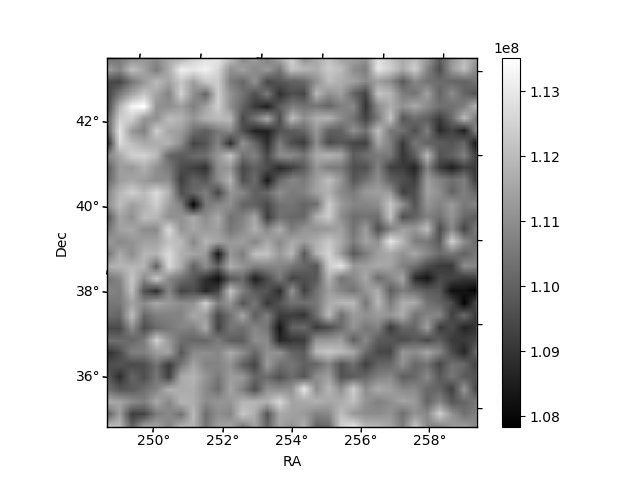
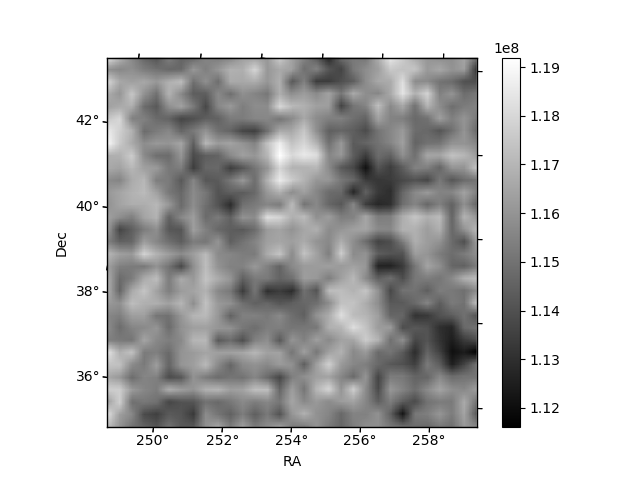
Histogram calculated using DETX and DETY for each event in the final _common_clean file
| Quadrant A | 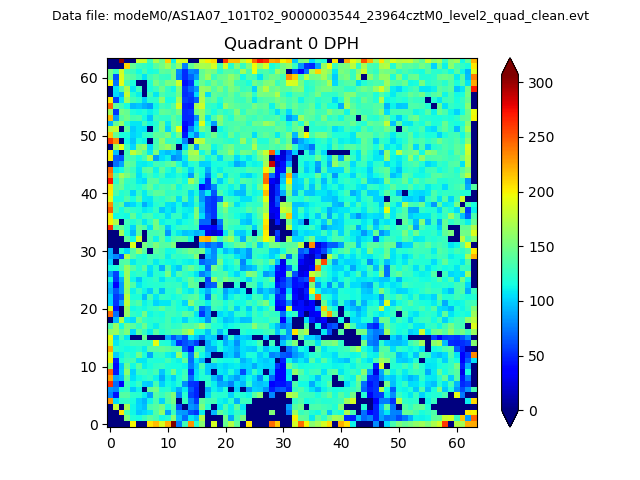 |
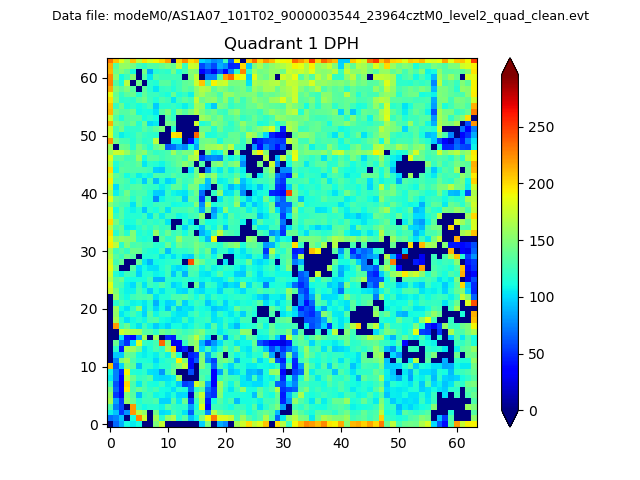 |
Quadrant B |
|---|---|---|---|
| Quadrant D | 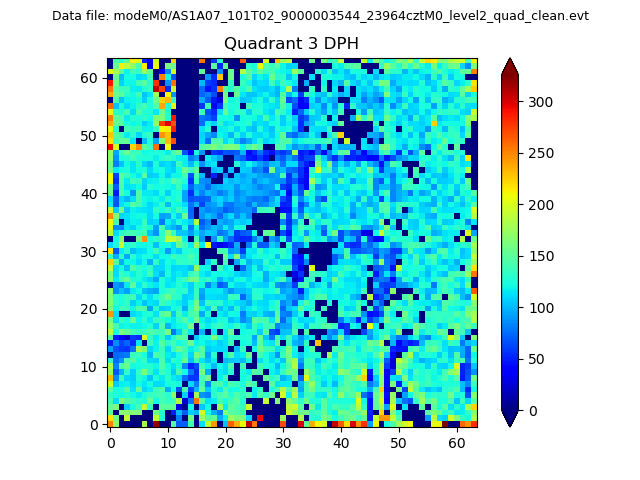 |
 |
Quadrant C |
| Plot type | Count rate plots | Images |
|---|---|---|
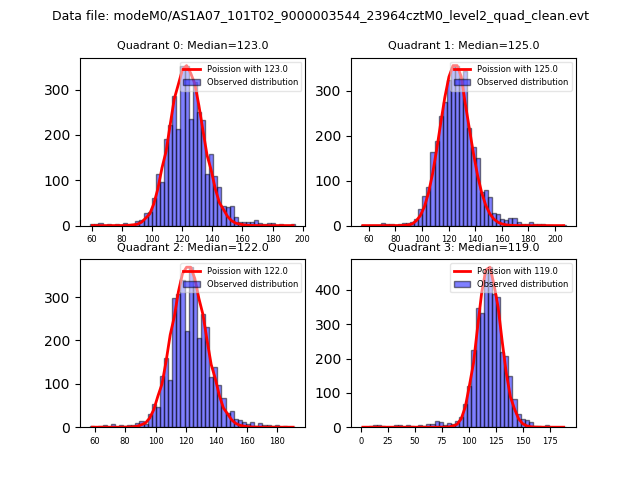
| Comparison with Poisson distribution Blue bars denote a histogram of data divided into 1 sec bins. Red curve is a Poisson curve with rate = median count rate of data. |
 |
 |
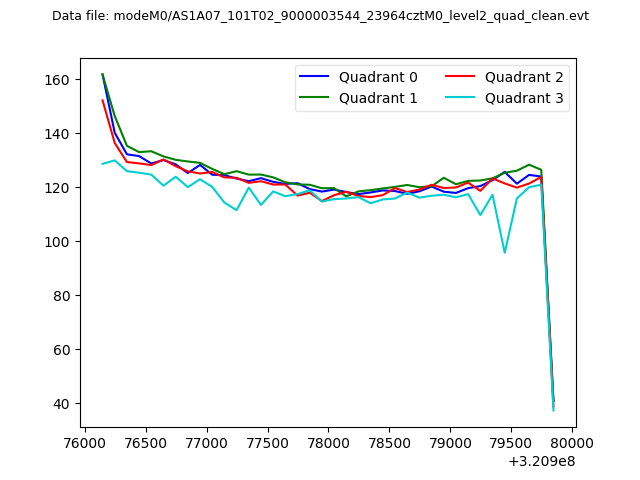
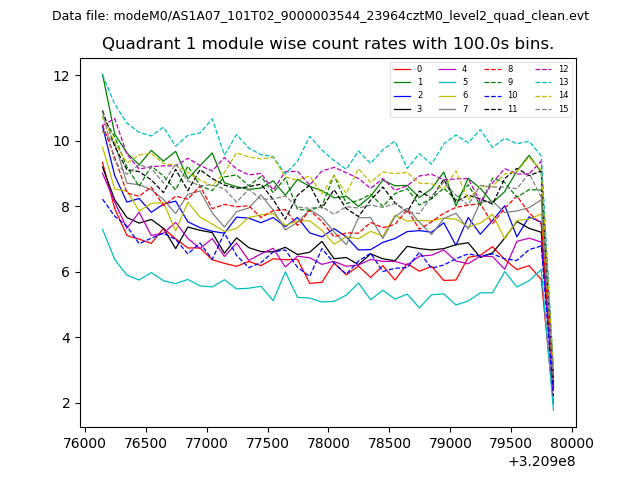
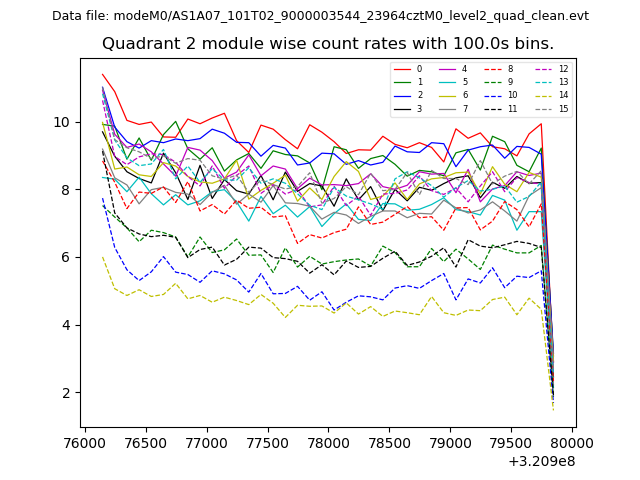
| Quadrant-wise count rates Data is divided into 100 sec bins |
 |
|
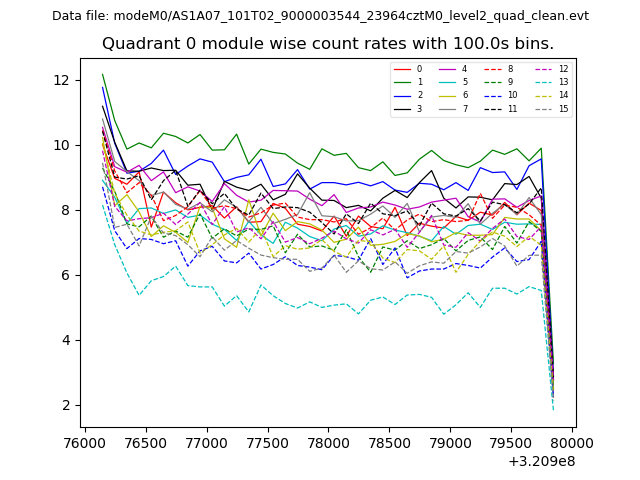
| Module-wise count rates for Quadrant A Data is divided into 100 sec bins |
 |
 |
| Module-wise count rates for Quadrant B Data is divided into 100 sec bins |
 |
 |
| Module-wise count rates for Quadrant C Data is divided into 100 sec bins |
 |
 |
| Module-wise count rates for Quadrant D Data is divided into 100 sec bins |
 |
 |
| Parameter | Plot |
|---|---|
| CZT HV Monitor | 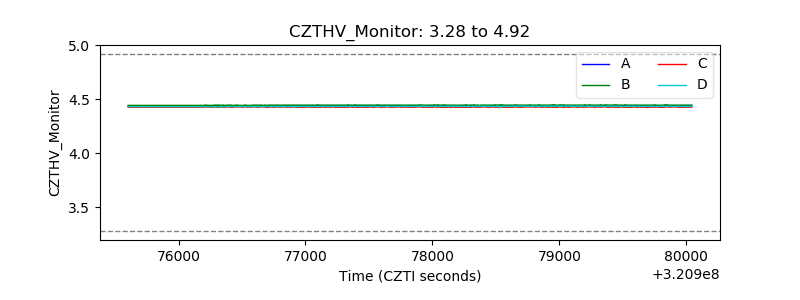 |
| D_VDD | 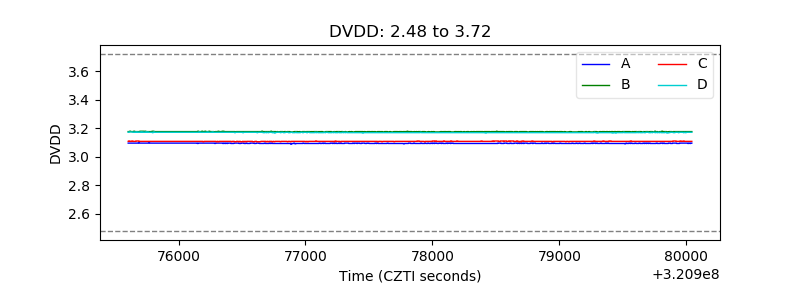 |
| Temperature 1 | 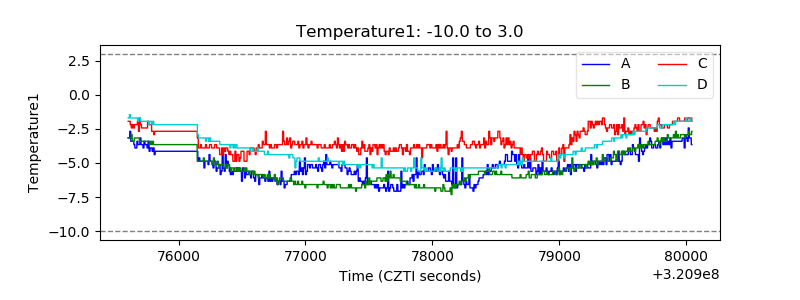 |
| Veto HV Monitor | 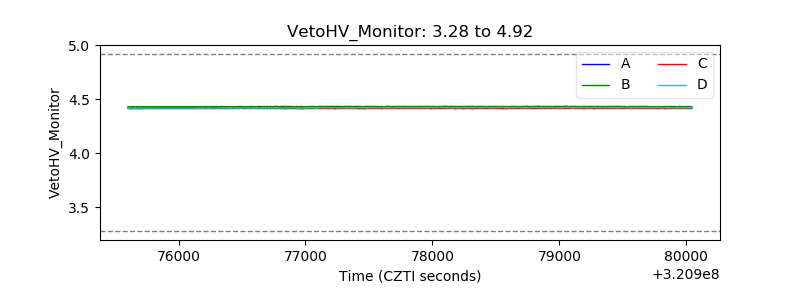 |
| Veto LLD | 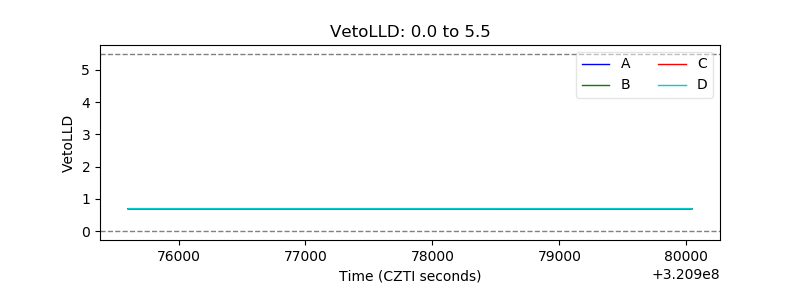 |
| Alpha Counter | 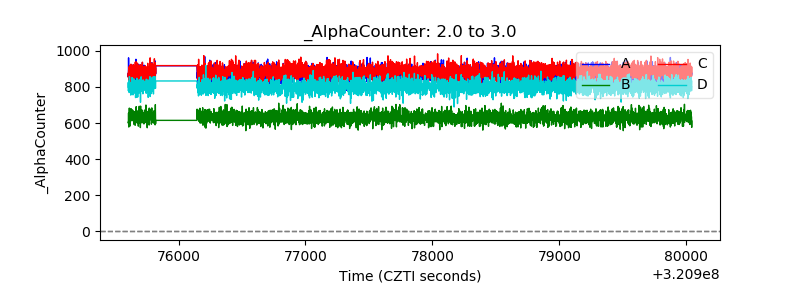 |
| _CPM_Rate |  |
| CZT Counter | 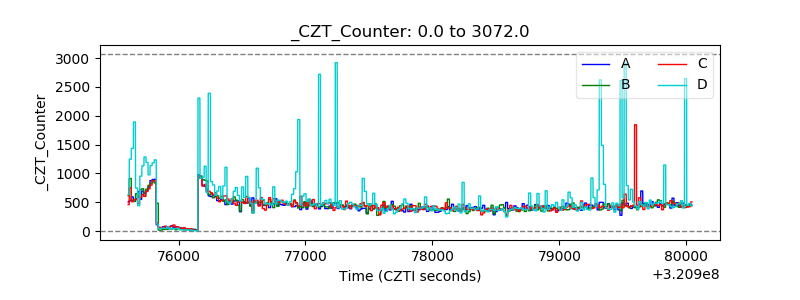 |
| +2.5 Volts monitor |  |
| +5 Volts monitor |  |
| _ROLL_ROT | 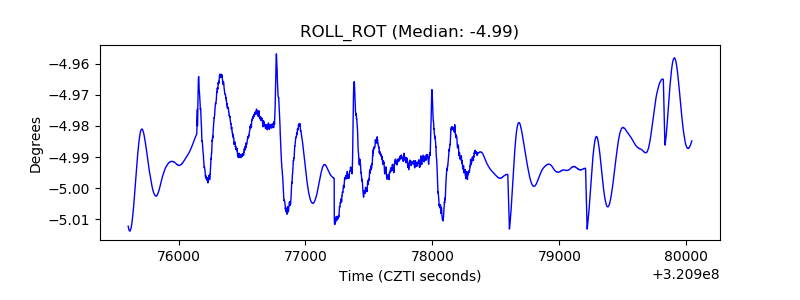 |
| _Roll_DEC | 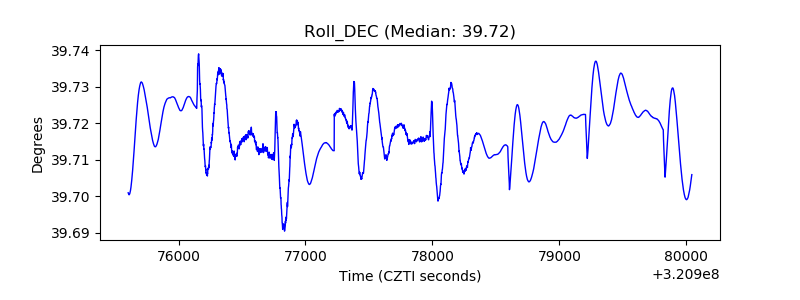 |
| _Roll_RA | 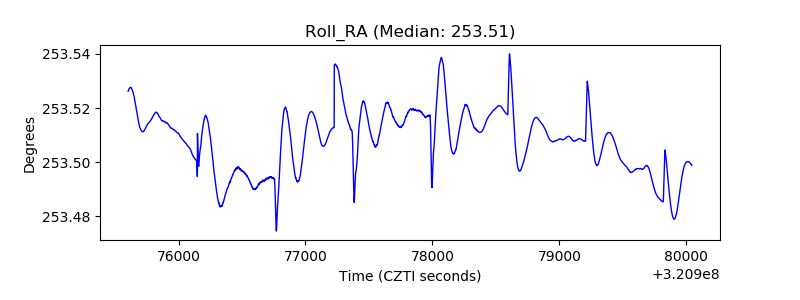 |
| Veto Counter |  |