| Param | Original file | Final file |
|---|---|---|
| Filename | modeM0/AS1C05_002T09_9000003566_24118cztM0_level2.evt | modeM0/AS1C05_002T09_9000003566_24118cztM0_level2_quad_clean.evt |
| Size (bytes) | 272,646,720 | 44,876,160 |
| Size | 260.0 MB | 42.8 MB |
| Events in quadrant A | 1,765,864 | 279,590 |
| Events in quadrant B | 1,801,930 | 282,070 |
| Events in quadrant C | 1,778,909 | 272,599 |
| Events in quadrant D | 2,664,771 | 269,859 |
| Mode M9 | |||
|---|---|---|---|
| Quadrant | BADHDUFLAG | Total packets | Discarded packets |
| A | 0 | 5 | 0 |
| B | 0 | 5 | 0 |
| C | 0 | 5 | 0 |
| D | 0 | 5 | 0 |
| Mode M0 | |||
|---|---|---|---|
| Quadrant | BADHDUFLAG | Total packets | Discarded packets |
| A | 0 | 7484 | 1 |
| B | 0 | 7536 | 1 |
| C | 0 | 7461 | 1 |
| D | 0 | 10305 | 1 |
| Mode SS | |||
|---|---|---|---|
| Quadrant | BADHDUFLAG | Total packets | Discarded packets |
| A | 0 | 74 | 0 |
| B | 0 | 74 | 0 |
| C | 0 | 74 | 0 |
| D | 0 | 74 | 0 |
| Quadrant | Total seconds | Saturated seconds | Saturation percentage |
|---|---|---|---|
| A | 3591 | 81 | 2.255639% |
| B | 3591 | 103 | 2.868282% |
| C | 3591 | 114 | 3.174603% |
| D | 3590 | 325 | 9.052925% |
Noise dominated data is calculated using 1-second bins in cleaned event files. If a bin has >2000 counts, and if more than 50% of those come from <1% of pixels, then it is considered to be noise-dominated and hence unusable.
| Quadrant | # 1 sec bins | Bins with >0 counts | Bins with >2000 counts | High rate bins dominated by noise | Noise dominated (total time) | Noise dominated (detector-on time) | Marked lightcurve |
|---|---|---|---|---|---|---|---|
| A | 4151 | 3592 | 0 | 0 | 0.00% | 0.00% | 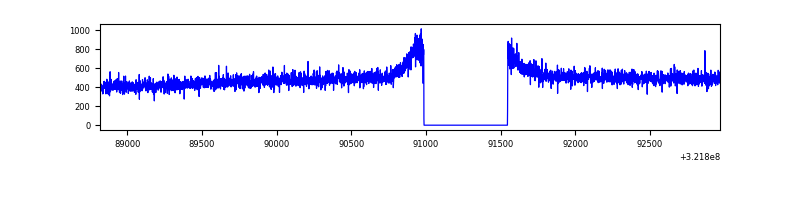 |
| B | 4151 | 3592 | 0 | 0 | 0.00% | 0.00% | 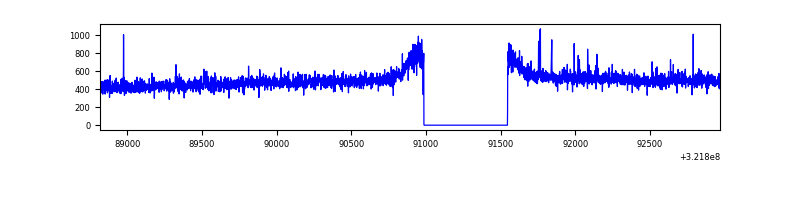 |
| C | 4151 | 3591 | 0 | 0 | 0.00% | 0.00% | 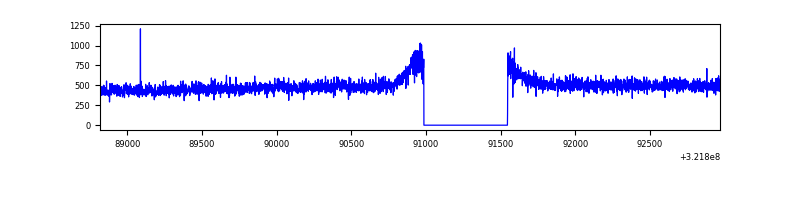 |
| D | 4150 | 3590 | 220 | 220 | 5.30% | 6.13% | 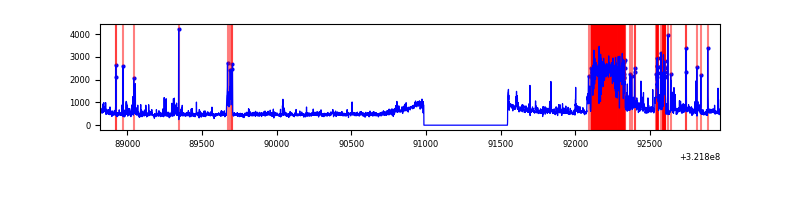 |
Top three noisy pixels from each quadrant. If the there are fewer than three noisy pixels in the level2.evt file, extra rows are filled as -1
| Pixel properties | Quadrant properties | ||||||
|---|---|---|---|---|---|---|---|
| Quadrant | DetID | PixID | Counts | Sigma | Mean | Median | Sigma |
| A | 13 | 254 | 5644 | 56.1 | 457 | 447 | 92.6 |
| A | 3 | 137 | 4285 | 41.43 | 457 | 447 | 92.6 |
| A | 0 | 226 | 4069 | 39.1 | 457 | 447 | 92.6 |
| B | 12 | 111 | 10738 | 115.77 | 452 | 441 | 88.9 |
| B | 11 | 111 | 9368 | 100.37 | 452 | 441 | 88.9 |
| B | 14 | 111 | 8472 | 90.3 | 452 | 441 | 88.9 |
| C | 14 | 238 | 68137 | 659.85 | 432 | 433 | 102.6 |
| C | 7 | 247 | 21091 | 201.34 | 432 | 433 | 102.6 |
| C | 13 | 61 | 3087 | 25.87 | 432 | 433 | 102.6 |
| D | 8 | 195 | 347096 | 3298.53 | 429 | 414 | 105.1 |
| D | 12 | 218 | 314180 | 2985.35 | 429 | 414 | 105.1 |
| D | 1 | 52 | 304325 | 2891.58 | 429 | 414 | 105.1 |
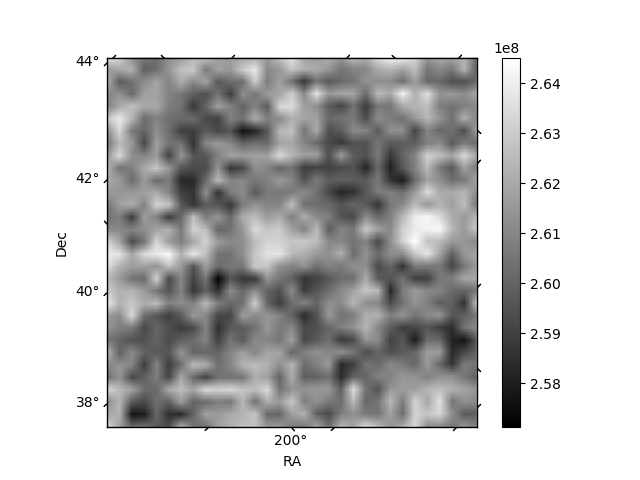
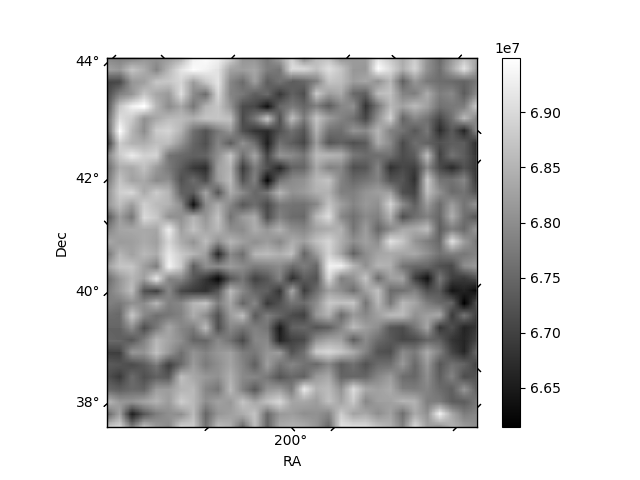
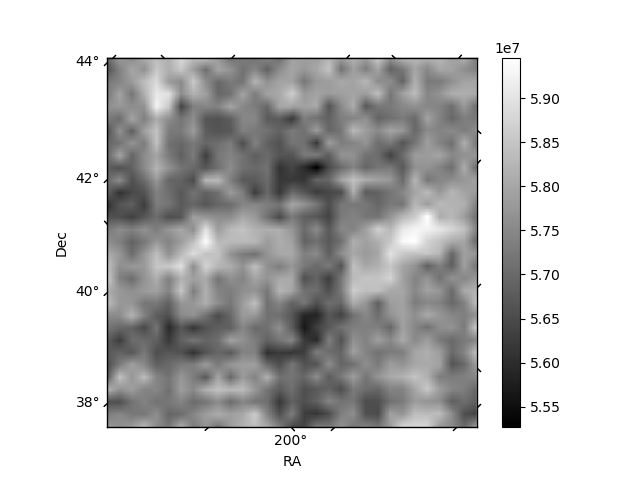
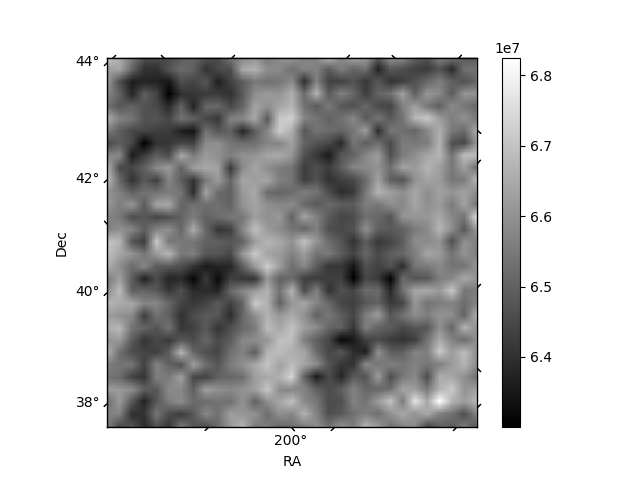
Histogram calculated using DETX and DETY for each event in the final _common_clean file
| Quadrant A | 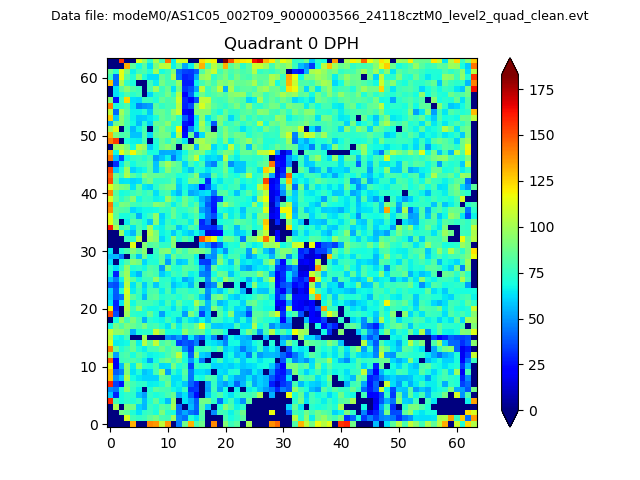 |
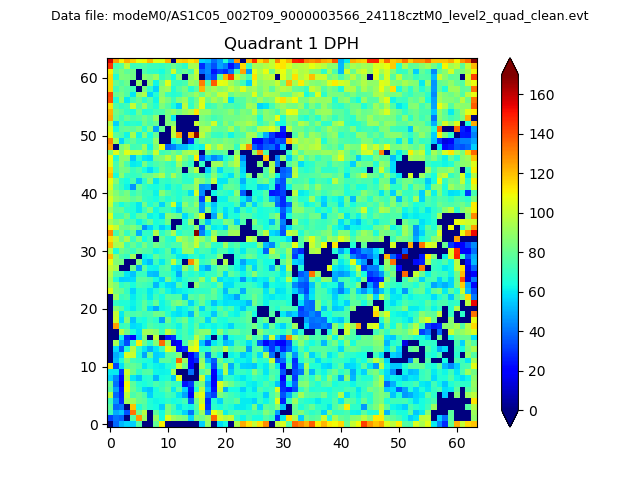 |
Quadrant B |
|---|---|---|---|
| Quadrant D | 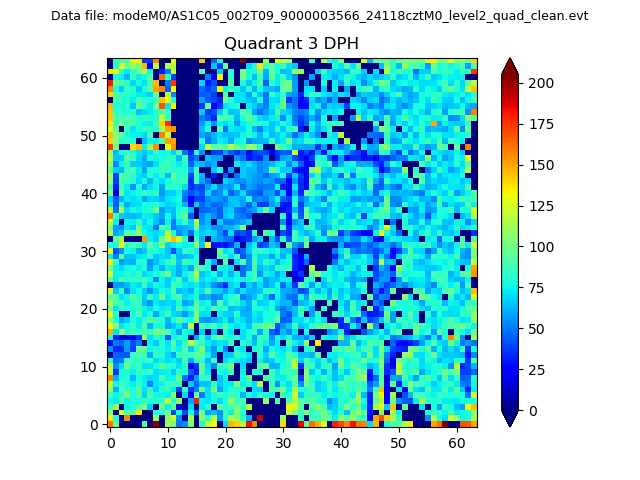 |
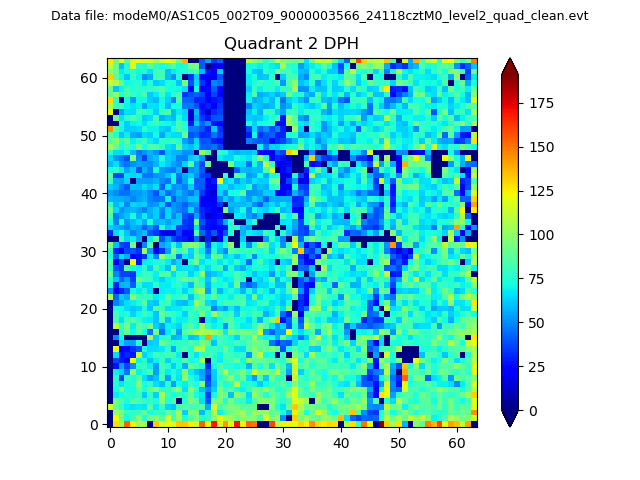 |
Quadrant C |
| Plot type | Count rate plots | Images |
|---|---|---|
| Comparison with Poisson distribution Blue bars denote a histogram of data divided into 1 sec bins. Red curve is a Poisson curve with rate = median count rate of data. |
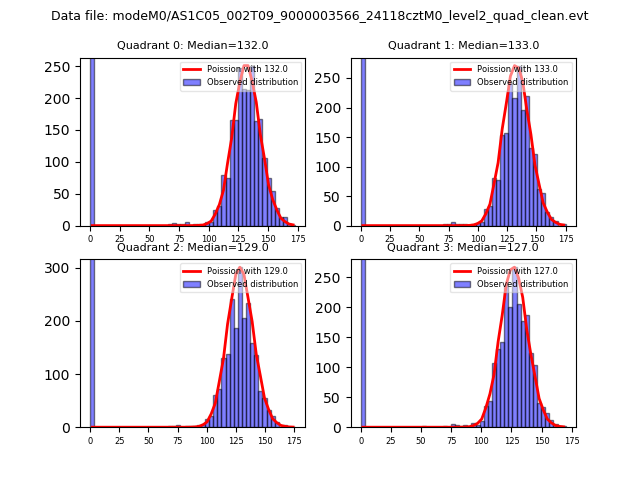 |
 |
| Quadrant-wise count rates Data is divided into 100 sec bins |
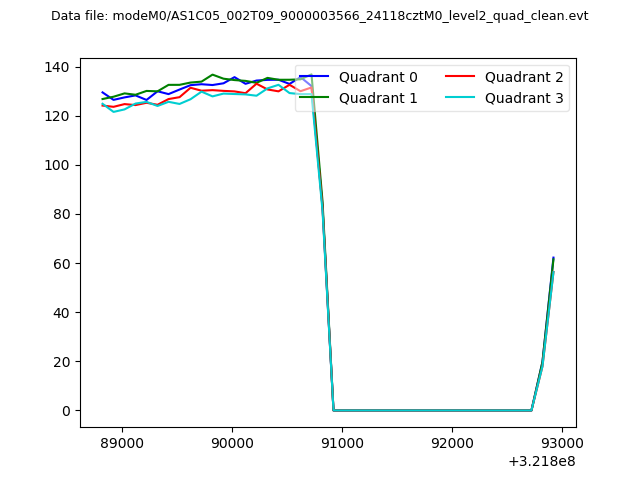 |
|
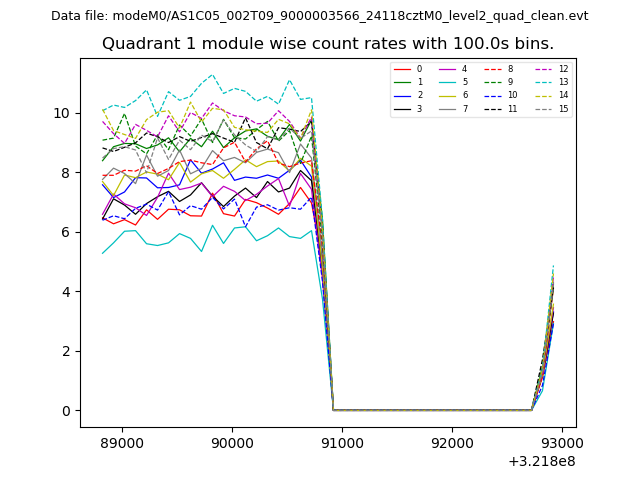
| Module-wise count rates for Quadrant A Data is divided into 100 sec bins |
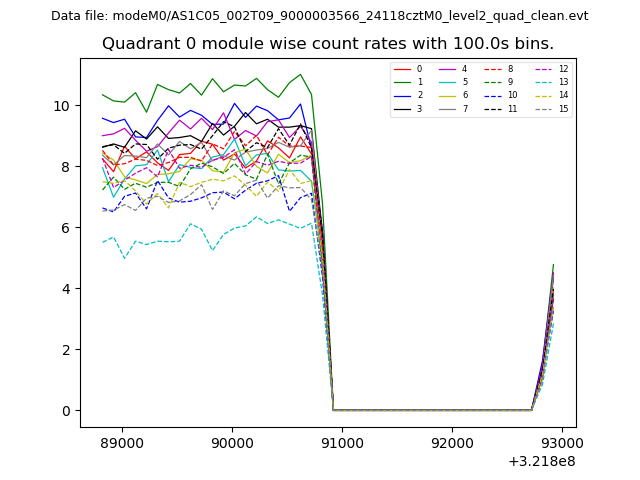 |
 |
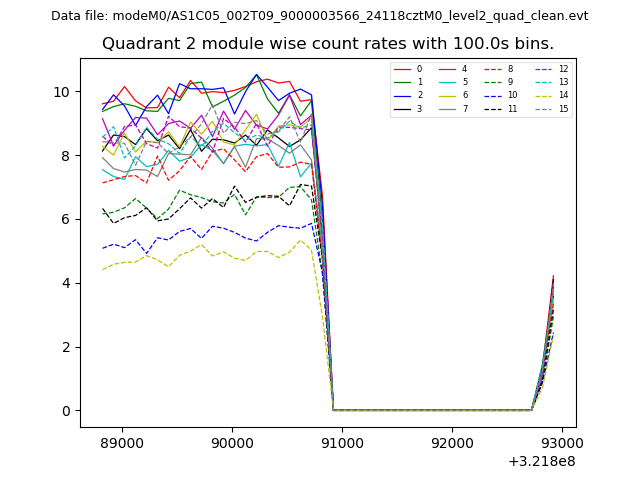
| Module-wise count rates for Quadrant B Data is divided into 100 sec bins |
 |
 |
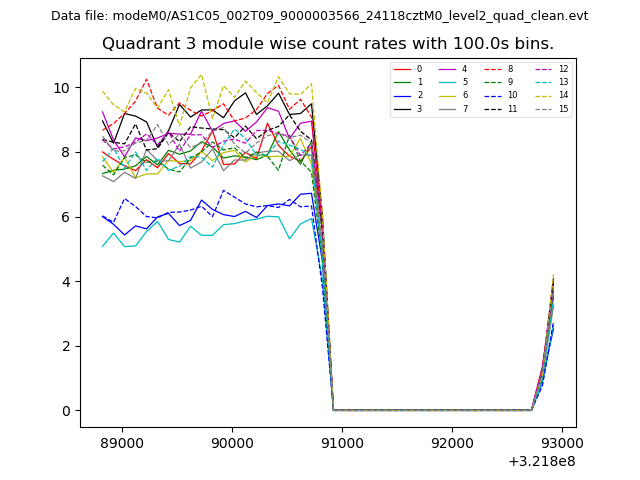
| Module-wise count rates for Quadrant C Data is divided into 100 sec bins |
 |
 |
| Module-wise count rates for Quadrant D Data is divided into 100 sec bins |
 |
 |
| Parameter | Plot |
|---|---|
| CZT HV Monitor | 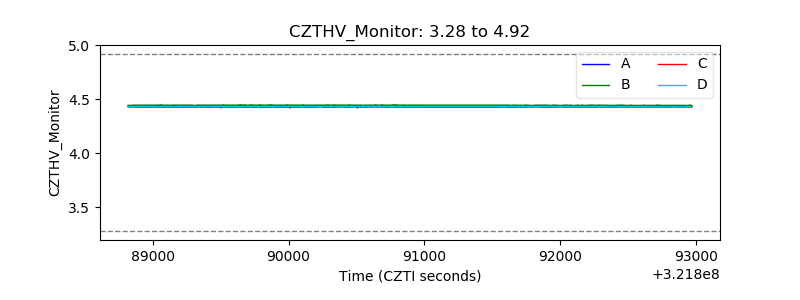 |
| D_VDD | 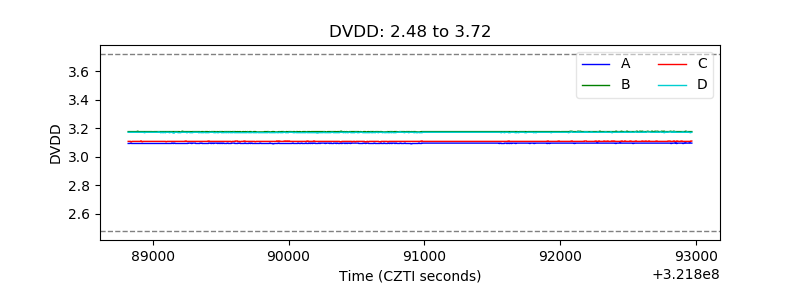 |
| Temperature 1 | 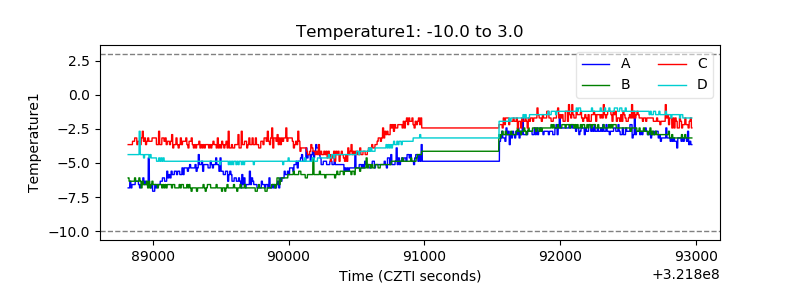 |
| Veto HV Monitor | 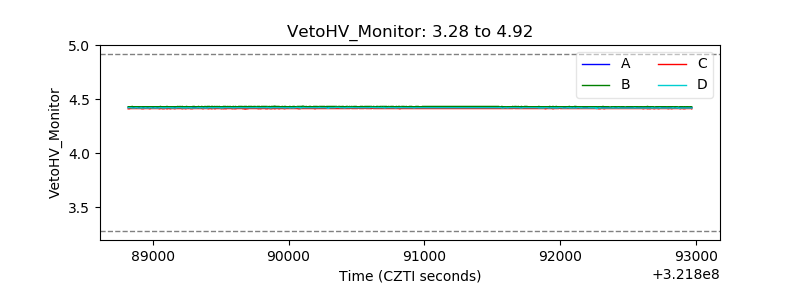 |
| Veto LLD | 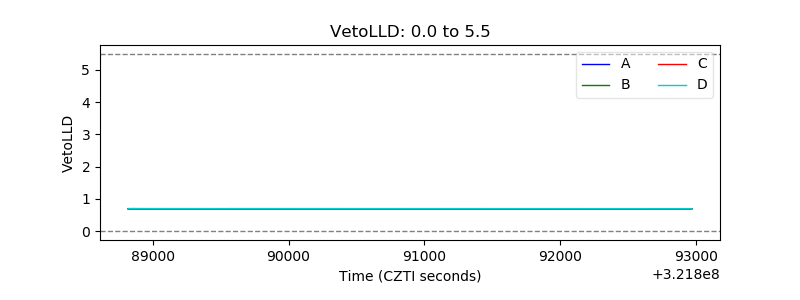 |
| Alpha Counter | 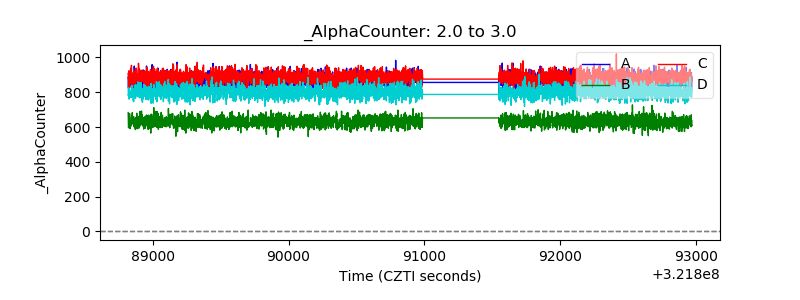 |
| _CPM_Rate | 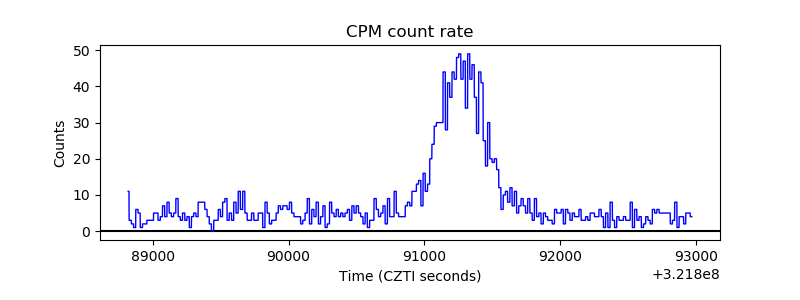 |
| CZT Counter | 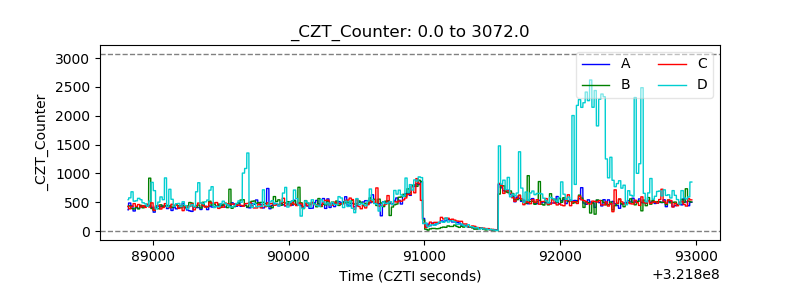 |
| +2.5 Volts monitor |  |
| +5 Volts monitor |  |
| _ROLL_ROT | 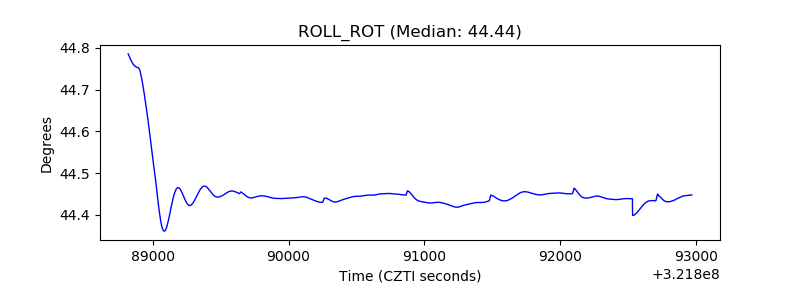 |
| _Roll_DEC |  |
| _Roll_RA | 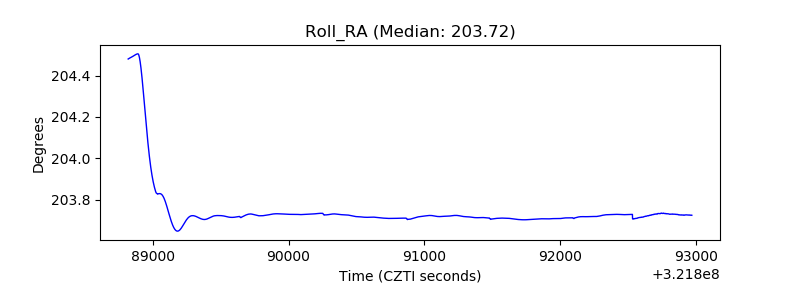 |
| Veto Counter | 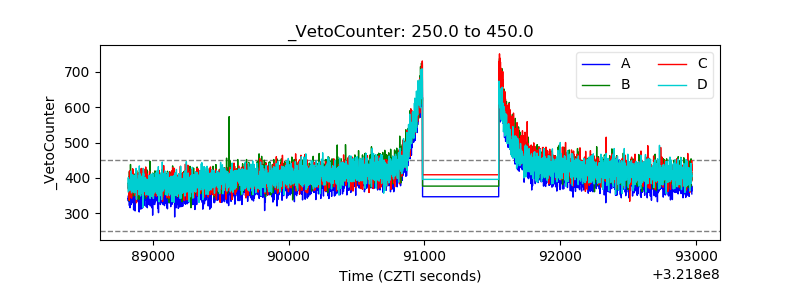 |