| Param | Original file | Final file |
|---|---|---|
| Filename | modeM0/AS1A07_047T08_9000003590_24282cztM0_level2.evt | modeM0/AS1A07_047T08_9000003590_24282cztM0_level2_quad_clean.evt |
| Size (bytes) | 230,685,120 | 55,152,000 |
| Size | 220.0 MB | 52.6 MB |
| Events in quadrant A | 1,401,469 | 374,450 |
| Events in quadrant B | 1,442,683 | 381,135 |
| Events in quadrant C | 2,152,431 | 357,949 |
| Events in quadrant D | 1,794,762 | 353,233 |
| Mode SS | |||
|---|---|---|---|
| Quadrant | BADHDUFLAG | Total packets | Discarded packets |
| A | 0 | 58 | 0 |
| B | 0 | 58 | 0 |
| C | 0 | 58 | 0 |
| D | 0 | 58 | 0 |
| Mode M9 | |||
|---|---|---|---|
| Quadrant | BADHDUFLAG | Total packets | Discarded packets |
| A | 0 | 7 | 0 |
| B | 0 | 7 | 0 |
| C | 0 | 7 | 0 |
| D | 0 | 7 | 0 |
| Mode M0 | |||
|---|---|---|---|
| Quadrant | BADHDUFLAG | Total packets | Discarded packets |
| A | 0 | 5829 | 1 |
| B | 0 | 5954 | 1 |
| C | 0 | 8574 | 1 |
| D | 0 | 7028 | 1 |
| Quadrant | Total seconds | Saturated seconds | Saturation percentage |
|---|---|---|---|
| A | 2848 | 33 | 1.158708% |
| B | 2848 | 39 | 1.369382% |
| C | 2848 | 78 | 2.738764% |
| D | 2848 | 83 | 2.914326% |
Noise dominated data is calculated using 1-second bins in cleaned event files. If a bin has >2000 counts, and if more than 50% of those come from <1% of pixels, then it is considered to be noise-dominated and hence unusable.
| Quadrant | # 1 sec bins | Bins with >0 counts | Bins with >2000 counts | High rate bins dominated by noise | Noise dominated (total time) | Noise dominated (detector-on time) | Marked lightcurve |
|---|---|---|---|---|---|---|---|
| A | 3588 | 2848 | 0 | 0 | 0.00% | 0.00% | 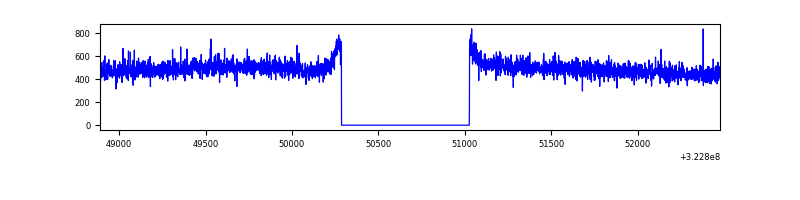 |
| B | 3588 | 2848 | 0 | 0 | 0.00% | 0.00% | 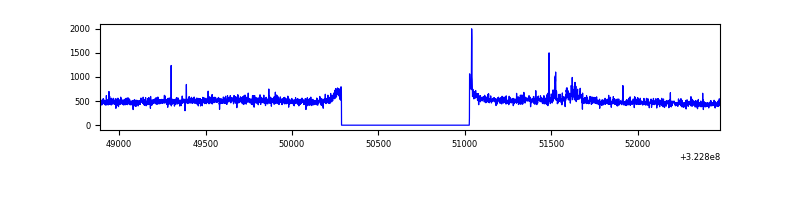 |
| C | 3588 | 2848 | 0 | 0 | 0.00% | 0.00% | 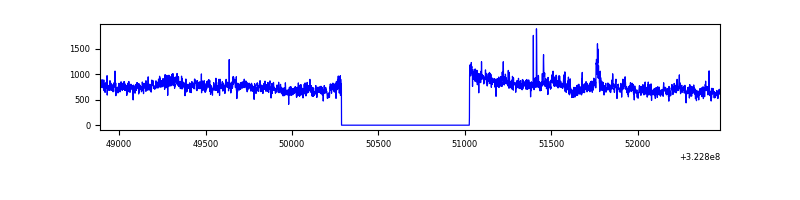 |
| D | 3588 | 2848 | 51 | 51 | 1.42% | 1.79% | 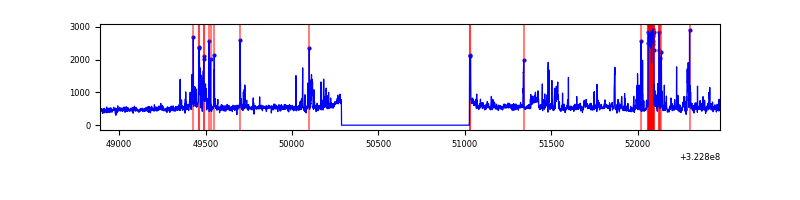 |
Top three noisy pixels from each quadrant. If the there are fewer than three noisy pixels in the level2.evt file, extra rows are filled as -1
| Pixel properties | Quadrant properties | ||||||
|---|---|---|---|---|---|---|---|
| Quadrant | DetID | PixID | Counts | Sigma | Mean | Median | Sigma |
| A | 13 | 254 | 4079 | 50.33 | 363 | 355 | 74.0 |
| A | 3 | 137 | 3344 | 40.4 | 363 | 355 | 74.0 |
| A | 0 | 226 | 3136 | 37.58 | 363 | 355 | 74.0 |
| B | 15 | 33 | 19462 | 272.73 | 359 | 350 | 70.1 |
| B | 12 | 111 | 8386 | 114.67 | 359 | 350 | 70.1 |
| B | 11 | 111 | 7501 | 102.04 | 359 | 350 | 70.1 |
| C | 7 | 247 | 706381 | 8630.99 | 345 | 347 | 81.8 |
| C | 14 | 238 | 54786 | 665.5 | 345 | 347 | 81.8 |
| C | 2 | 16 | 36759 | 445.12 | 345 | 347 | 81.8 |
| D | 1 | 52 | 216819 | 2490.96 | 351 | 340 | 86.9 |
| D | 12 | 233 | 108509 | 1244.67 | 351 | 340 | 86.9 |
| D | 8 | 195 | 67568 | 773.57 | 351 | 340 | 86.9 |
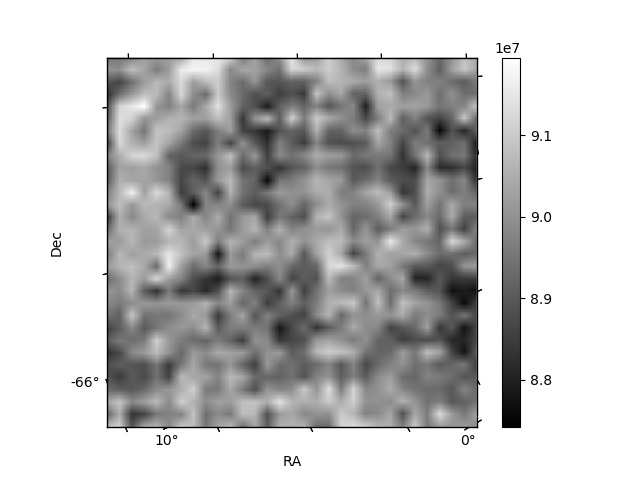
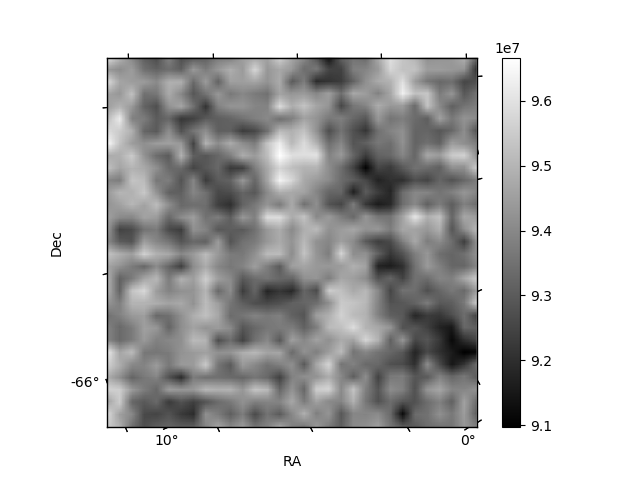
Histogram calculated using DETX and DETY for each event in the final _common_clean file
| Quadrant A |  |
 |
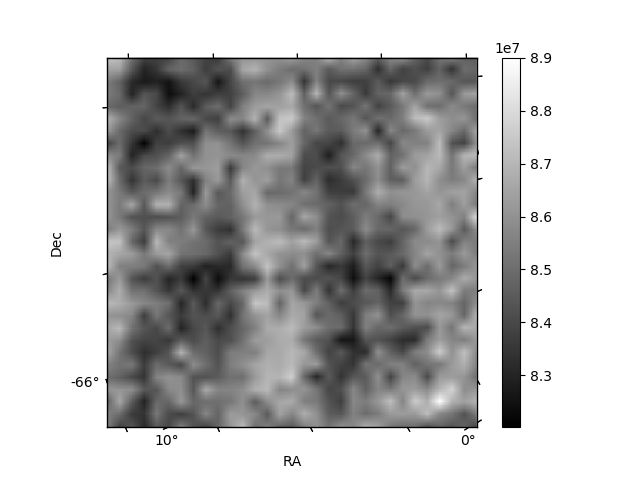
Quadrant B |
|---|---|---|---|
| Quadrant D |  |
 |
Quadrant C |
| Plot type | Count rate plots | Images |
|---|---|---|
| Comparison with Poisson distribution Blue bars denote a histogram of data divided into 1 sec bins. Red curve is a Poisson curve with rate = median count rate of data. |
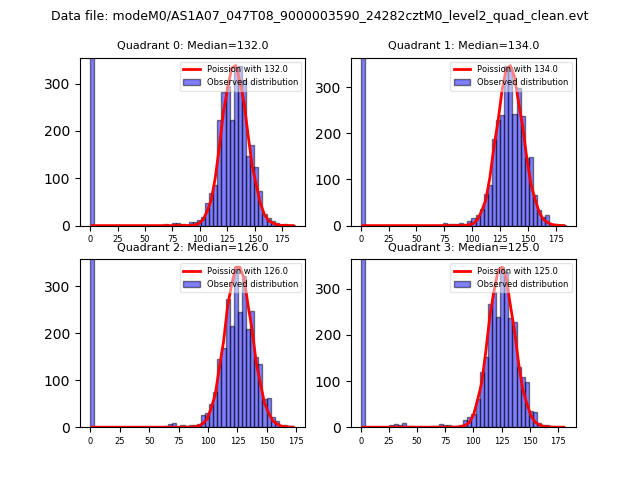 |
 |
| Quadrant-wise count rates Data is divided into 100 sec bins |
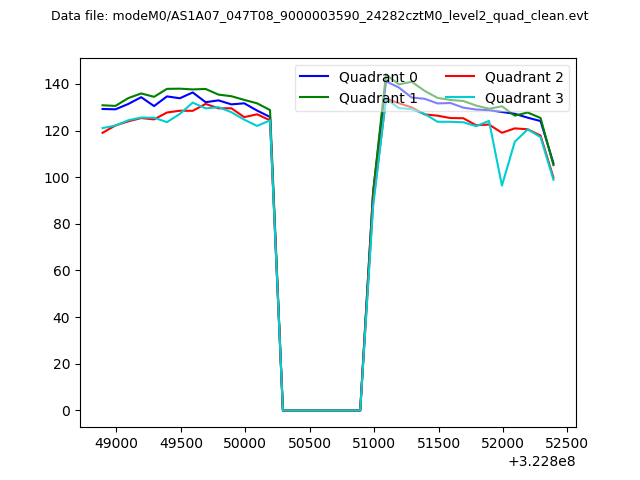 |
|
| Module-wise count rates for Quadrant A Data is divided into 100 sec bins |
 |
 |
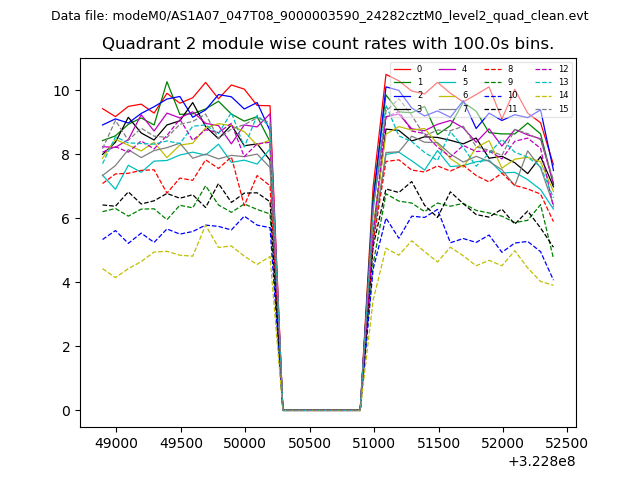
| Module-wise count rates for Quadrant B Data is divided into 100 sec bins |
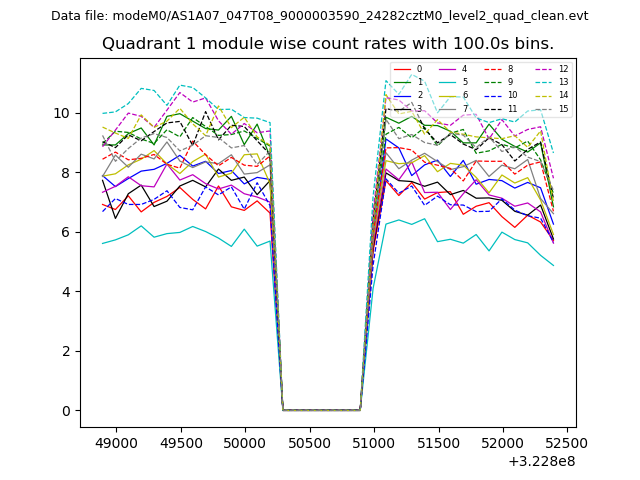 |
 |
| Module-wise count rates for Quadrant C Data is divided into 100 sec bins |
 |
 |
| Module-wise count rates for Quadrant D Data is divided into 100 sec bins |
 |
 |
| Parameter | Plot |
|---|---|
| CZT HV Monitor | 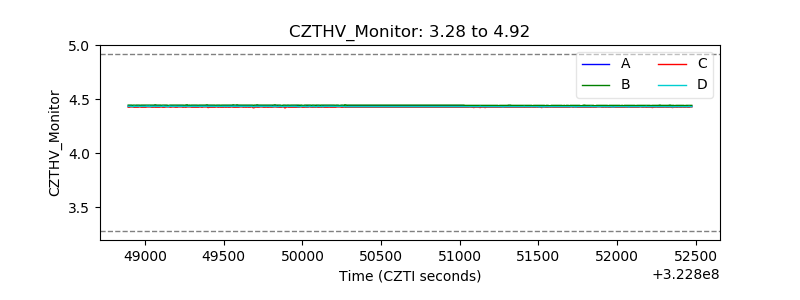 |
| D_VDD |  |
| Temperature 1 |  |
| Veto HV Monitor |  |
| Veto LLD |  |
| Alpha Counter | 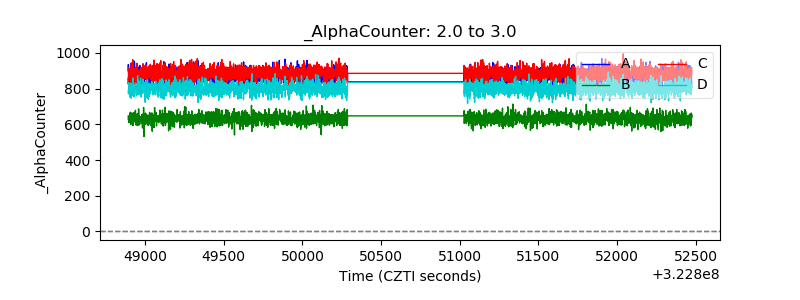 |
| _CPM_Rate | 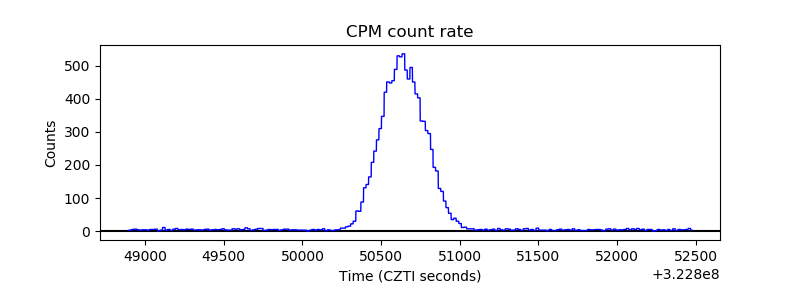 |
| CZT Counter |  |
| +2.5 Volts monitor |  |
| +5 Volts monitor |  |
| _ROLL_ROT |  |
| _Roll_DEC |  |
| _Roll_RA |  |
| Veto Counter |  |