| Param | Original file | Final file |
|---|---|---|
| Filename | modeM0/AS1A07_027T10_9000003592_24294cztM0_level2.evt | modeM0/AS1A07_027T10_9000003592_24294cztM0_level2_quad_clean.evt |
| Size (bytes) | 706,360,320 | 89,893,440 |
| Size | 673.6 MB | 85.7 MB |
| Events in quadrant A | 3,830,176 | 555,728 |
| Events in quadrant B | 3,875,423 | 566,643 |
| Events in quadrant C | 4,552,972 | 540,105 |
| Events in quadrant D | 8,603,152 | 514,434 |
| Mode SS | |||
|---|---|---|---|
| Quadrant | BADHDUFLAG | Total packets | Discarded packets |
| A | 0 | 162 | 0 |
| B | 0 | 162 | 0 |
| C | 0 | 162 | 0 |
| D | 0 | 162 | 0 |
| Mode M9 | |||
|---|---|---|---|
| Quadrant | BADHDUFLAG | Total packets | Discarded packets |
| A | 0 | 4 | 0 |
| B | 0 | 5 | 0 |
| C | 0 | 5 | 0 |
| D | 0 | 5 | 0 |
| Mode M0 | |||
|---|---|---|---|
| Quadrant | BADHDUFLAG | Total packets | Discarded packets |
| A | 0 | 16304 | 2 |
| B | 0 | 16349 | 2 |
| C | 0 | 18348 | 2 |
| D | 0 | 30958 | 2 |
| Quadrant | Total seconds | Saturated seconds | Saturation percentage |
|---|---|---|---|
| A | 7851 | 322 | 4.101388% |
| B | 7851 | 333 | 4.241498% |
| C | 7851 | 399 | 5.082155% |
| D | 7851 | 972 | 12.380588% |
Noise dominated data is calculated using 1-second bins in cleaned event files. If a bin has >2000 counts, and if more than 50% of those come from <1% of pixels, then it is considered to be noise-dominated and hence unusable.
| Quadrant | # 1 sec bins | Bins with >0 counts | Bins with >2000 counts | High rate bins dominated by noise | Noise dominated (total time) | Noise dominated (detector-on time) | Marked lightcurve |
|---|---|---|---|---|---|---|---|
| A | 8106 | 7851 | 0 | 0 | 0.00% | 0.00% | 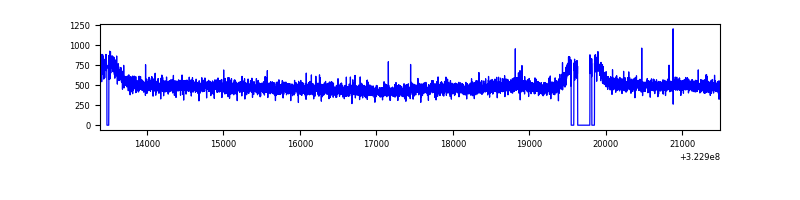 |
| B | 8106 | 7851 | 1 | 1 | 0.01% | 0.01% | 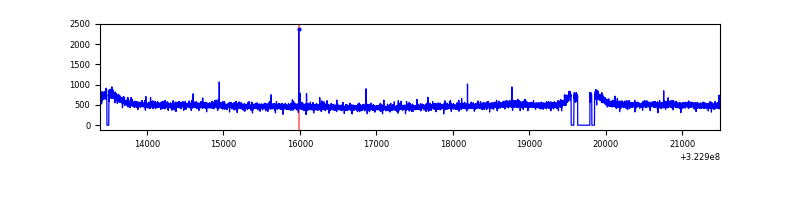 |
| C | 8106 | 7852 | 0 | 0 | 0.00% | 0.00% | 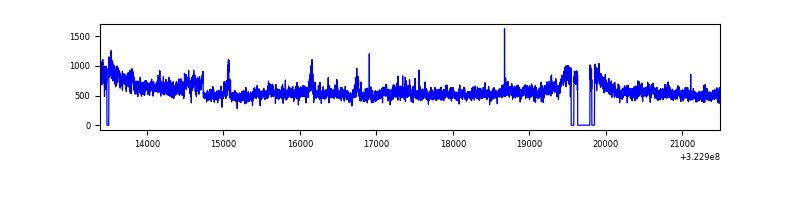 |
| D | 8106 | 7851 | 587 | 587 | 7.24% | 7.48% | 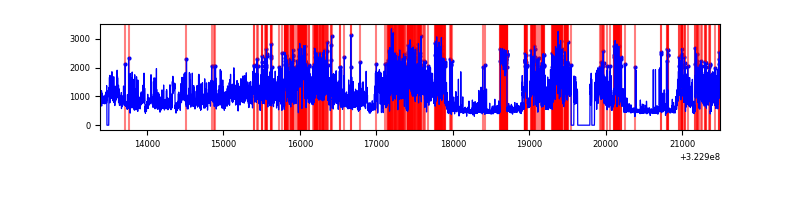 |
Top three noisy pixels from each quadrant. If the there are fewer than three noisy pixels in the level2.evt file, extra rows are filled as -1
| Pixel properties | Quadrant properties | ||||||
|---|---|---|---|---|---|---|---|
| Quadrant | DetID | PixID | Counts | Sigma | Mean | Median | Sigma |
| A | 13 | 254 | 11552 | 52.21 | 993 | 971 | 202.6 |
| A | 3 | 137 | 9277 | 40.99 | 993 | 971 | 202.6 |
| A | 0 | 226 | 8565 | 37.47 | 993 | 971 | 202.6 |
| B | 12 | 111 | 23946 | 118.98 | 985 | 957 | 193.2 |
| B | 11 | 111 | 21617 | 106.93 | 985 | 957 | 193.2 |
| B | 14 | 111 | 18841 | 92.56 | 985 | 957 | 193.2 |
| C | 7 | 247 | 678008 | 3055.67 | 945 | 948 | 221.6 |
| C | 14 | 238 | 149434 | 670.14 | 945 | 948 | 221.6 |
| C | 2 | 16 | 17317 | 73.88 | 945 | 948 | 221.6 |
| D | 1 | 52 | 4208791 | 18263.68 | 937 | 909 | 230.4 |
| D | 8 | 195 | 525553 | 2277.14 | 937 | 909 | 230.4 |
| D | 12 | 233 | 176998 | 764.29 | 937 | 909 | 230.4 |
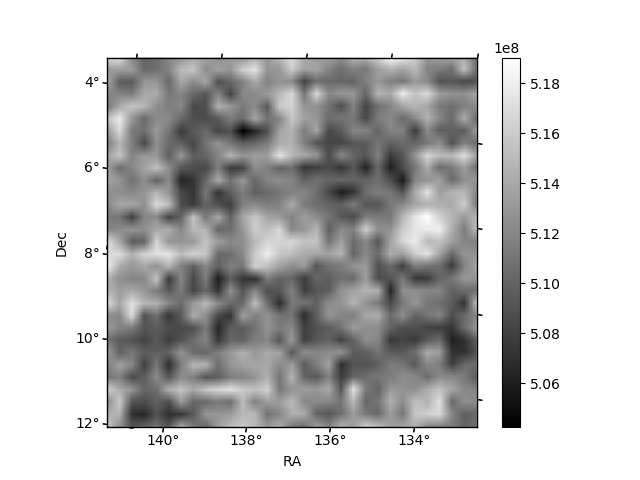
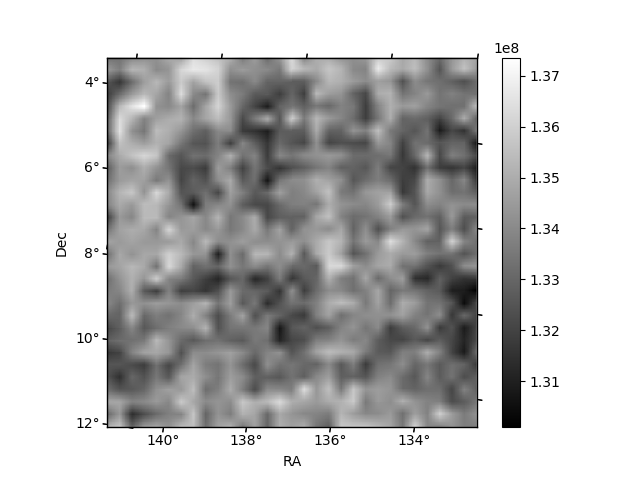
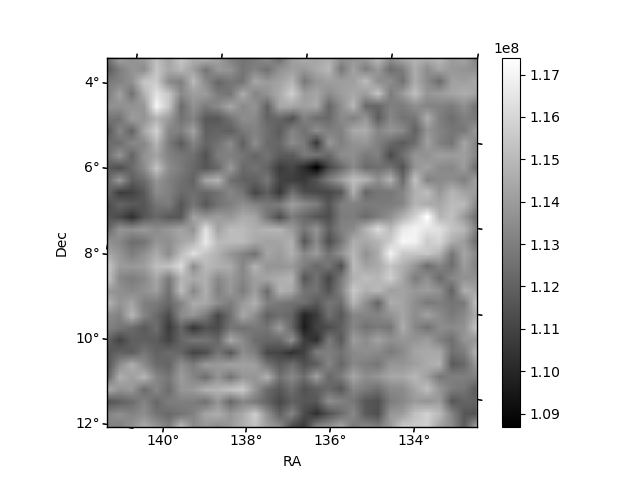
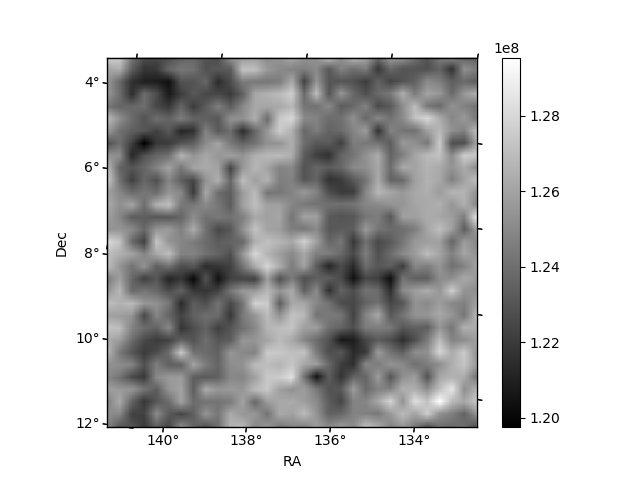
Histogram calculated using DETX and DETY for each event in the final _common_clean file
| Quadrant A | 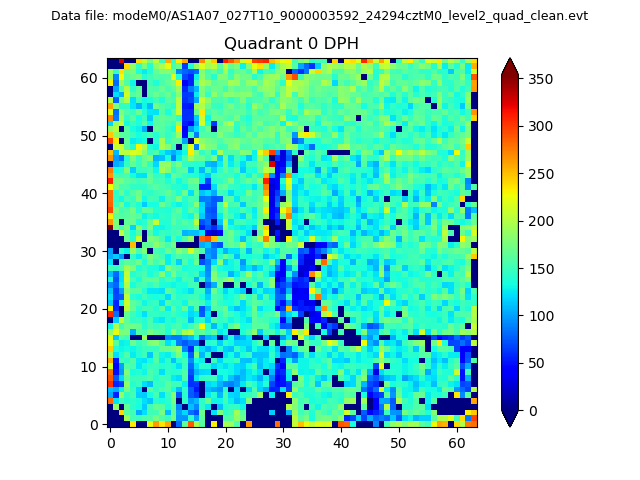 |
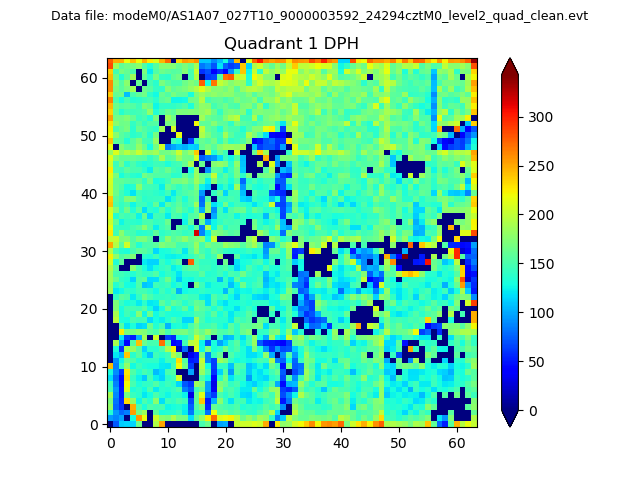 |
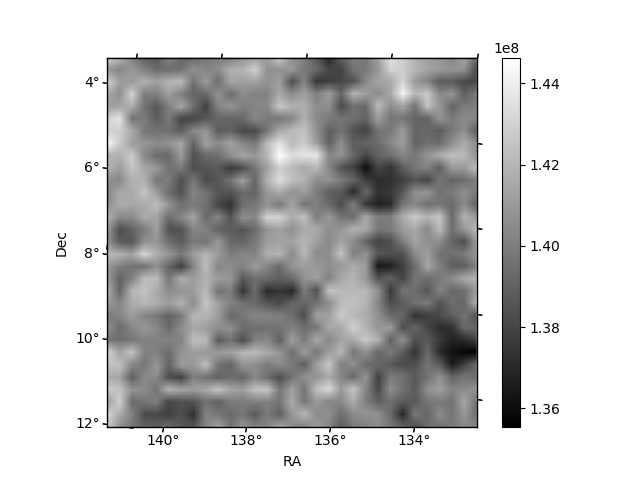
Quadrant B |
|---|---|---|---|
| Quadrant D | 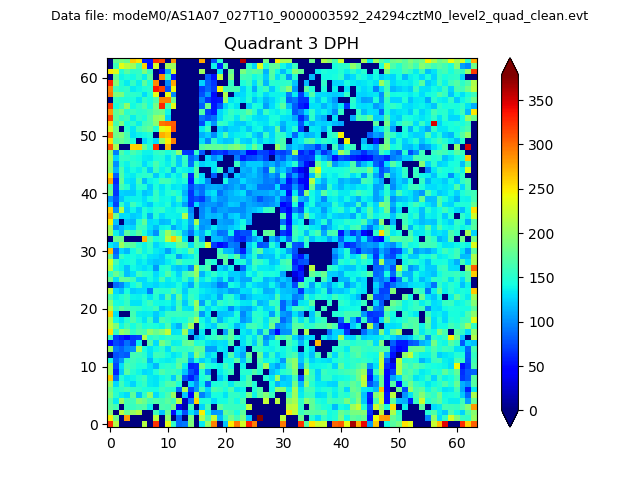 |
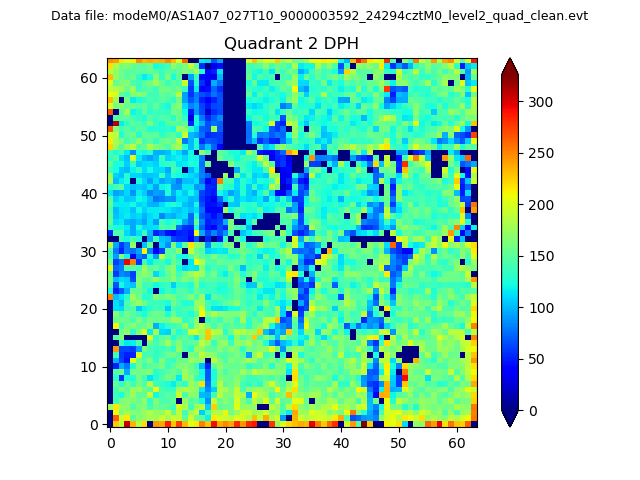 |
Quadrant C |
| Plot type | Count rate plots | Images |
|---|---|---|
| Comparison with Poisson distribution Blue bars denote a histogram of data divided into 1 sec bins. Red curve is a Poisson curve with rate = median count rate of data. |
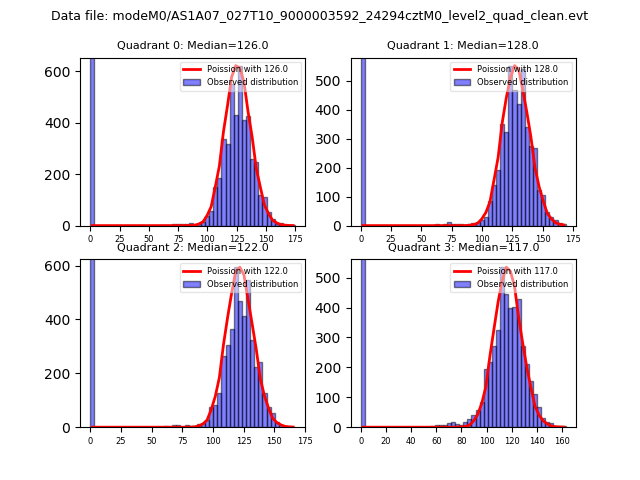 |
 |
| Quadrant-wise count rates Data is divided into 100 sec bins |
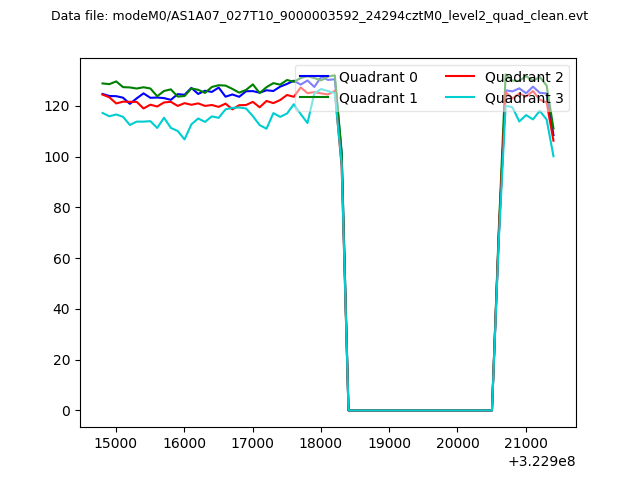 |
|
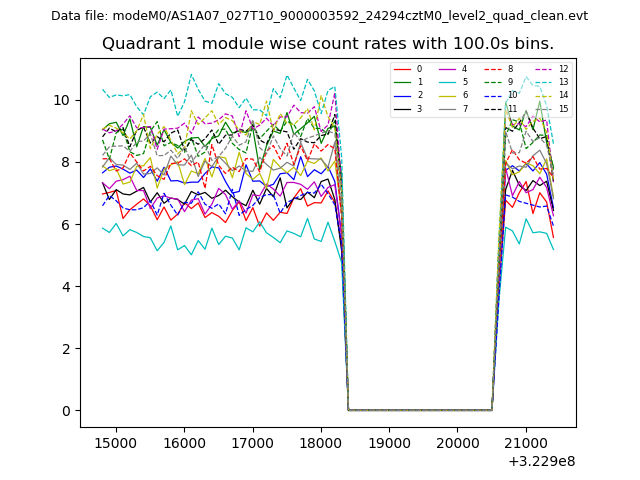
| Module-wise count rates for Quadrant A Data is divided into 100 sec bins |
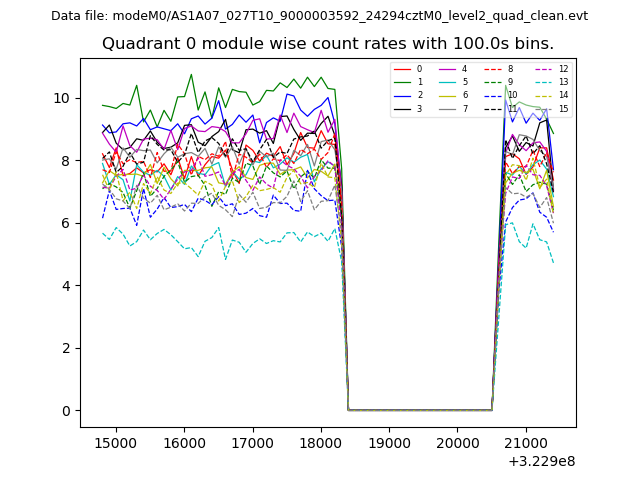 |
 |
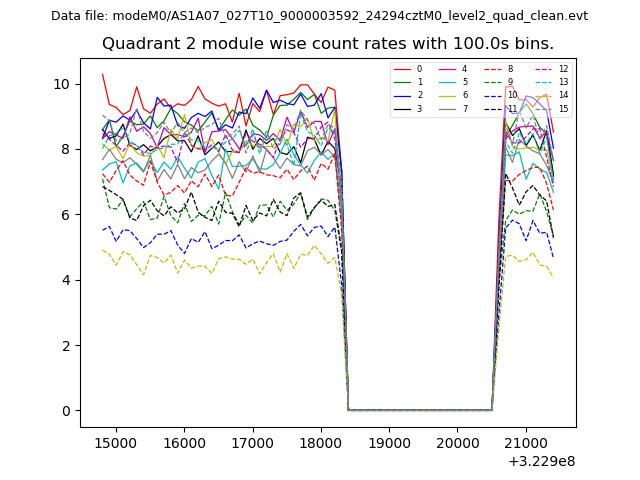
| Module-wise count rates for Quadrant B Data is divided into 100 sec bins |
 |
 |
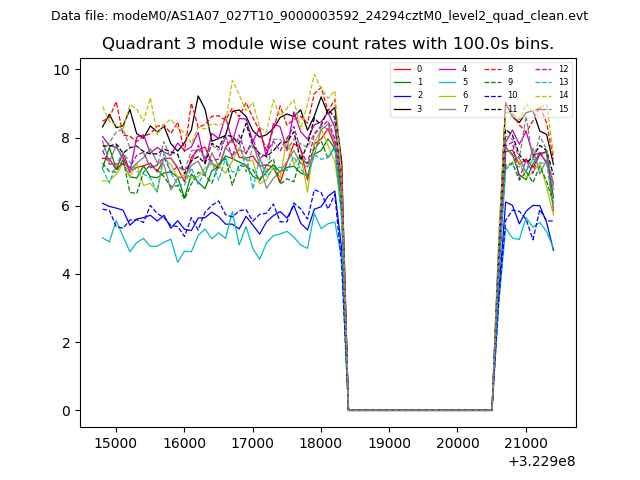
| Module-wise count rates for Quadrant C Data is divided into 100 sec bins |
 |
 |
| Module-wise count rates for Quadrant D Data is divided into 100 sec bins |
 |
 |
| Parameter | Plot |
|---|---|
| CZT HV Monitor | 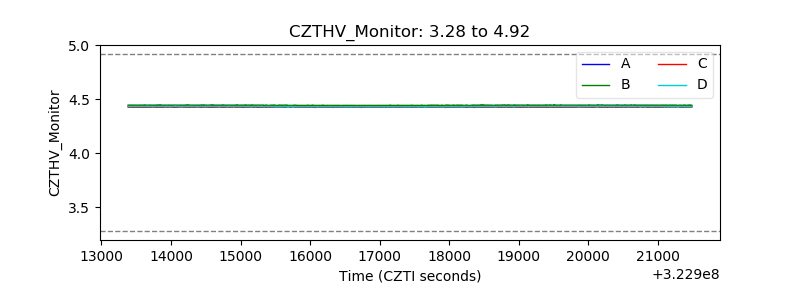 |
| D_VDD | 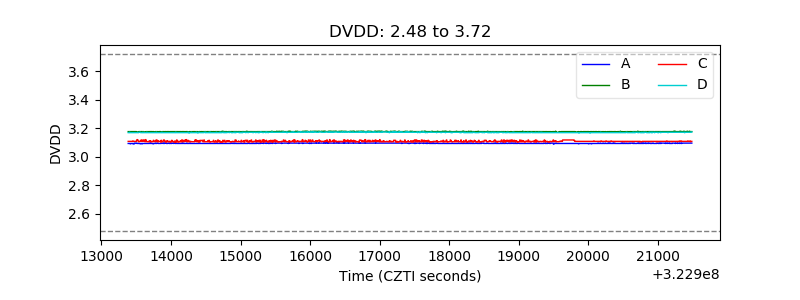 |
| Temperature 1 | 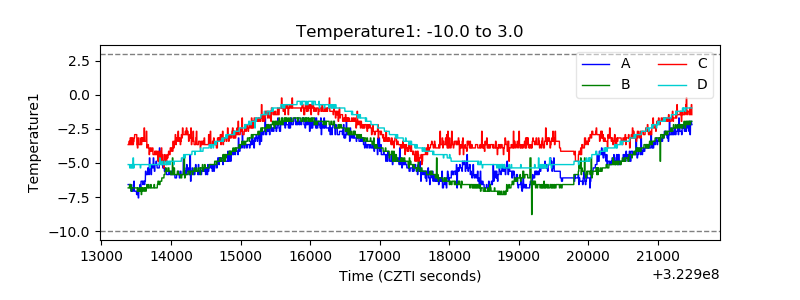 |
| Veto HV Monitor | 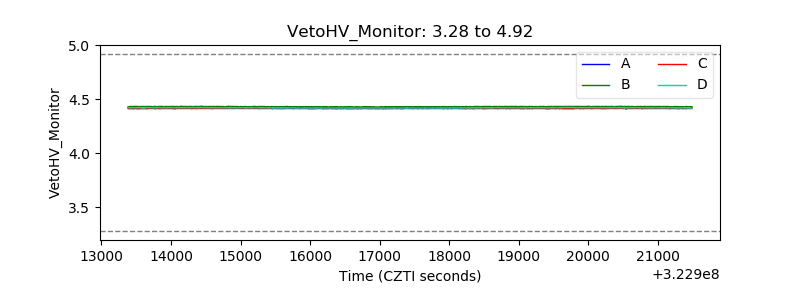 |
| Veto LLD | 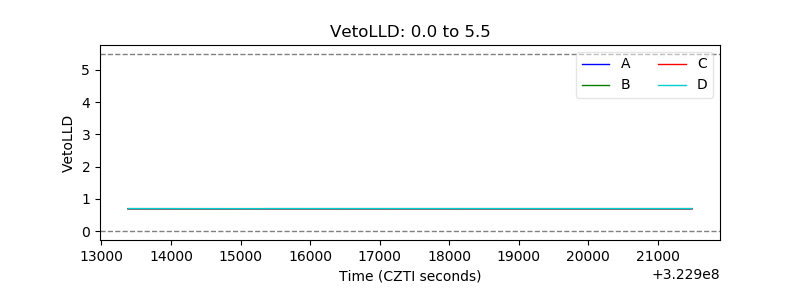 |
| Alpha Counter | 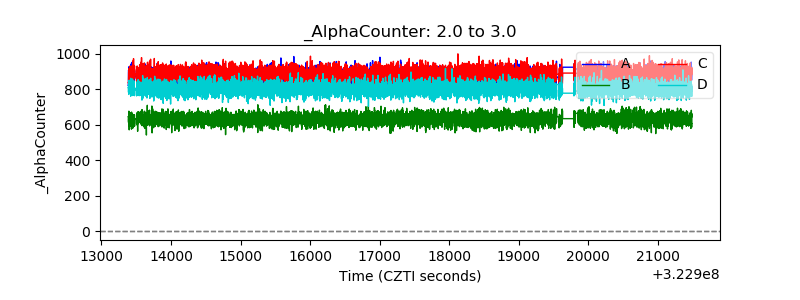 |
| _CPM_Rate | 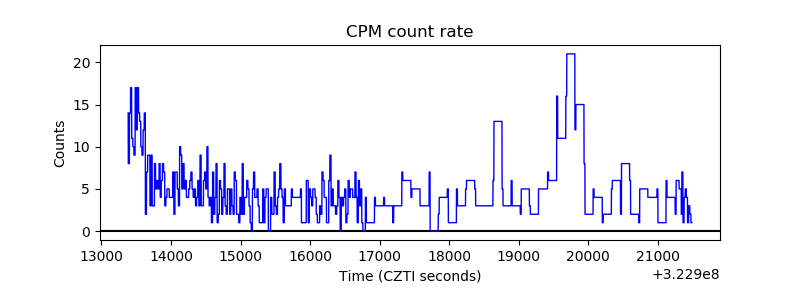 |
| CZT Counter | 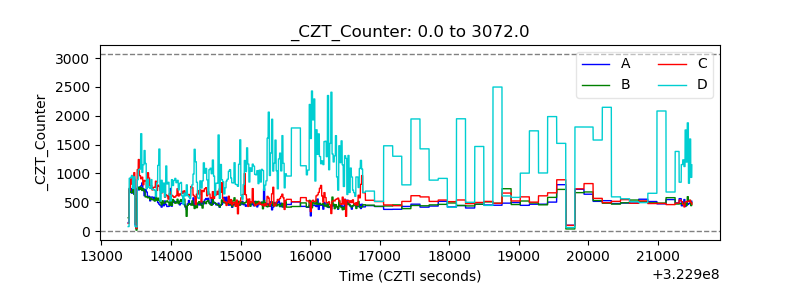 |
| +2.5 Volts monitor |  |
| +5 Volts monitor |  |
| _ROLL_ROT | 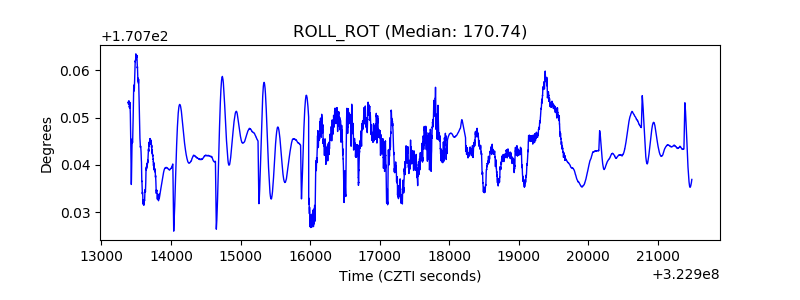 |
| _Roll_DEC | 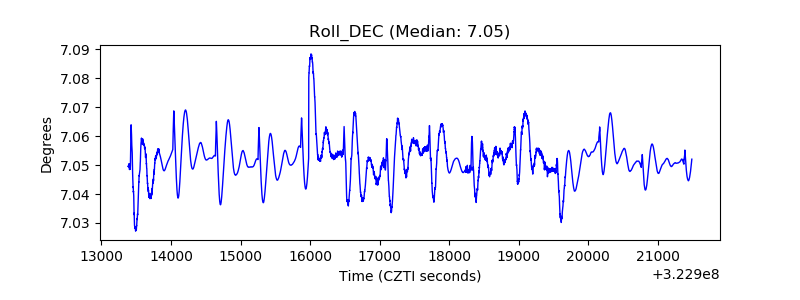 |
| _Roll_RA | 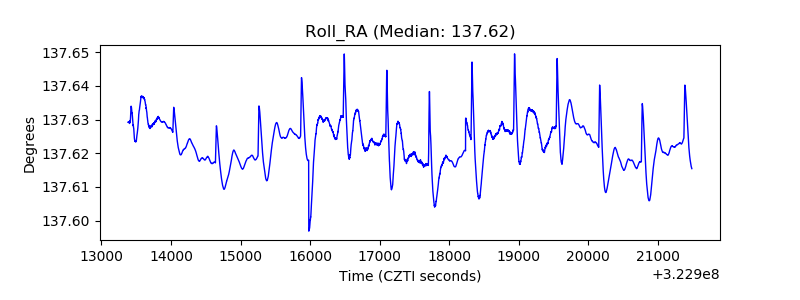 |
| Veto Counter | 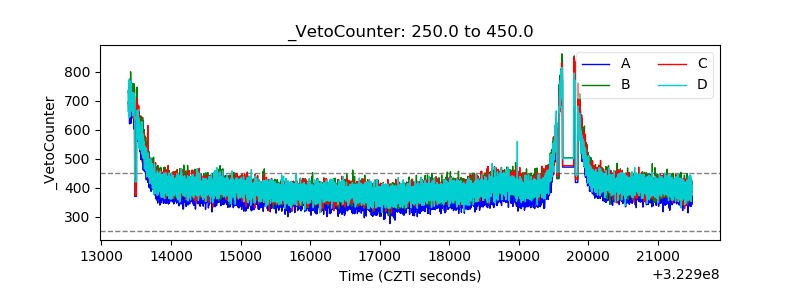 |