| Param | Original file | Final file |
|---|---|---|
| Filename | modeM0/AS1A07_001T03_9000003602_24412cztM0_level2.evt | modeM0/AS1A07_001T03_9000003602_24412cztM0_level2_quad_clean.evt |
| Size (bytes) | 628,447,680 | 151,686,720 |
| Size | 599.3 MB | 144.7 MB |
| Events in quadrant A | 4,161,738 | 1,005,668 |
| Events in quadrant B | 4,253,650 | 1,015,508 |
| Events in quadrant C | 4,180,000 | 980,275 |
| Events in quadrant D | 5,806,538 | 947,916 |
| Mode SS | |||
|---|---|---|---|
| Quadrant | BADHDUFLAG | Total packets | Discarded packets |
| A | 0 | 186 | 0 |
| B | 0 | 186 | 0 |
| C | 0 | 186 | 0 |
| D | 0 | 186 | 0 |
| Mode M9 | |||
|---|---|---|---|
| Quadrant | BADHDUFLAG | Total packets | Discarded packets |
| A | 0 | 6 | 0 |
| B | 0 | 6 | 0 |
| C | 0 | 6 | 0 |
| D | 0 | 6 | 0 |
| Mode M0 | |||
|---|---|---|---|
| Quadrant | BADHDUFLAG | Total packets | Discarded packets |
| A | 0 | 18767 | 1 |
| B | 0 | 18898 | 1 |
| C | 0 | 18787 | 1 |
| D | 0 | 23376 | 1 |
| Quadrant | Total seconds | Saturated seconds | Saturation percentage |
|---|---|---|---|
| A | 9304 | 64 | 0.687876% |
| B | 9305 | 73 | 0.784524% |
| C | 9305 | 99 | 1.063944% |
| D | 9305 | 228 | 2.450296% |
Noise dominated data is calculated using 1-second bins in cleaned event files. If a bin has >2000 counts, and if more than 50% of those come from <1% of pixels, then it is considered to be noise-dominated and hence unusable.
| Quadrant | # 1 sec bins | Bins with >0 counts | Bins with >2000 counts | High rate bins dominated by noise | Noise dominated (total time) | Noise dominated (detector-on time) | Marked lightcurve |
|---|---|---|---|---|---|---|---|
| A | 9829 | 9305 | 0 | 0 | 0.00% | 0.00% |  |
| B | 9830 | 9306 | 3 | 3 | 0.03% | 0.03% |  |
| C | 9830 | 9306 | 0 | 0 | 0.00% | 0.00% | 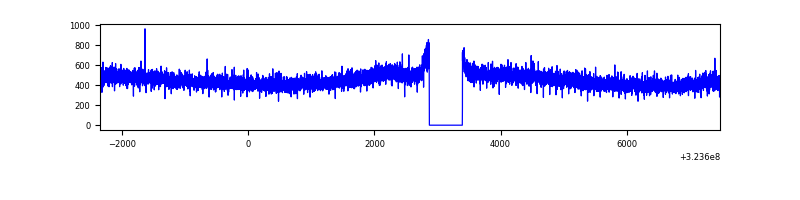 |
| D | 9830 | 9306 | 167 | 167 | 1.70% | 1.79% | 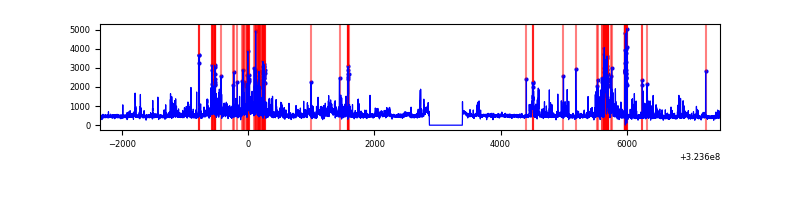 |
Top three noisy pixels from each quadrant. If the there are fewer than three noisy pixels in the level2.evt file, extra rows are filled as -1
| Pixel properties | Quadrant properties | ||||||
|---|---|---|---|---|---|---|---|
| Quadrant | DetID | PixID | Counts | Sigma | Mean | Median | Sigma |
| A | 13 | 254 | 15874 | 68.37 | 1077 | 1053 | 216.8 |
| A | 0 | 226 | 9643 | 39.62 | 1077 | 1053 | 216.8 |
| A | 3 | 137 | 9595 | 39.4 | 1077 | 1053 | 216.8 |
| B | 0 | 190 | 33100 | 156.12 | 1067 | 1037 | 205.4 |
| B | 12 | 111 | 25046 | 116.9 | 1067 | 1037 | 205.4 |
| B | 11 | 111 | 22223 | 103.16 | 1067 | 1037 | 205.4 |
| C | 14 | 238 | 163465 | 678.76 | 1026 | 1029 | 239.3 |
| C | 7 | 247 | 15724 | 61.4 | 1026 | 1029 | 239.3 |
| C | 13 | 61 | 7081 | 25.29 | 1026 | 1029 | 239.3 |
| D | 1 | 52 | 1467854 | 5777.78 | 1036 | 1004 | 253.9 |
| D | 8 | 195 | 332312 | 1304.99 | 1036 | 1004 | 253.9 |
| D | 2 | 234 | 51839 | 200.23 | 1036 | 1004 | 253.9 |
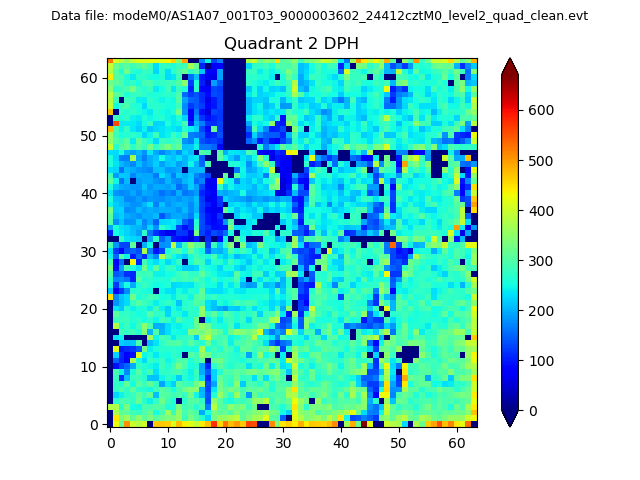
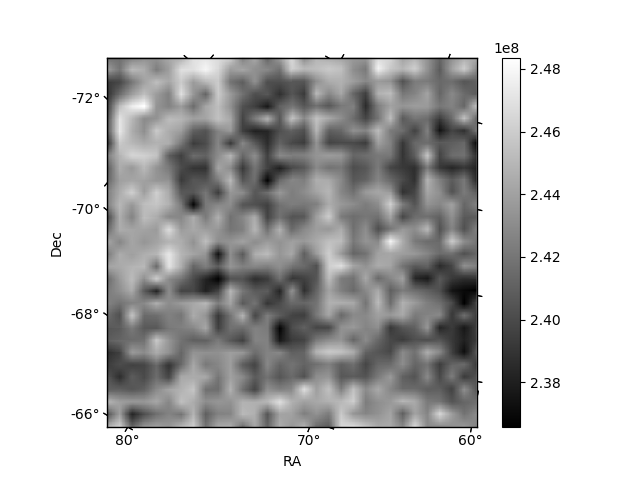
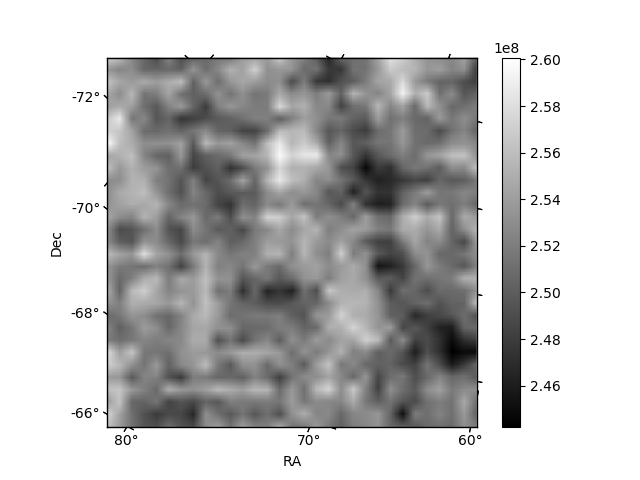
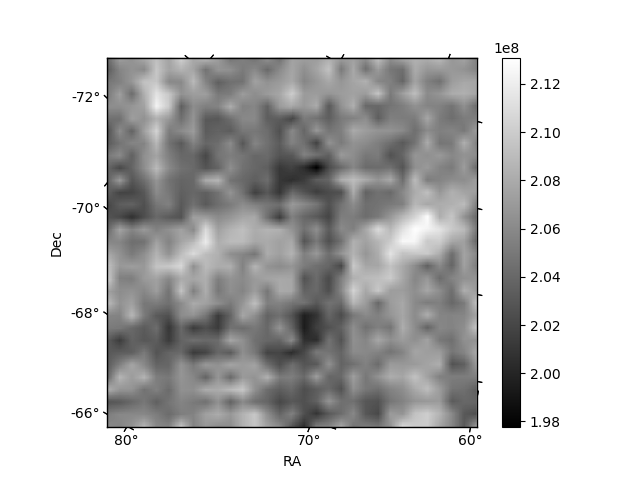
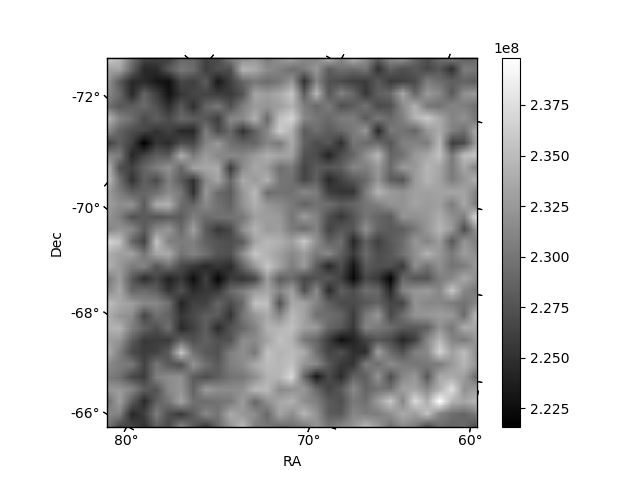
Histogram calculated using DETX and DETY for each event in the final _common_clean file
| Quadrant A | 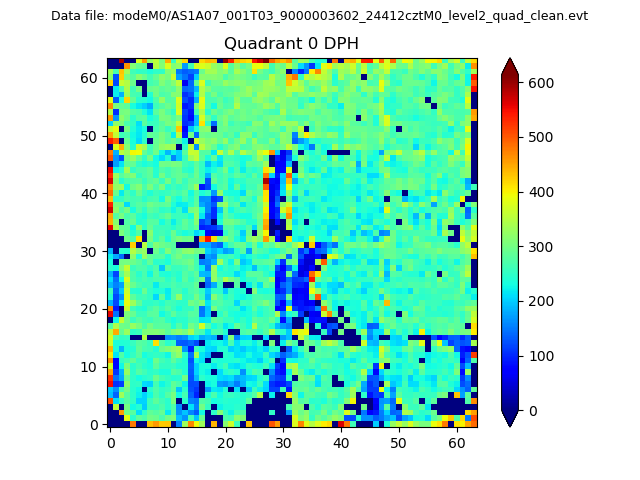 |
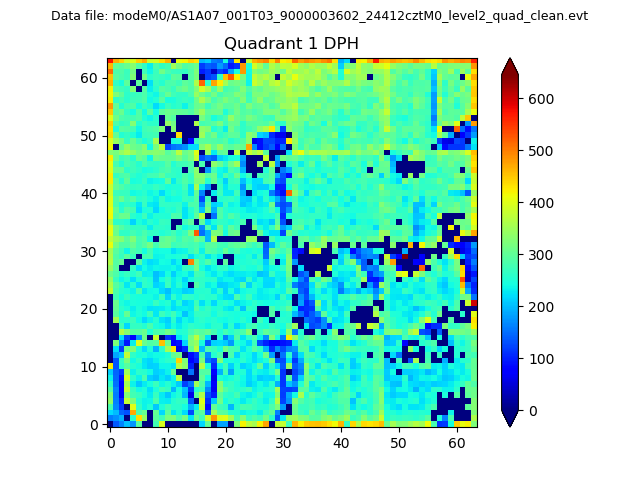 |
Quadrant B |
|---|---|---|---|
| Quadrant D | 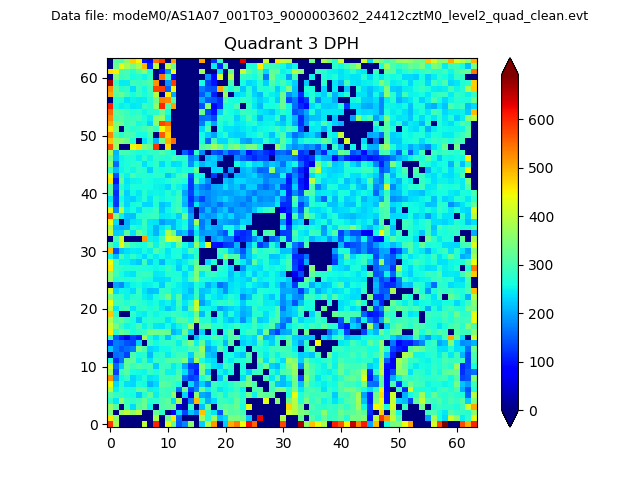 |
 |
Quadrant C |
| Plot type | Count rate plots | Images |
|---|---|---|
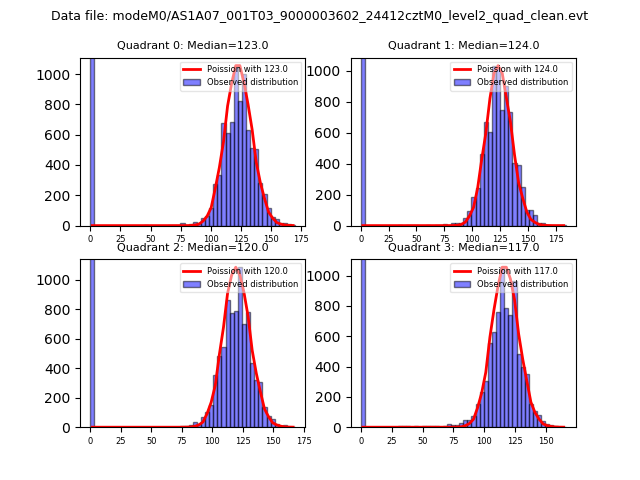
| Comparison with Poisson distribution Blue bars denote a histogram of data divided into 1 sec bins. Red curve is a Poisson curve with rate = median count rate of data. |
 |
 |
| Quadrant-wise count rates Data is divided into 100 sec bins |
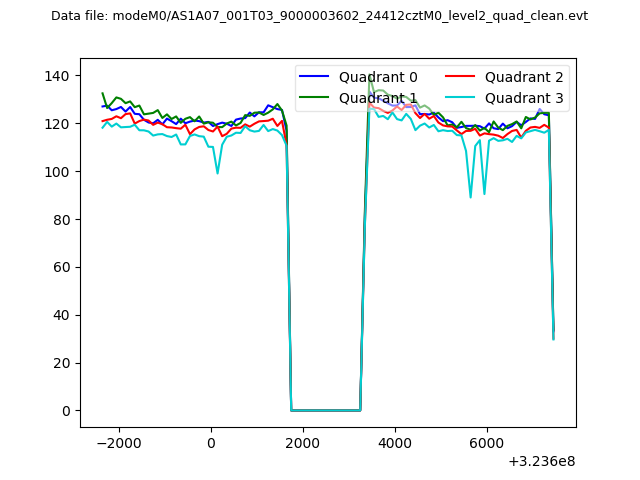 |
|
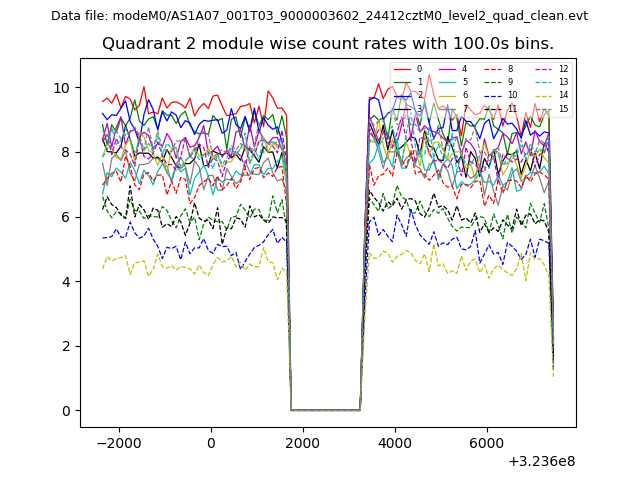
| Module-wise count rates for Quadrant A Data is divided into 100 sec bins |
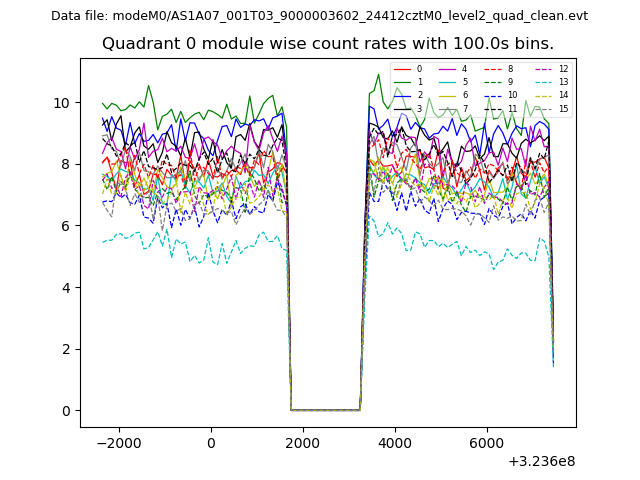 |
 |
| Module-wise count rates for Quadrant B Data is divided into 100 sec bins |
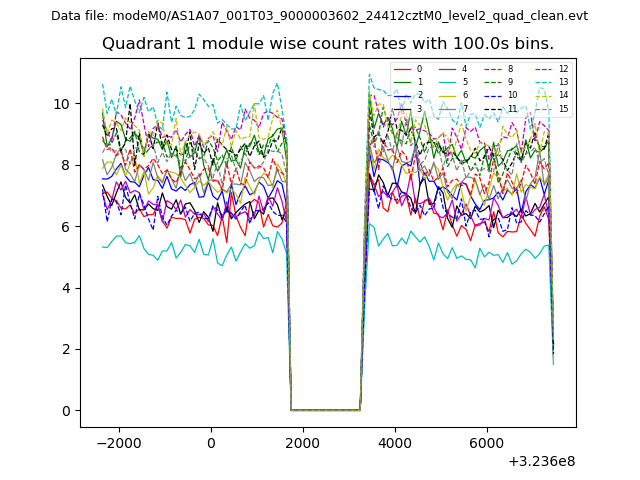 |
 |
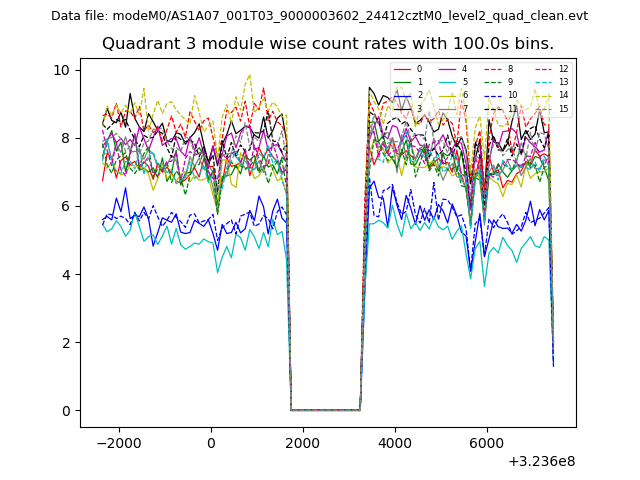
| Module-wise count rates for Quadrant C Data is divided into 100 sec bins |
 |
 |
| Module-wise count rates for Quadrant D Data is divided into 100 sec bins |
 |
 |
| Parameter | Plot |
|---|---|
| CZT HV Monitor | 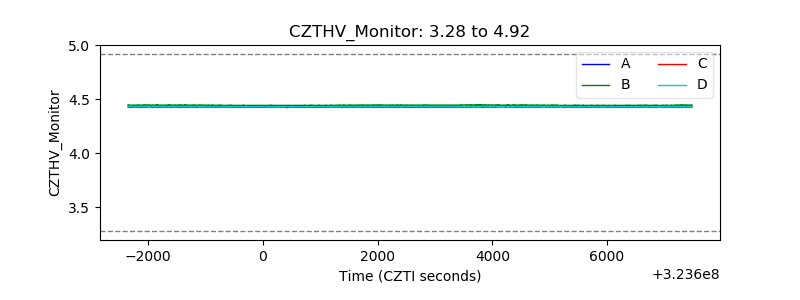 |
| D_VDD |  |
| Temperature 1 | 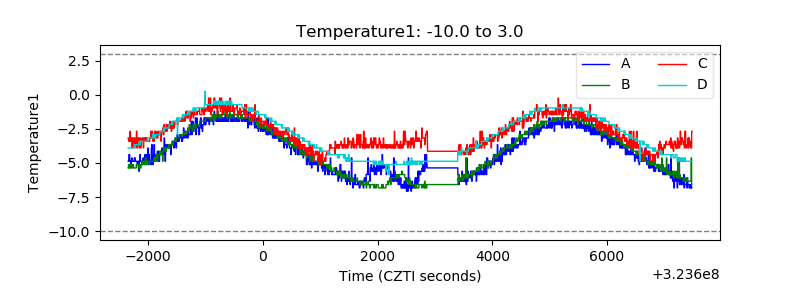 |
| Veto HV Monitor | 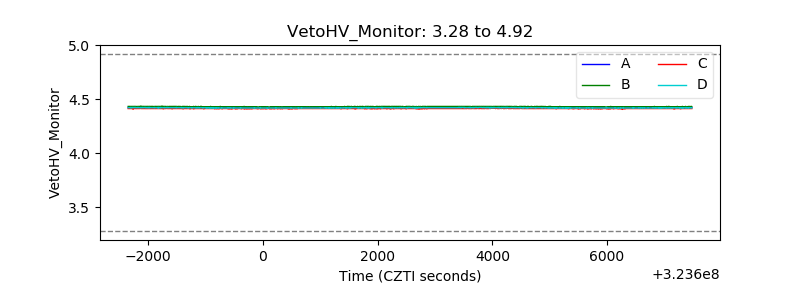 |
| Veto LLD | 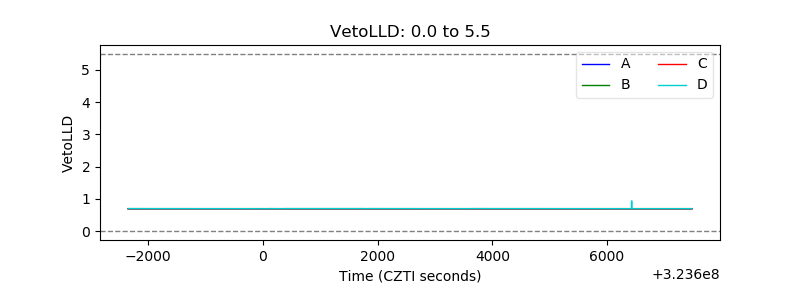 |
| Alpha Counter | 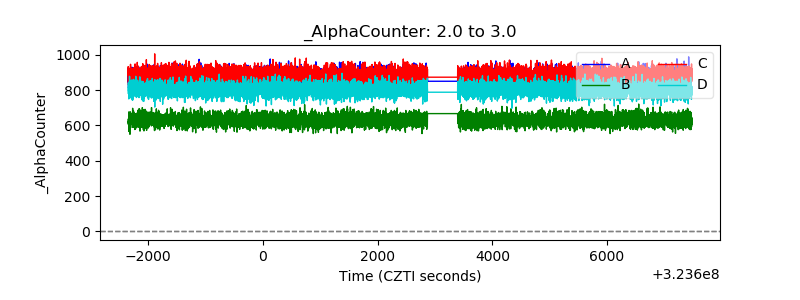 |
| _CPM_Rate | 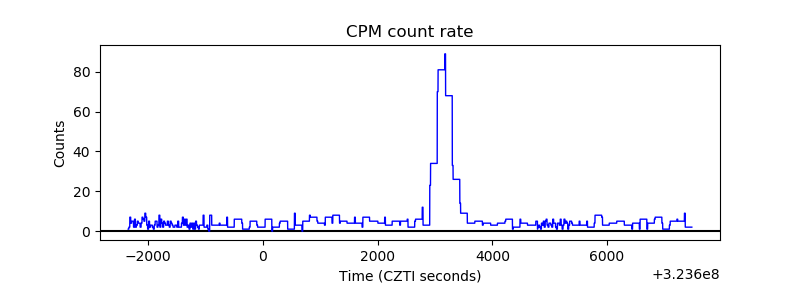 |
| CZT Counter | 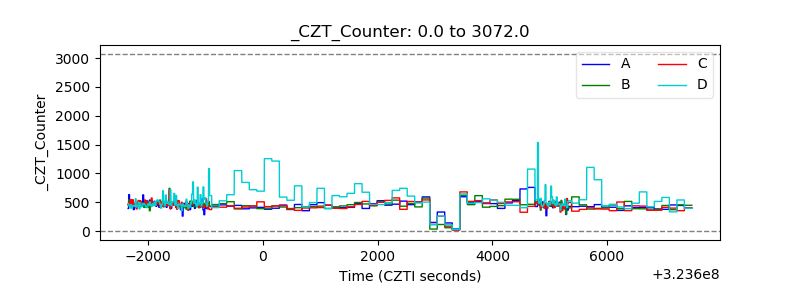 |
| +2.5 Volts monitor | 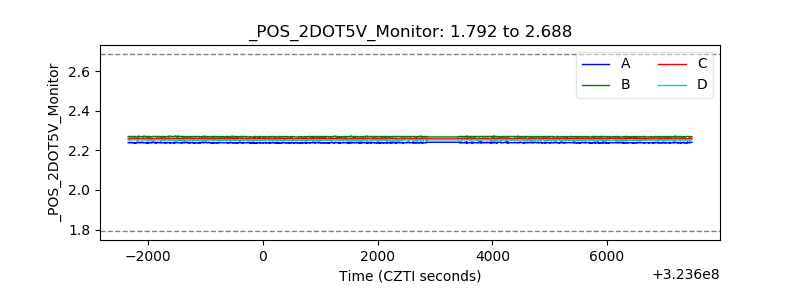 |
| +5 Volts monitor |  |
| _ROLL_ROT | 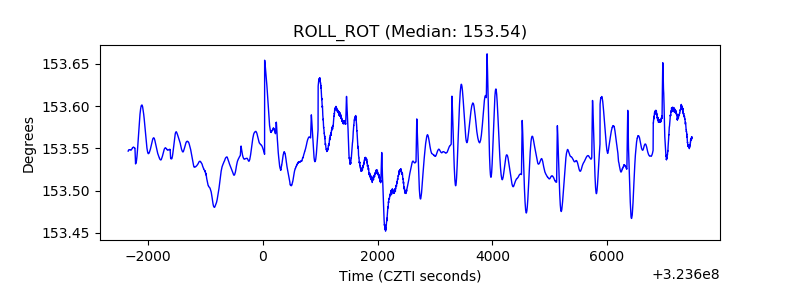 |
| _Roll_DEC | 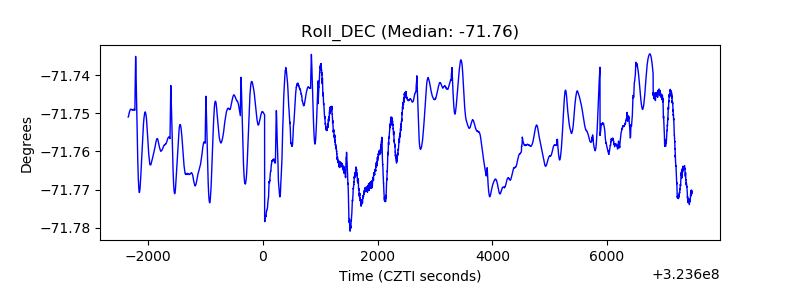 |
| _Roll_RA | 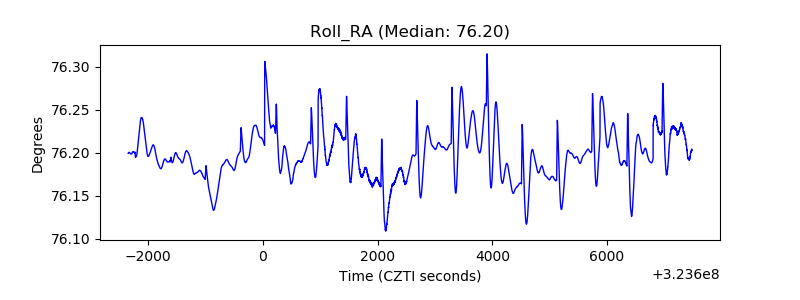 |
| Veto Counter | 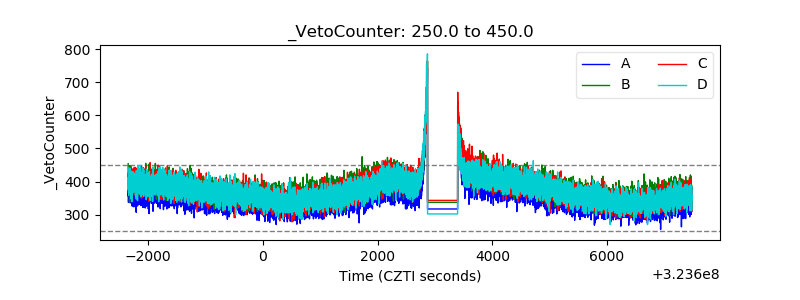 |