| Param | Original file | Final file |
|---|---|---|
| Filename | modeM0/AS1A07_001T03_9000003602_24413cztM0_level2.evt | modeM0/AS1A07_001T03_9000003602_24413cztM0_level2_quad_clean.evt |
| Size (bytes) | 345,551,040 | 77,785,920 |
| Size | 329.5 MB | 74.2 MB |
| Events in quadrant A | 2,365,386 | 507,014 |
| Events in quadrant B | 2,427,557 | 512,770 |
| Events in quadrant C | 2,377,240 | 492,611 |
| Events in quadrant D | 2,941,449 | 479,879 |
| Mode SS | |||
|---|---|---|---|
| Quadrant | BADHDUFLAG | Total packets | Discarded packets |
| A | 0 | 106 | 0 |
| B | 0 | 106 | 0 |
| C | 0 | 106 | 0 |
| D | 0 | 106 | 0 |
| Mode M9 | |||
|---|---|---|---|
| Quadrant | BADHDUFLAG | Total packets | Discarded packets |
| A | 0 | 7 | 0 |
| B | 0 | 7 | 0 |
| C | 0 | 7 | 0 |
| D | 0 | 7 | 0 |
| Mode M0 | |||
|---|---|---|---|
| Quadrant | BADHDUFLAG | Total packets | Discarded packets |
| A | 0 | 10479 | 1 |
| B | 0 | 10574 | 1 |
| C | 0 | 10522 | 1 |
| D | 0 | 12096 | 1 |
| Quadrant | Total seconds | Saturated seconds | Saturation percentage |
|---|---|---|---|
| A | 5183 | 38 | 0.733166% |
| B | 5183 | 46 | 0.887517% |
| C | 5183 | 71 | 1.369863% |
| D | 5183 | 70 | 1.350569% |
Noise dominated data is calculated using 1-second bins in cleaned event files. If a bin has >2000 counts, and if more than 50% of those come from <1% of pixels, then it is considered to be noise-dominated and hence unusable.
| Quadrant | # 1 sec bins | Bins with >0 counts | Bins with >2000 counts | High rate bins dominated by noise | Noise dominated (total time) | Noise dominated (detector-on time) | Marked lightcurve |
|---|---|---|---|---|---|---|---|
| A | 5903 | 5184 | 0 | 0 | 0.00% | 0.00% | 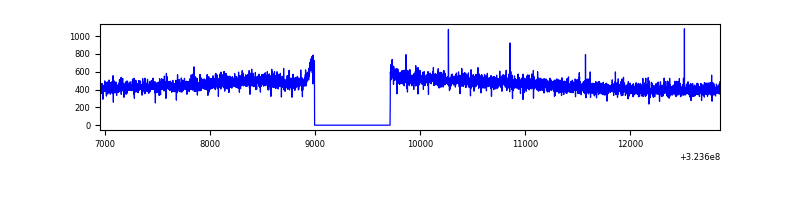 |
| B | 5903 | 5184 | 1 | 1 | 0.02% | 0.02% | 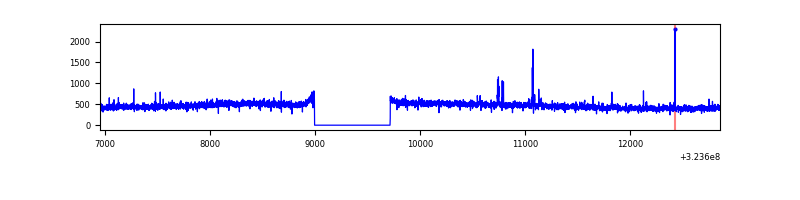 |
| C | 5903 | 5184 | 0 | 0 | 0.00% | 0.00% | 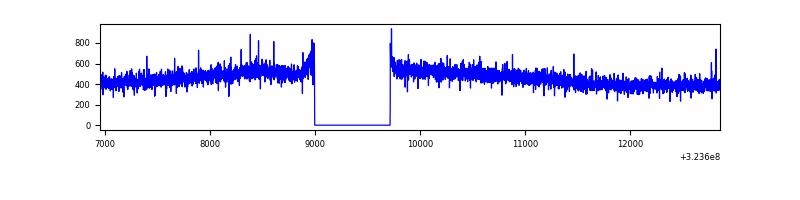 |
| D | 5903 | 5184 | 40 | 40 | 0.68% | 0.77% | 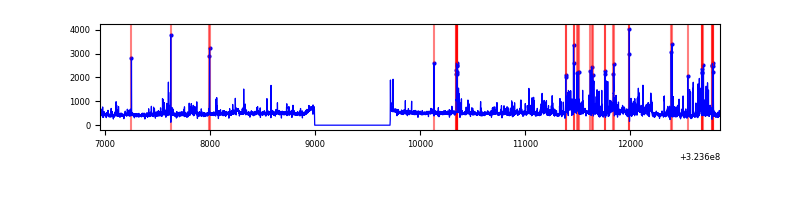 |
Top three noisy pixels from each quadrant. If the there are fewer than three noisy pixels in the level2.evt file, extra rows are filled as -1
| Pixel properties | Quadrant properties | ||||||
|---|---|---|---|---|---|---|---|
| Quadrant | DetID | PixID | Counts | Sigma | Mean | Median | Sigma |
| A | 13 | 254 | 8762 | 65.97 | 613 | 600 | 123.7 |
| A | 3 | 137 | 5470 | 39.36 | 613 | 600 | 123.7 |
| A | 0 | 226 | 5321 | 38.16 | 613 | 600 | 123.7 |
| B | 0 | 190 | 21257 | 175.18 | 610 | 594 | 118.0 |
| B | 12 | 111 | 14379 | 116.87 | 610 | 594 | 118.0 |
| B | 11 | 111 | 12392 | 100.02 | 610 | 594 | 118.0 |
| C | 14 | 238 | 93305 | 682.74 | 583 | 587 | 135.8 |
| C | 7 | 247 | 7340 | 49.73 | 583 | 587 | 135.8 |
| C | 13 | 61 | 4109 | 25.93 | 583 | 587 | 135.8 |
| D | 1 | 52 | 567679 | 3844.63 | 593 | 573 | 147.5 |
| D | 8 | 195 | 52192 | 349.94 | 593 | 573 | 147.5 |
| D | 7 | 238 | 31509 | 209.73 | 593 | 573 | 147.5 |
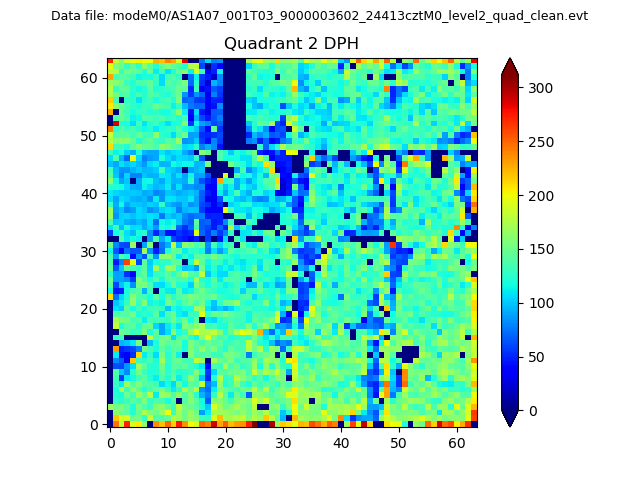
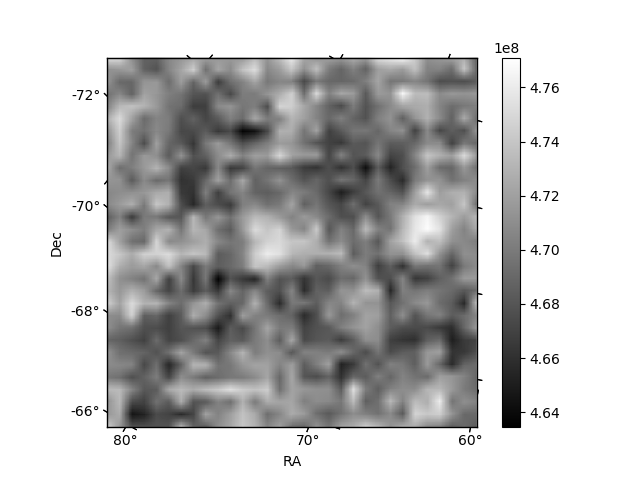
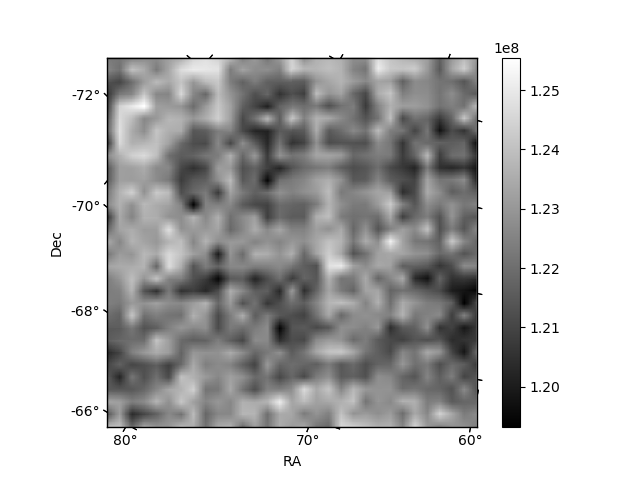
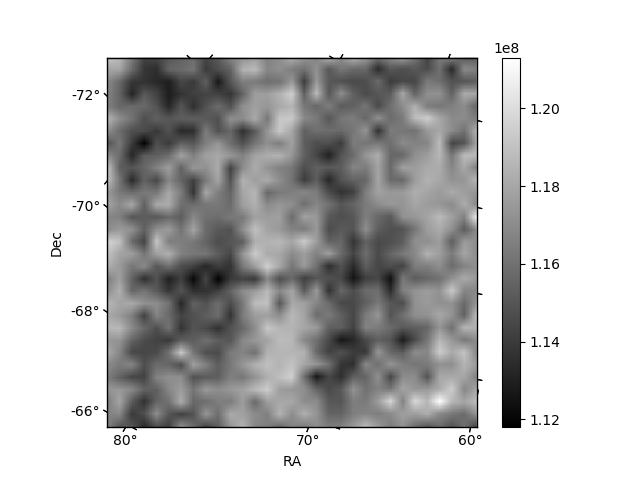
Histogram calculated using DETX and DETY for each event in the final _common_clean file
| Quadrant A | 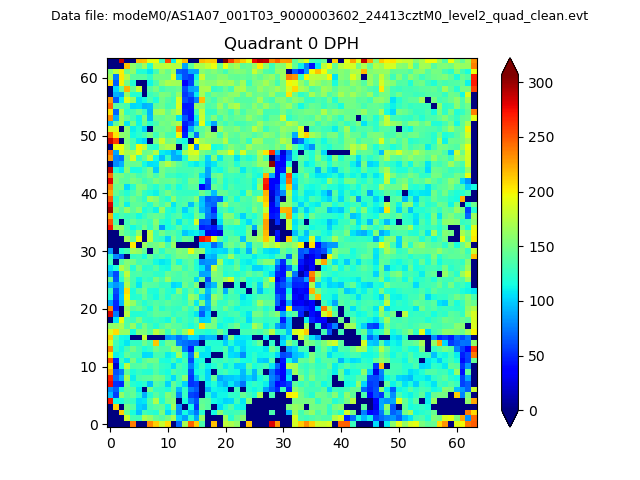 |
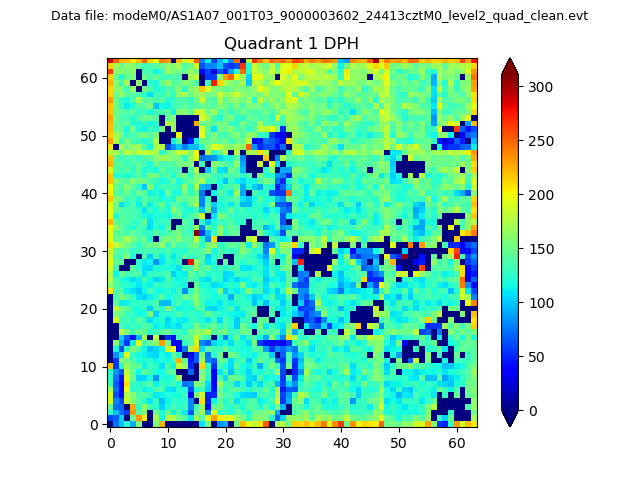 |
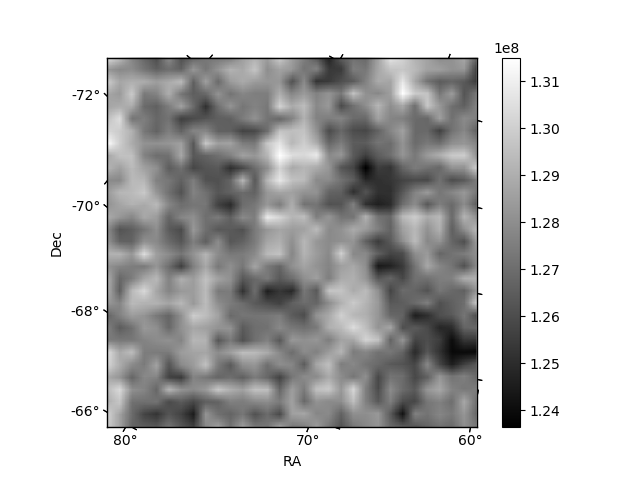
Quadrant B |
|---|---|---|---|
| Quadrant D | 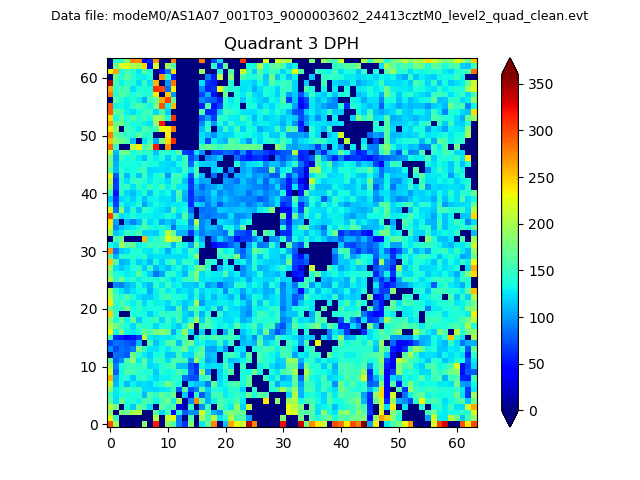 |
 |
Quadrant C |
| Plot type | Count rate plots | Images |
|---|---|---|
| Comparison with Poisson distribution Blue bars denote a histogram of data divided into 1 sec bins. Red curve is a Poisson curve with rate = median count rate of data. |
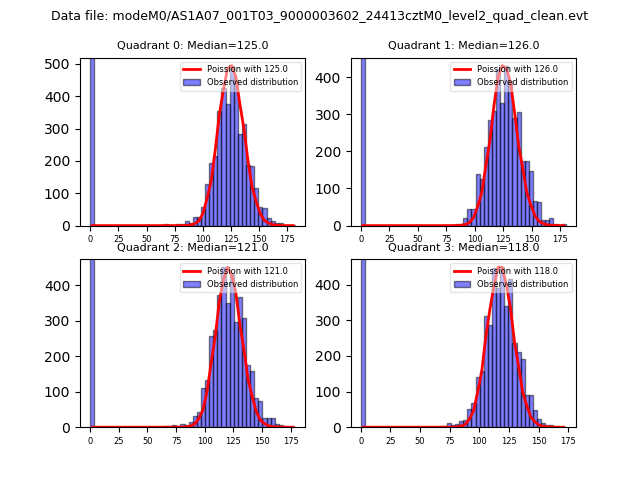 |
 |
| Quadrant-wise count rates Data is divided into 100 sec bins |
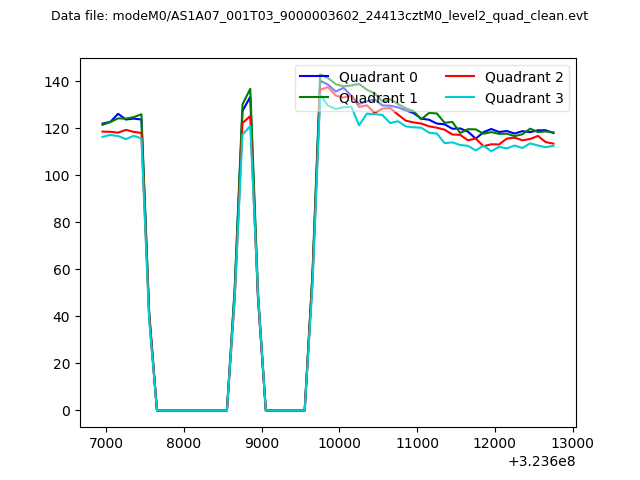 |
|
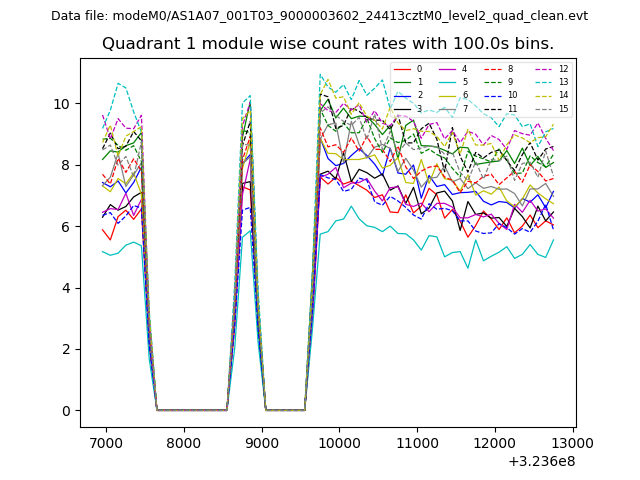
| Module-wise count rates for Quadrant A Data is divided into 100 sec bins |
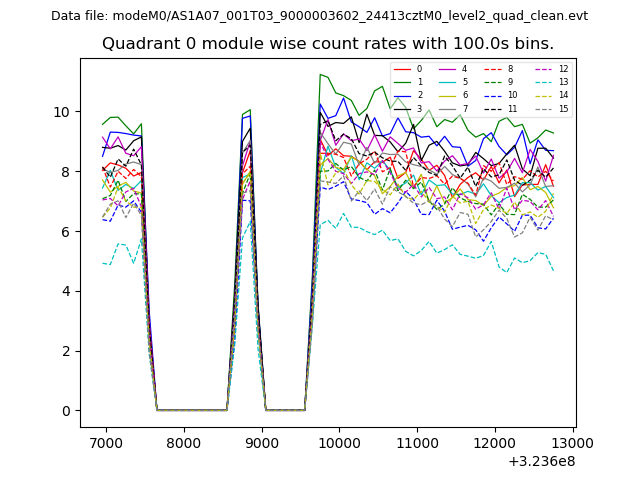 |
 |
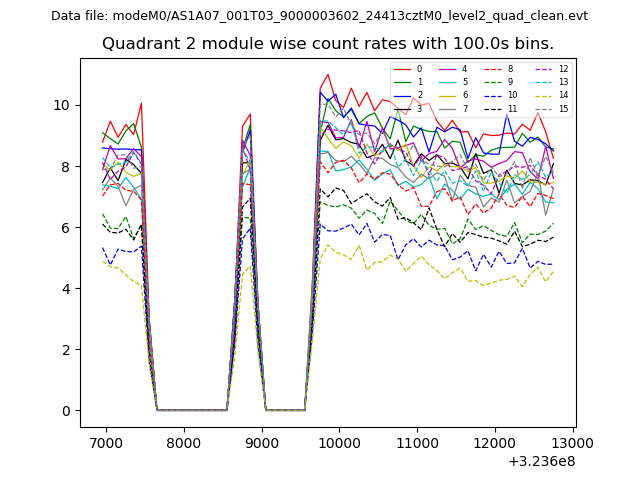
| Module-wise count rates for Quadrant B Data is divided into 100 sec bins |
 |
 |
| Module-wise count rates for Quadrant C Data is divided into 100 sec bins |
 |
 |
| Module-wise count rates for Quadrant D Data is divided into 100 sec bins |
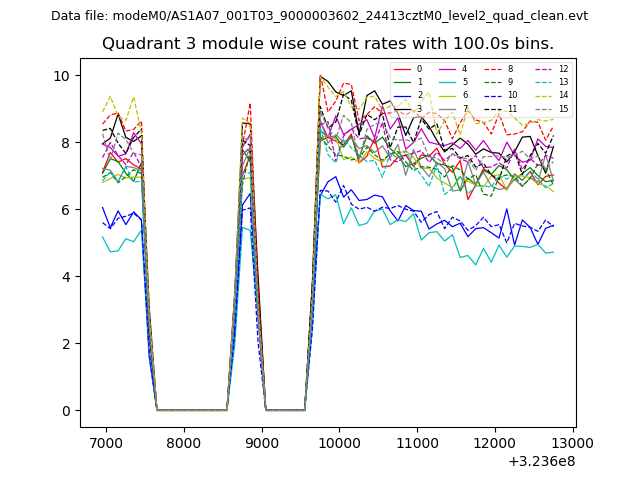 |
 |
| Parameter | Plot |
|---|---|
| CZT HV Monitor | 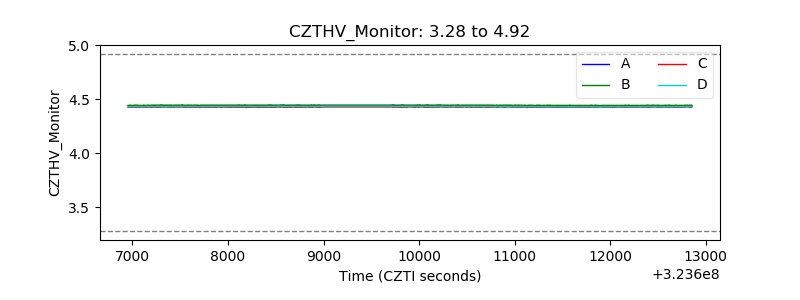 |
| D_VDD | 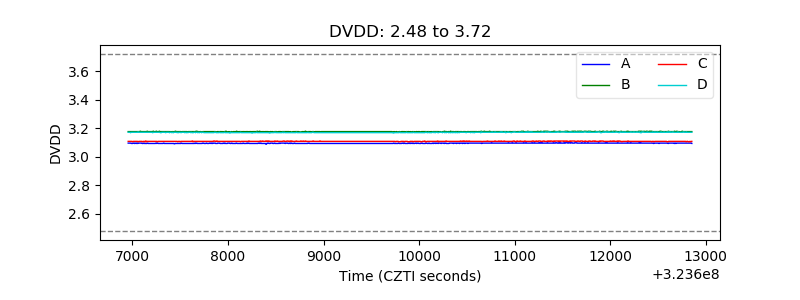 |
| Temperature 1 |  |
| Veto HV Monitor | 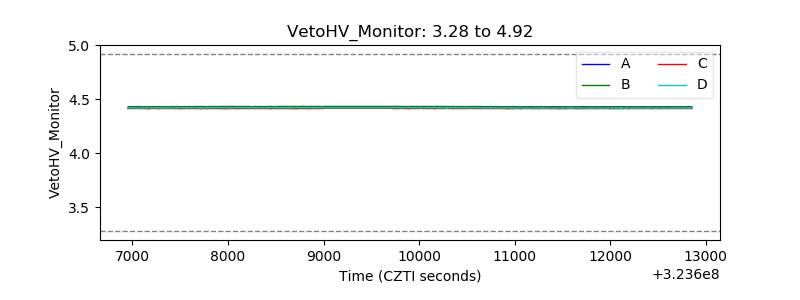 |
| Veto LLD | 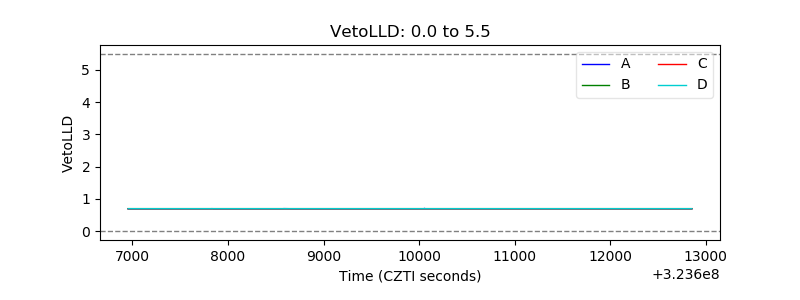 |
| Alpha Counter | 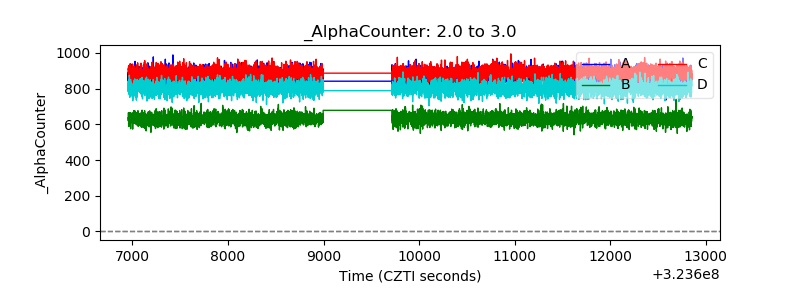 |
| _CPM_Rate | 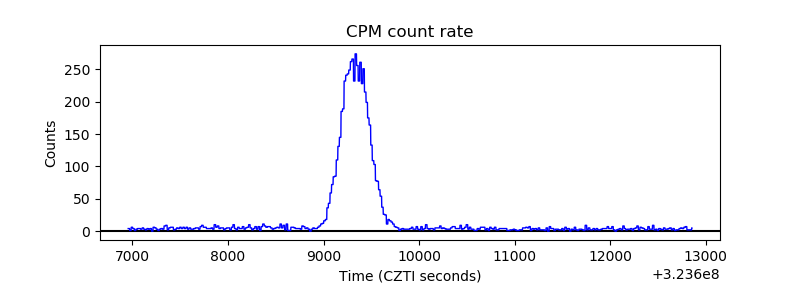 |
| CZT Counter | 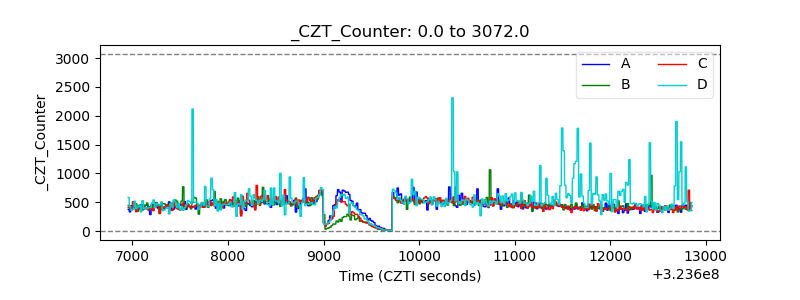 |
| +2.5 Volts monitor |  |
| +5 Volts monitor |  |
| _ROLL_ROT |  |
| _Roll_DEC | 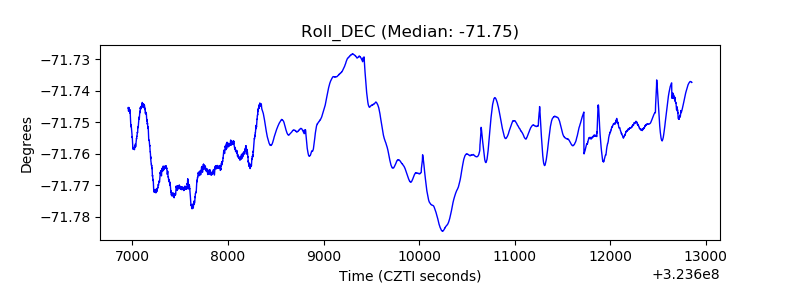 |
| _Roll_RA | 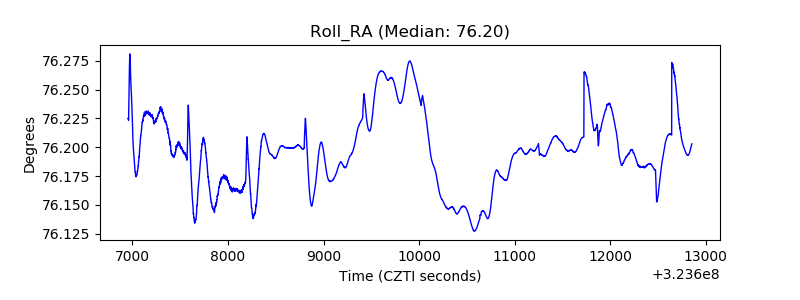 |
| Veto Counter | 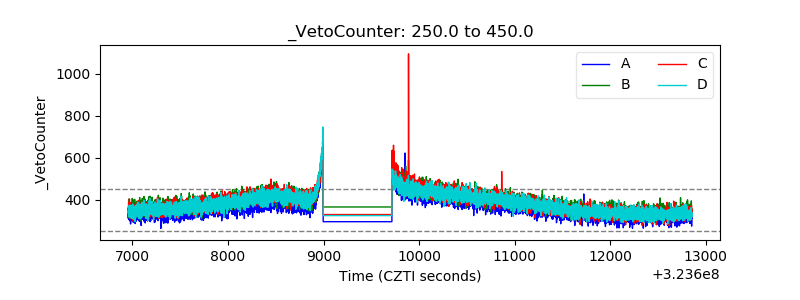 |