| Param | Original file | Final file |
|---|---|---|
| Filename | modeM0/AS1T03_189T01_9000003614_24621cztM0_level2.evt | modeM0/AS1T03_189T01_9000003614_24621cztM0_level2_quad_clean.evt |
| Size (bytes) | 514,080,000 | 103,841,280 |
| Size | 490.3 MB | 99.0 MB |
| Events in quadrant A | 3,645,639 | 693,550 |
| Events in quadrant B | 3,665,488 | 696,226 |
| Events in quadrant C | 3,881,952 | 656,457 |
| Events in quadrant D | 3,943,234 | 653,421 |
| Mode M9 | |||
|---|---|---|---|
| Quadrant | BADHDUFLAG | Total packets | Discarded packets |
| A | 0 | 19 | 0 |
| B | 0 | 20 | 0 |
| C | 0 | 20 | 0 |
| D | 0 | 20 | 0 |
| Mode M0 | |||
|---|---|---|---|
| Quadrant | BADHDUFLAG | Total packets | Discarded packets |
| A | 0 | 15074 | 2 |
| B | 0 | 14997 | 2 |
| C | 0 | 15736 | 2 |
| D | 0 | 16023 | 3 |
| Mode SS | |||
|---|---|---|---|
| Quadrant | BADHDUFLAG | Total packets | Discarded packets |
| A | 0 | 130 | 0 |
| B | 0 | 130 | 0 |
| C | 0 | 130 | 0 |
| D | 0 | 130 | 0 |
| Quadrant | Total seconds | Saturated seconds | Saturation percentage |
|---|---|---|---|
| A | 6380 | 134 | 2.100313% |
| B | 6380 | 141 | 2.210031% |
| C | 6380 | 229 | 3.589342% |
| D | 6379 | 101 | 1.583320% |
Noise dominated data is calculated using 1-second bins in cleaned event files. If a bin has >2000 counts, and if more than 50% of those come from <1% of pixels, then it is considered to be noise-dominated and hence unusable.
| Quadrant | # 1 sec bins | Bins with >0 counts | Bins with >2000 counts | High rate bins dominated by noise | Noise dominated (total time) | Noise dominated (detector-on time) | Marked lightcurve |
|---|---|---|---|---|---|---|---|
| A | 7690 | 6380 | 0 | 0 | 0.00% | 0.00% | 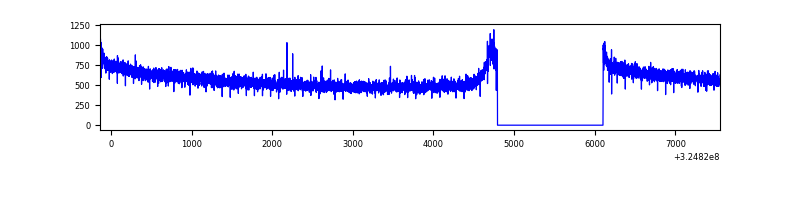 |
| B | 7690 | 6380 | 0 | 0 | 0.00% | 0.00% | 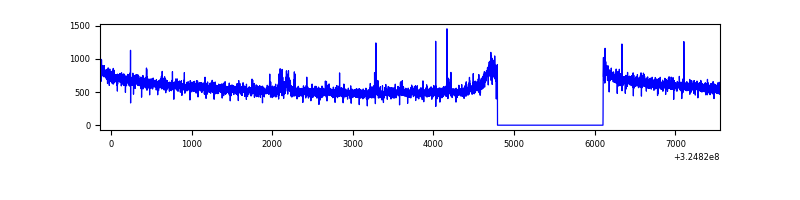 |
| C | 7690 | 6380 | 5 | 5 | 0.07% | 0.08% |  |
| D | 7689 | 6379 | 4 | 4 | 0.05% | 0.06% | 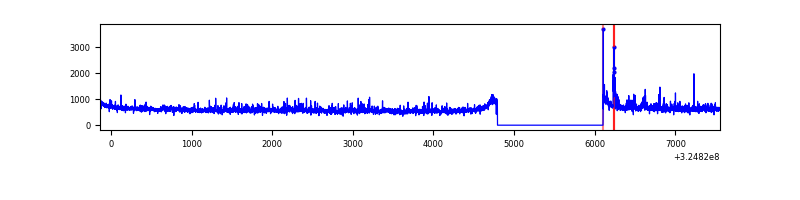 |
Top three noisy pixels from each quadrant. If the there are fewer than three noisy pixels in the level2.evt file, extra rows are filled as -1
| Pixel properties | Quadrant properties | ||||||
|---|---|---|---|---|---|---|---|
| Quadrant | DetID | PixID | Counts | Sigma | Mean | Median | Sigma |
| A | 13 | 254 | 9421 | 46.02 | 945 | 930 | 184.5 |
| A | 0 | 226 | 8125 | 39.0 | 945 | 930 | 184.5 |
| A | 3 | 137 | 7724 | 36.83 | 945 | 930 | 184.5 |
| B | 3 | 64 | 30711 | 174.41 | 923 | 903 | 170.9 |
| B | 12 | 111 | 20060 | 112.09 | 923 | 903 | 170.9 |
| B | 7 | 202 | 18473 | 102.81 | 923 | 903 | 170.9 |
| C | 7 | 247 | 191350 | 936.9 | 888 | 898 | 203.3 |
| C | 14 | 238 | 145800 | 712.82 | 888 | 898 | 203.3 |
| C | 3 | 233 | 51291 | 247.9 | 888 | 898 | 203.3 |
| D | 1 | 52 | 299980 | 1369.61 | 917 | 894 | 218.4 |
| D | 8 | 195 | 135269 | 615.35 | 917 | 894 | 218.4 |
| D | 10 | 70 | 32796 | 146.09 | 917 | 894 | 218.4 |
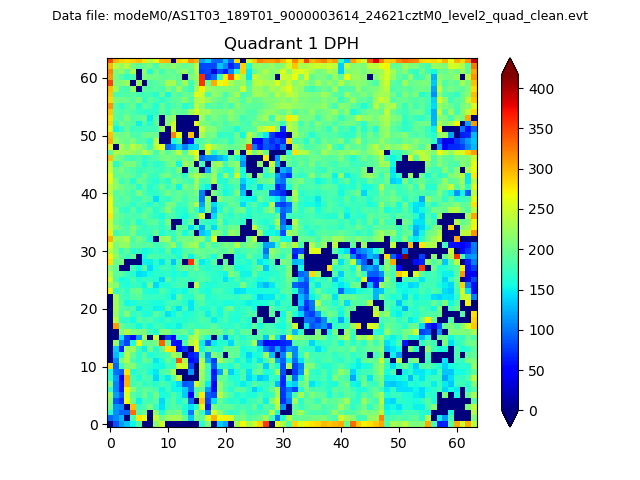
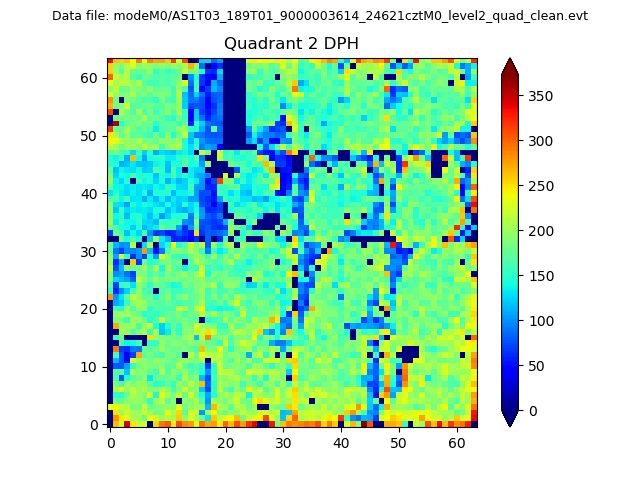
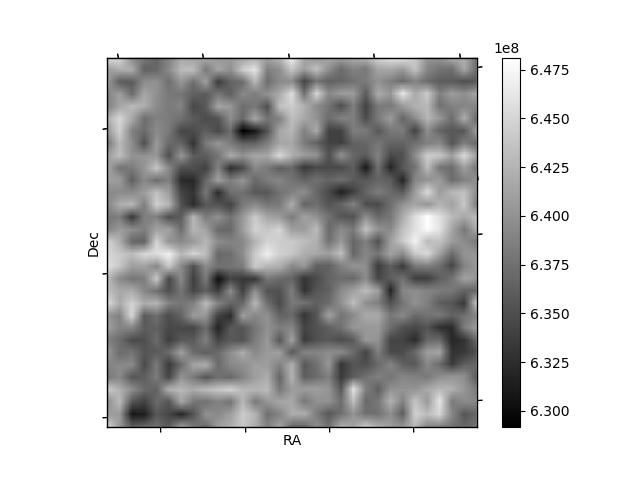
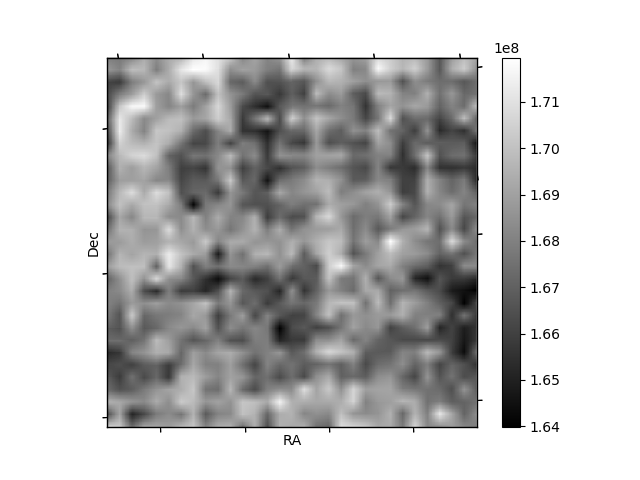
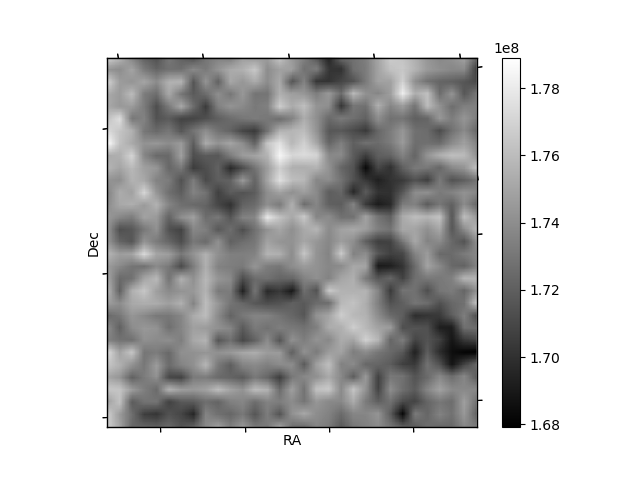
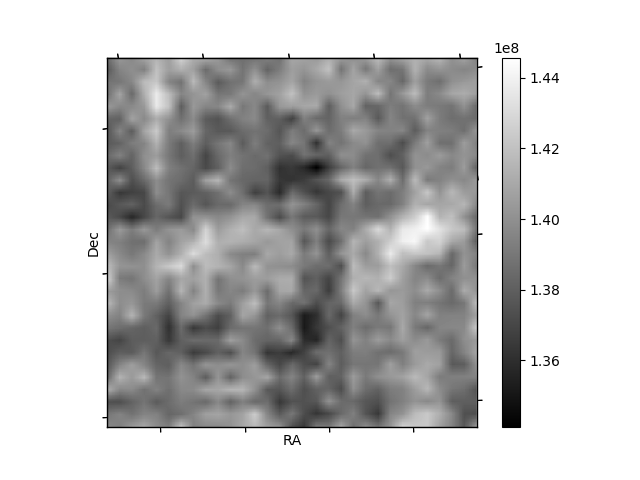
Histogram calculated using DETX and DETY for each event in the final _common_clean file
| Quadrant A | 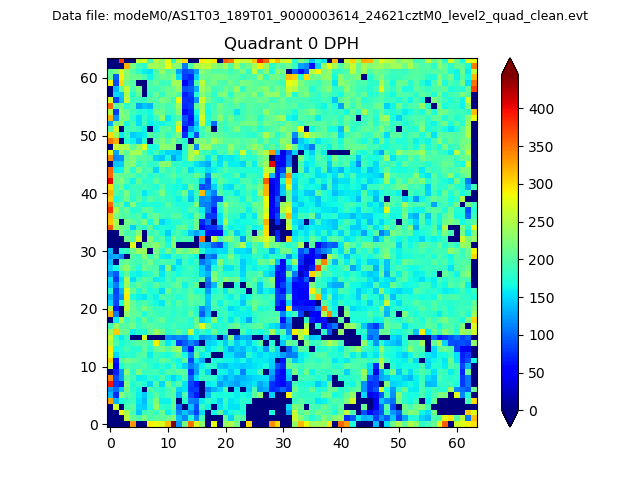 |
 |
Quadrant B |
|---|---|---|---|
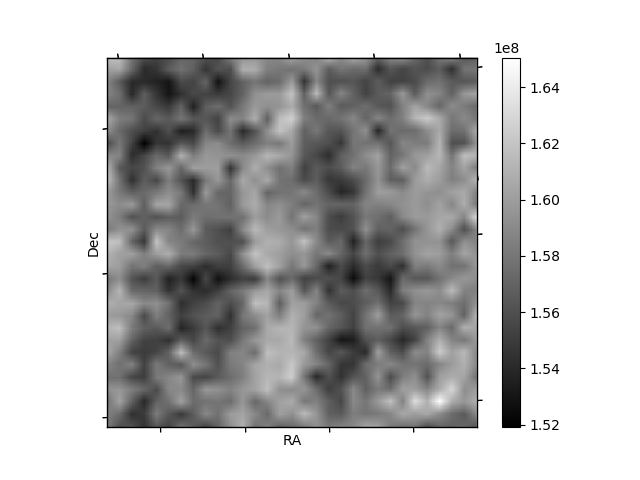
| Quadrant D | 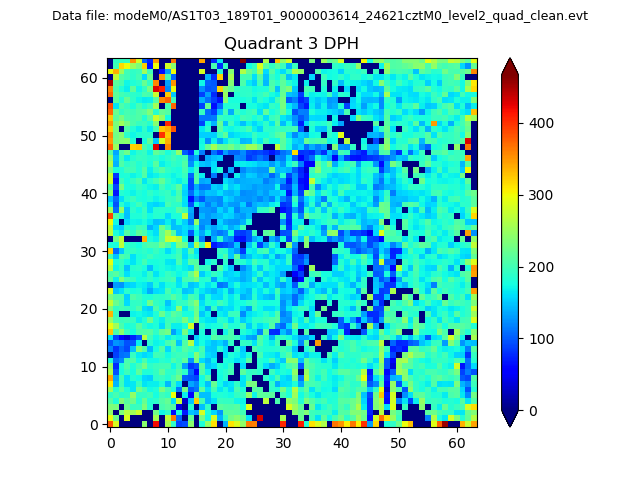 |
 |
Quadrant C |
| Plot type | Count rate plots | Images |
|---|---|---|
| Comparison with Poisson distribution Blue bars denote a histogram of data divided into 1 sec bins. Red curve is a Poisson curve with rate = median count rate of data. |
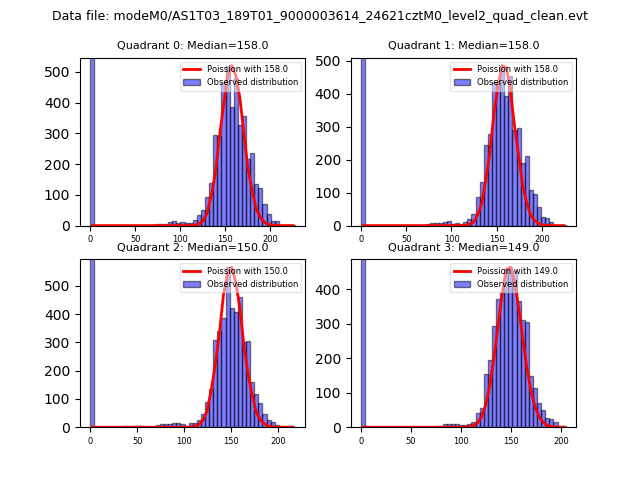 |
 |
| Quadrant-wise count rates Data is divided into 100 sec bins |
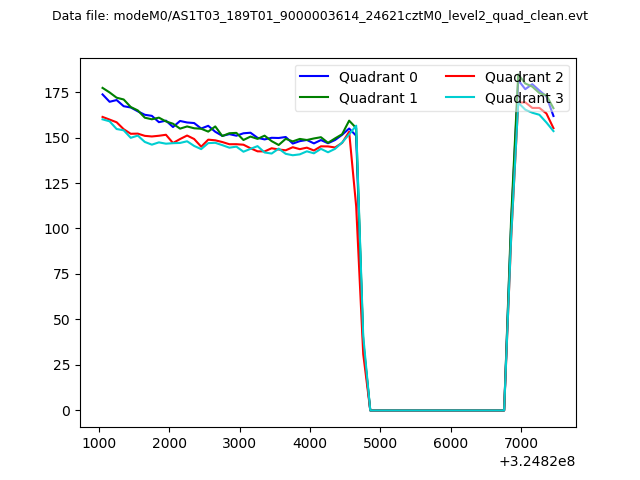 |
|
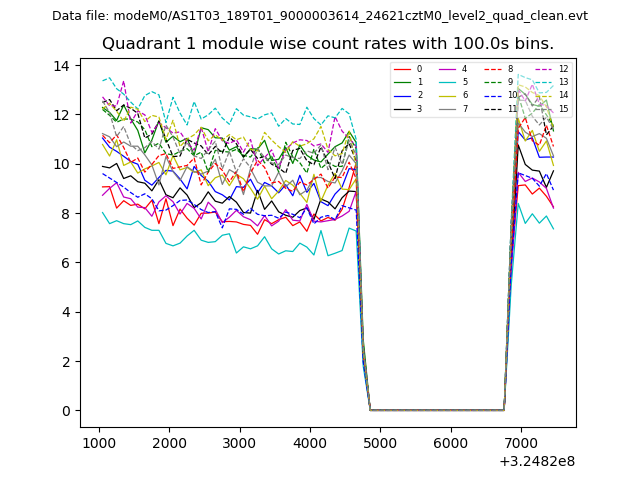
| Module-wise count rates for Quadrant A Data is divided into 100 sec bins |
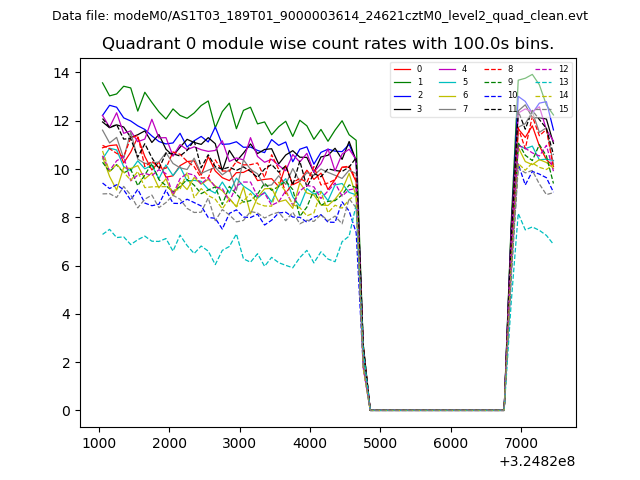 |
 |
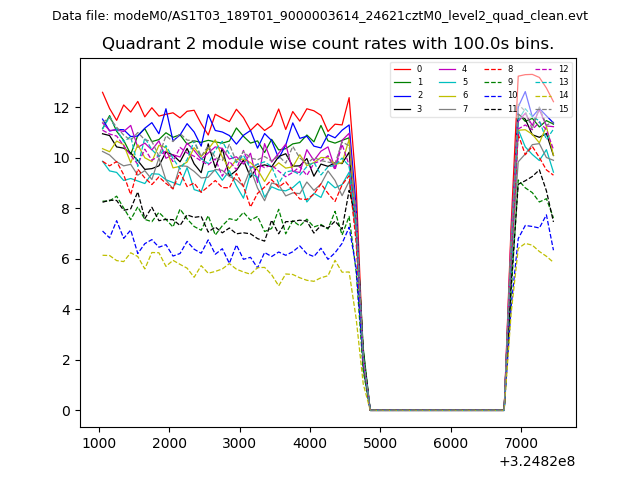
| Module-wise count rates for Quadrant B Data is divided into 100 sec bins |
 |
 |
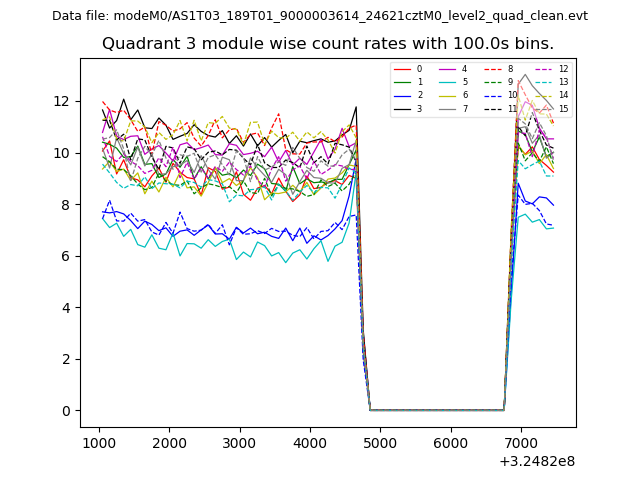
| Module-wise count rates for Quadrant C Data is divided into 100 sec bins |
 |
 |
| Module-wise count rates for Quadrant D Data is divided into 100 sec bins |
 |
 |
| Parameter | Plot |
|---|---|
| CZT HV Monitor | 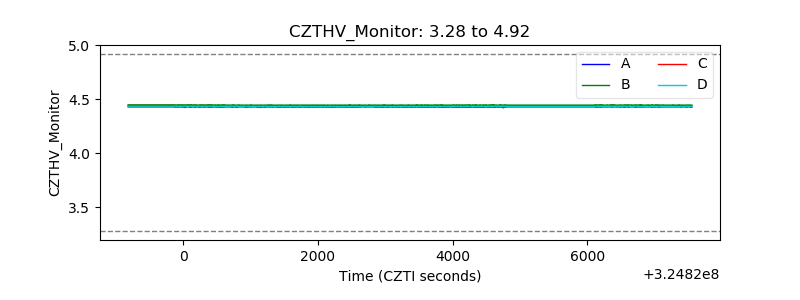 |
| D_VDD | 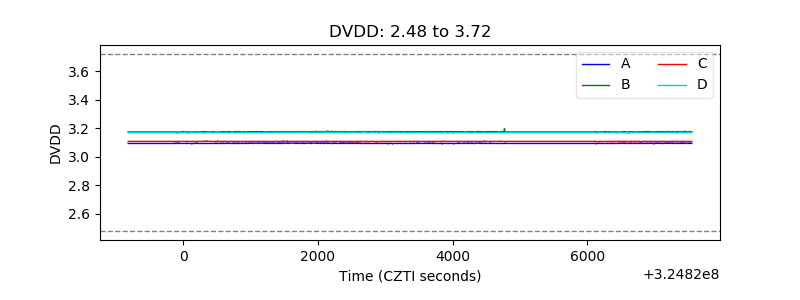 |
| Temperature 1 | 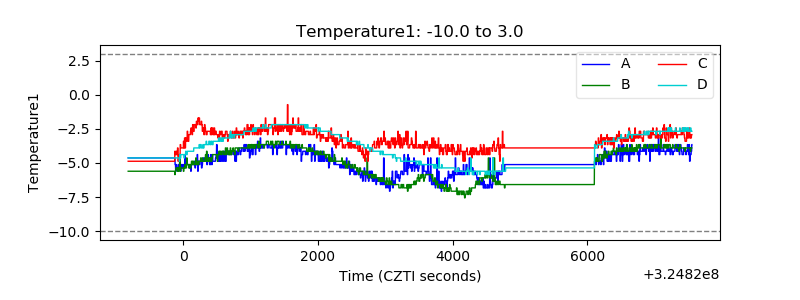 |
| Veto HV Monitor |  |
| Veto LLD | 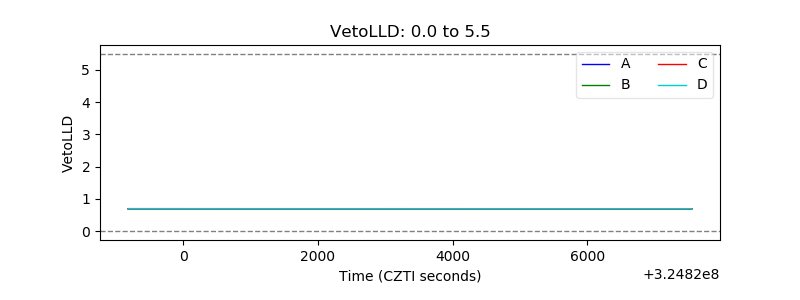 |
| Alpha Counter | 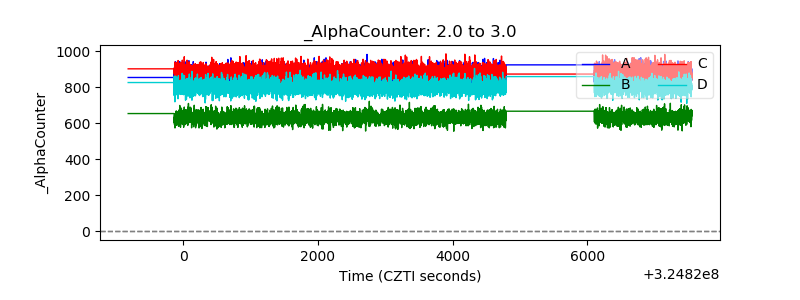 |
| _CPM_Rate | 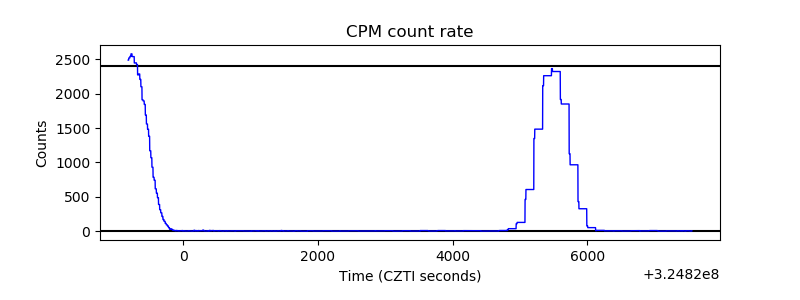 |
| CZT Counter | 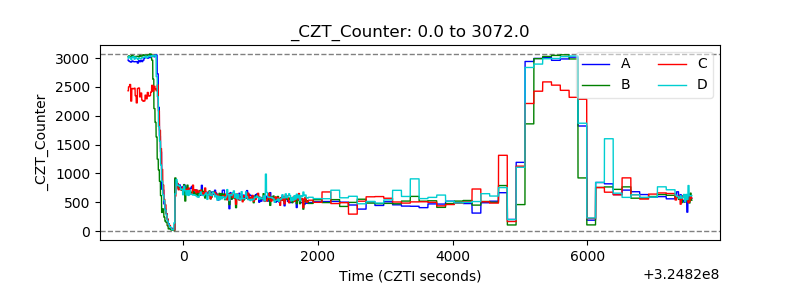 |
| +2.5 Volts monitor |  |
| +5 Volts monitor |  |
| _ROLL_ROT | 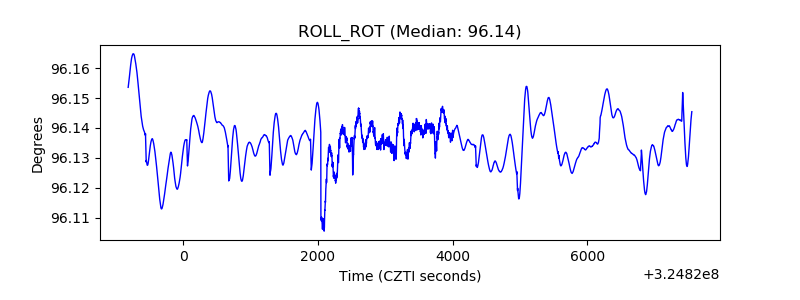 |
| _Roll_DEC | 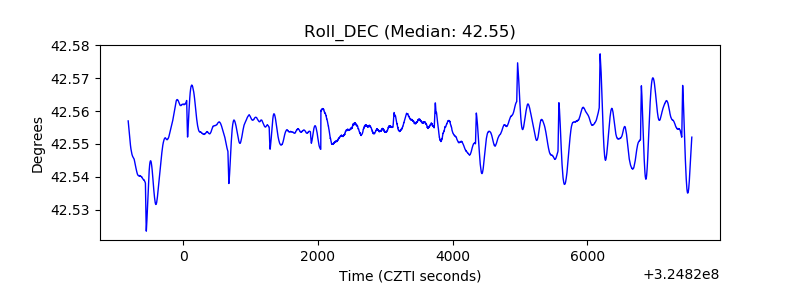 |
| _Roll_RA | 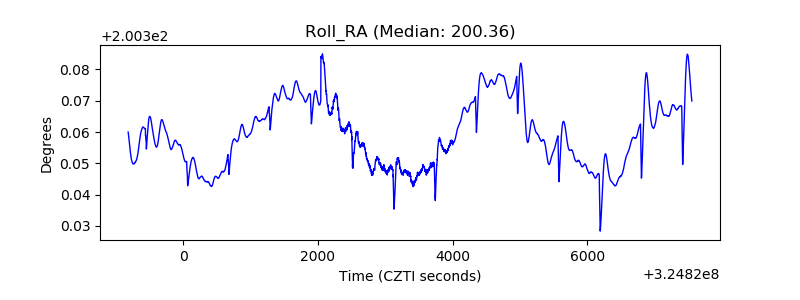 |
| Veto Counter | 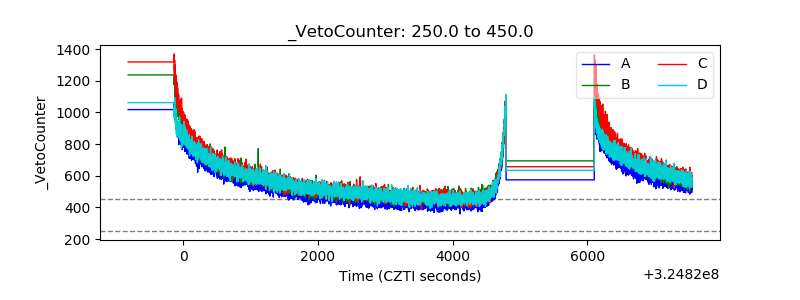 |