| Param | Original file | Final file |
|---|---|---|
| Filename | modeM0/AS1T03_200T01_9000003654_24941cztM0_level2.evt | modeM0/AS1T03_200T01_9000003654_24941cztM0_level2_quad_clean.evt |
| Size (bytes) | 515,787,840 | 134,688,960 |
| Size | 491.9 MB | 128.4 MB |
| Events in quadrant A | 3,172,133 | 937,131 |
| Events in quadrant B | 3,396,358 | 955,351 |
| Events in quadrant C | 3,913,853 | 892,393 |
| Events in quadrant D | 4,702,856 | 846,784 |
| Mode M9 | |||
|---|---|---|---|
| Quadrant | BADHDUFLAG | Total packets | Discarded packets |
| A | 0 | 15 | 0 |
| B | 0 | 16 | 0 |
| C | 0 | 16 | 0 |
| D | 0 | 16 | 0 |
| Mode SS | |||
|---|---|---|---|
| Quadrant | BADHDUFLAG | Total packets | Discarded packets |
| A | 0 | 130 | 0 |
| B | 0 | 130 | 0 |
| C | 0 | 130 | 0 |
| D | 0 | 130 | 0 |
| Mode M0 | |||
|---|---|---|---|
| Quadrant | BADHDUFLAG | Total packets | Discarded packets |
| A | 0 | 13332 | 2 |
| B | 0 | 14071 | 2 |
| C | 0 | 16255 | 2 |
| D | 0 | 18298 | 2 |
| Quadrant | Total seconds | Saturated seconds | Saturation percentage |
|---|---|---|---|
| A | 6421 | 38 | 0.591808% |
| B | 6421 | 106 | 1.650833% |
| C | 6421 | 109 | 1.697555% |
| D | 6421 | 518 | 8.067279% |
Noise dominated data is calculated using 1-second bins in cleaned event files. If a bin has >2000 counts, and if more than 50% of those come from <1% of pixels, then it is considered to be noise-dominated and hence unusable.
| Quadrant | # 1 sec bins | Bins with >0 counts | Bins with >2000 counts | High rate bins dominated by noise | Noise dominated (total time) | Noise dominated (detector-on time) | Marked lightcurve |
|---|---|---|---|---|---|---|---|
| A | 7736 | 6422 | 0 | 0 | 0.00% | 0.00% | 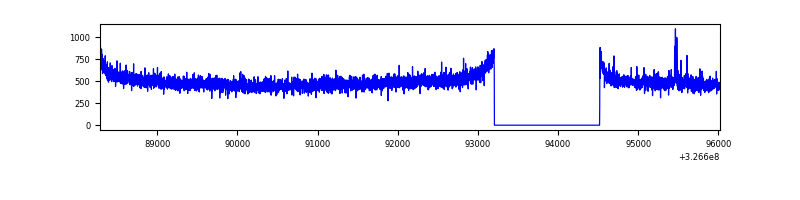 |
| B | 7736 | 6422 | 30 | 30 | 0.39% | 0.47% | 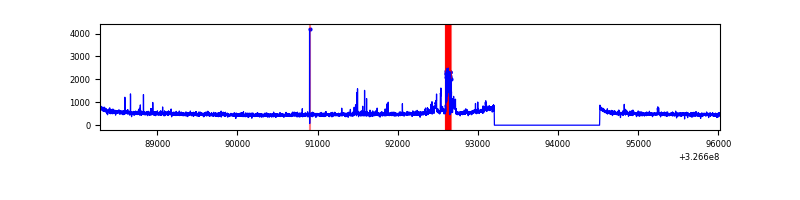 |
| C | 7736 | 6422 | 0 | 0 | 0.00% | 0.00% | 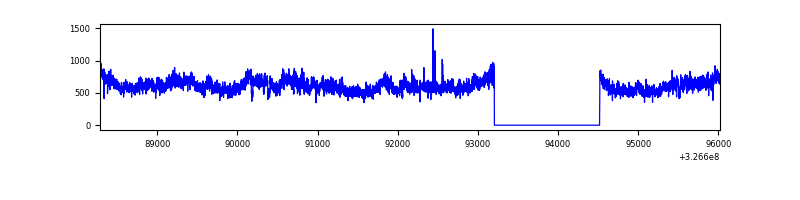 |
| D | 7736 | 6422 | 403 | 403 | 5.21% | 6.28% | 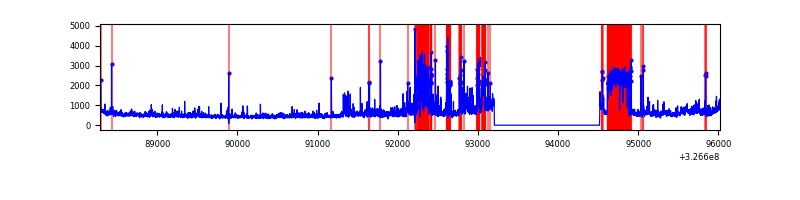 |
Top three noisy pixels from each quadrant. If the there are fewer than three noisy pixels in the level2.evt file, extra rows are filled as -1
| Pixel properties | Quadrant properties | ||||||
|---|---|---|---|---|---|---|---|
| Quadrant | DetID | PixID | Counts | Sigma | Mean | Median | Sigma |
| A | 15 | 223 | 21021 | 125.26 | 811 | 798 | 161.5 |
| A | 6 | 16 | 17715 | 104.78 | 811 | 798 | 161.5 |
| A | 13 | 254 | 10436 | 59.7 | 811 | 798 | 161.5 |
| B | 5 | 172 | 160660 | 1067.33 | 810 | 792 | 149.8 |
| B | 12 | 111 | 17526 | 111.72 | 810 | 792 | 149.8 |
| B | 11 | 111 | 15430 | 97.73 | 810 | 792 | 149.8 |
| C | 7 | 247 | 781490 | 4441.01 | 767 | 770 | 175.8 |
| C | 14 | 238 | 126989 | 717.98 | 767 | 770 | 175.8 |
| C | 0 | 207 | 5578 | 27.35 | 767 | 770 | 175.8 |
| D | 1 | 52 | 1556998 | 8576.78 | 758 | 738 | 181.5 |
| D | 2 | 244 | 81766 | 446.56 | 758 | 738 | 181.5 |
| D | 8 | 195 | 81420 | 444.65 | 758 | 738 | 181.5 |
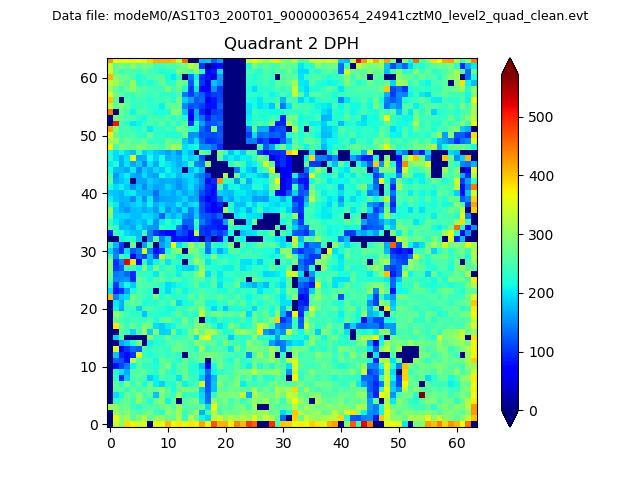
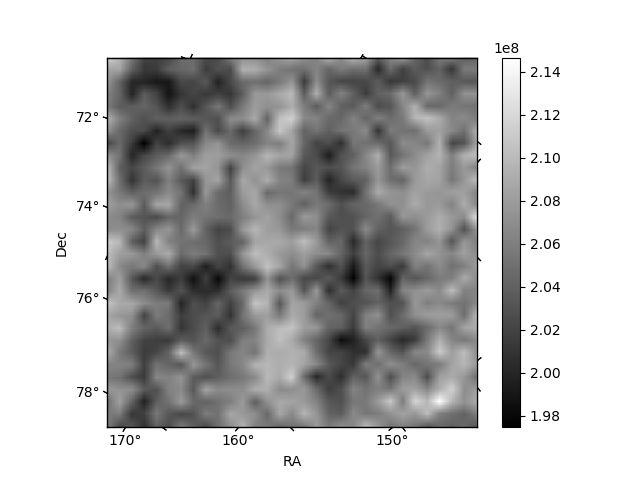
Histogram calculated using DETX and DETY for each event in the final _common_clean file
| Quadrant A | 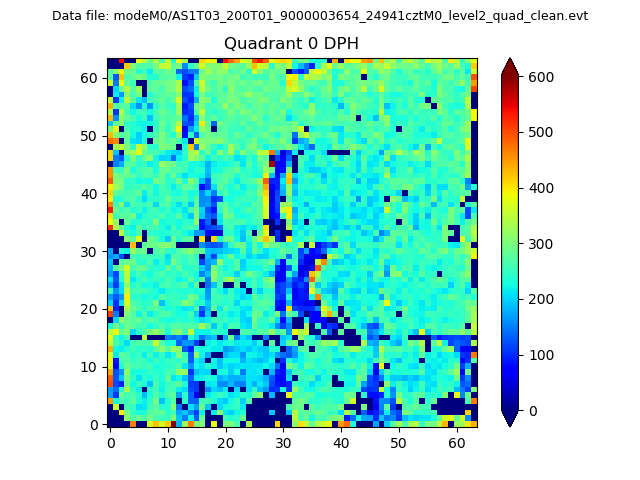 |
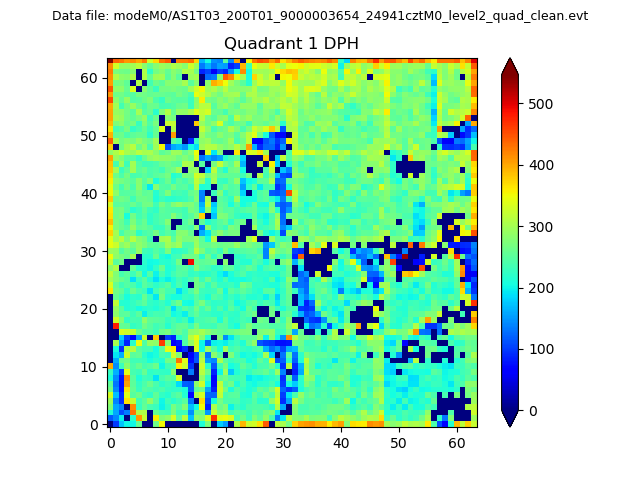 |
Quadrant B |
|---|---|---|---|
| Quadrant D | 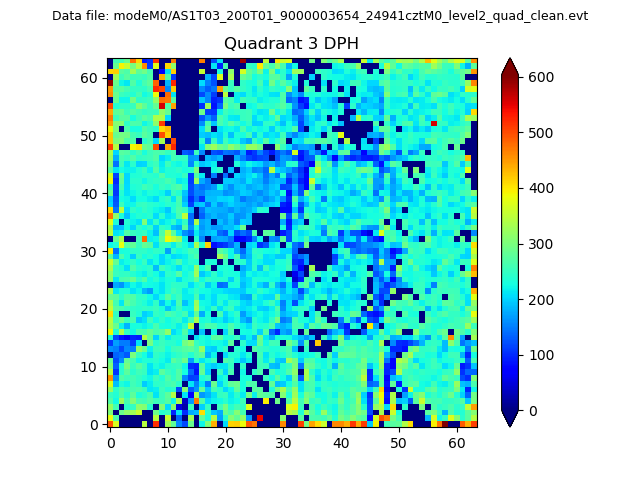 |
 |
Quadrant C |
| Plot type | Count rate plots | Images |
|---|---|---|
| Comparison with Poisson distribution Blue bars denote a histogram of data divided into 1 sec bins. Red curve is a Poisson curve with rate = median count rate of data. |
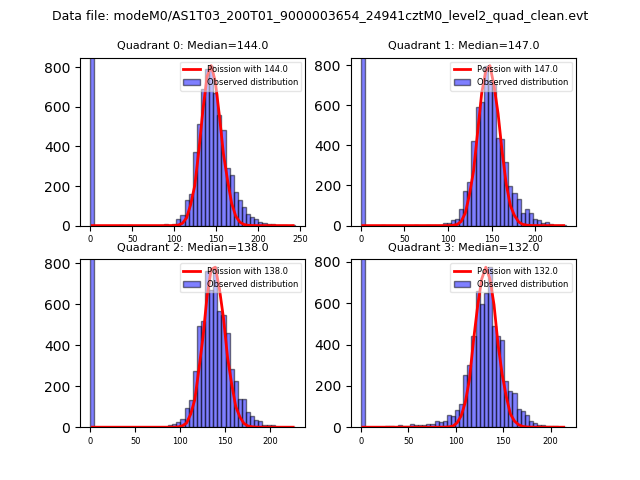 |
 |
| Quadrant-wise count rates Data is divided into 100 sec bins |
 |
|
| Module-wise count rates for Quadrant A Data is divided into 100 sec bins |
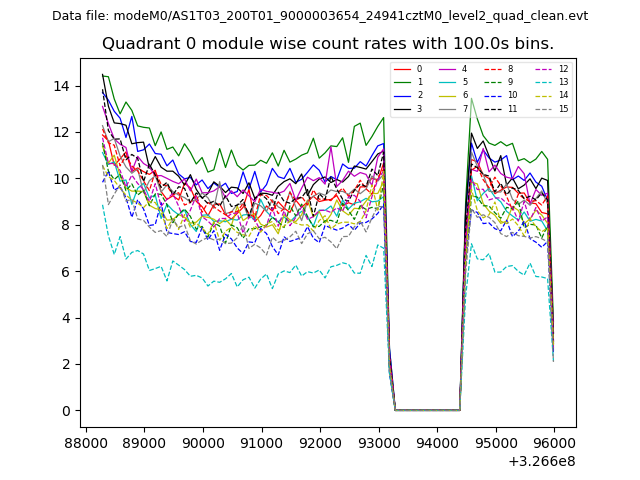 |
 |
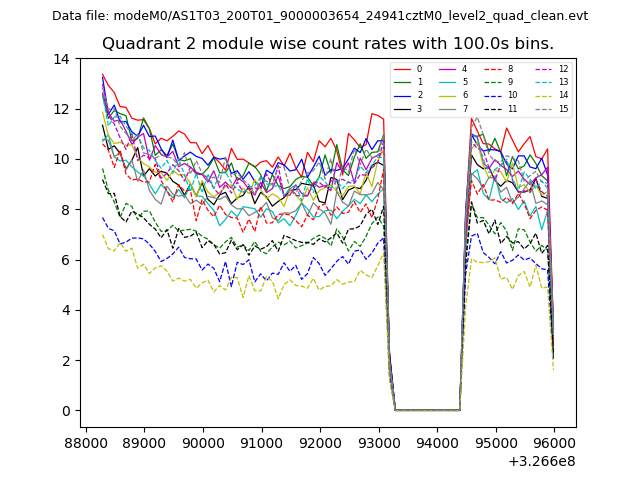
| Module-wise count rates for Quadrant B Data is divided into 100 sec bins |
 |
 |
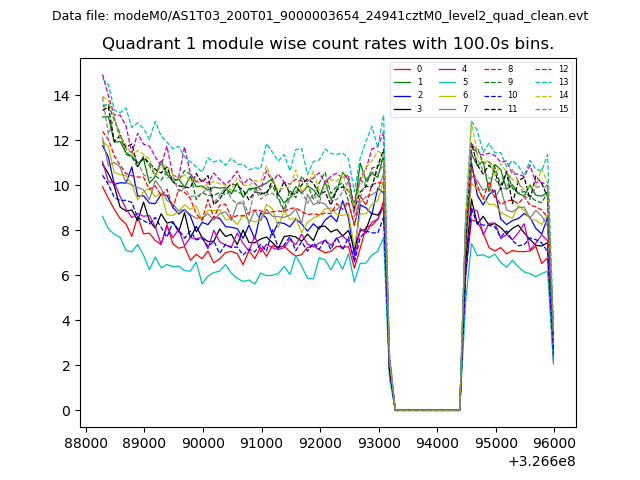
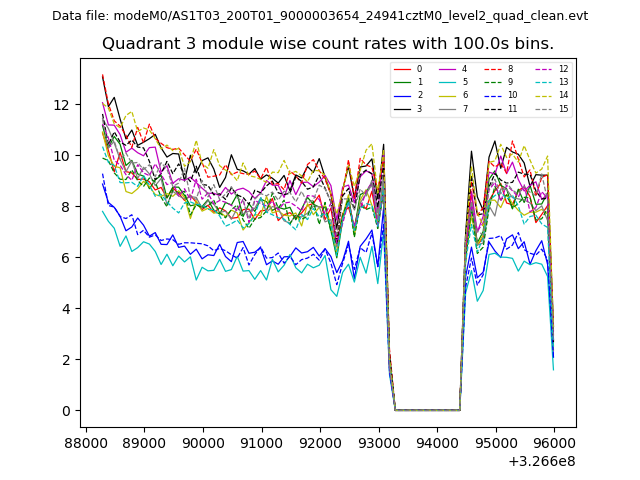
| Module-wise count rates for Quadrant C Data is divided into 100 sec bins |
 |
 |
| Module-wise count rates for Quadrant D Data is divided into 100 sec bins |
 |
 |
| Parameter | Plot |
|---|---|
| CZT HV Monitor | 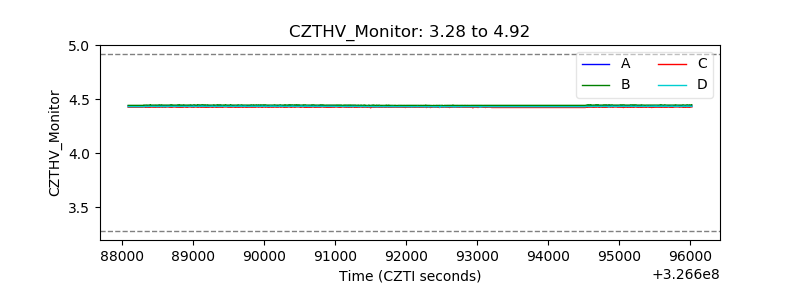 |
| D_VDD | 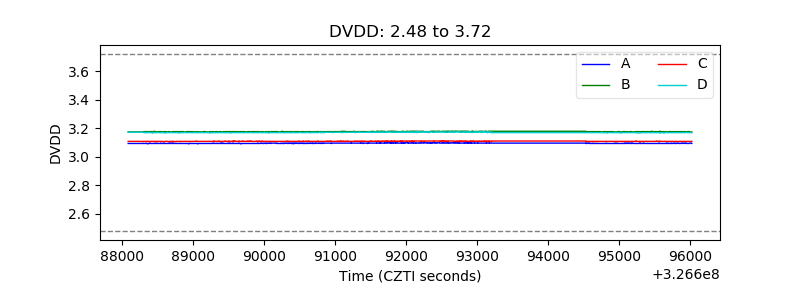 |
| Temperature 1 | 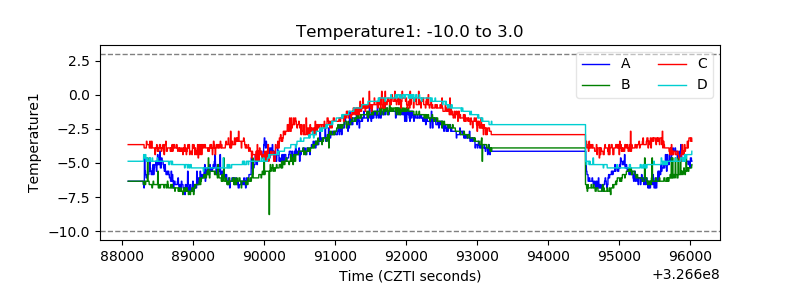 |
| Veto HV Monitor | 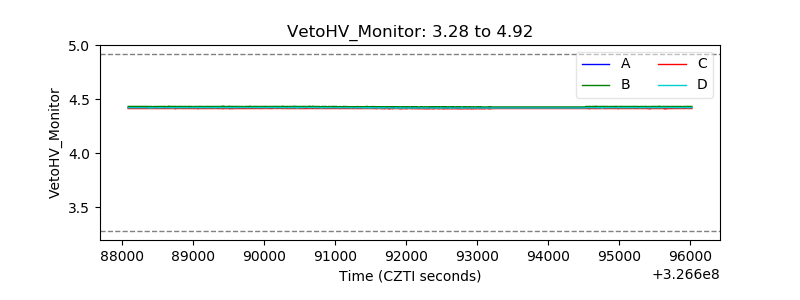 |
| Veto LLD | 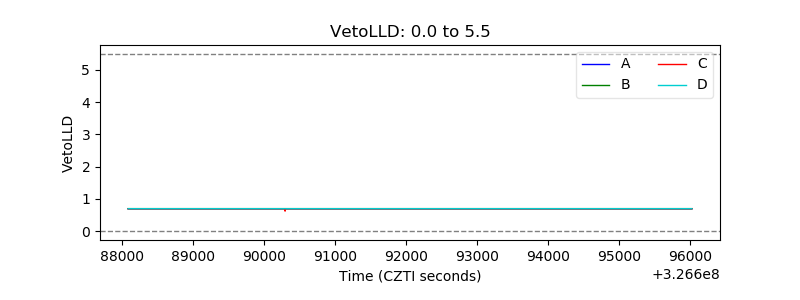 |
| Alpha Counter |  |
| _CPM_Rate | 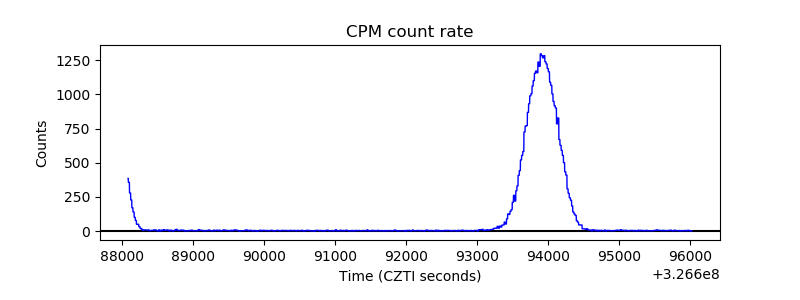 |
| CZT Counter | 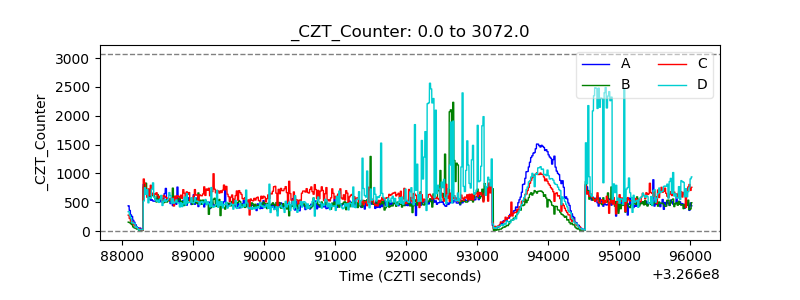 |
| +2.5 Volts monitor | 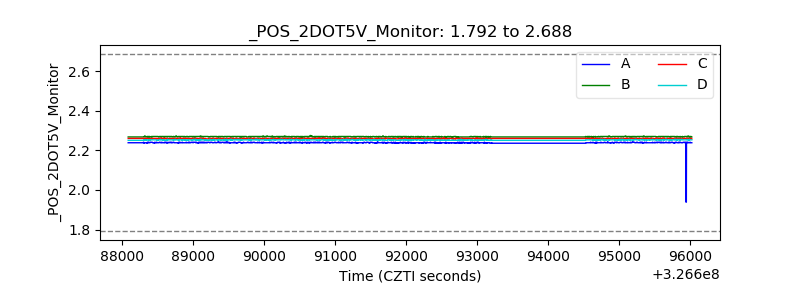 |
| +5 Volts monitor |  |
| _ROLL_ROT | 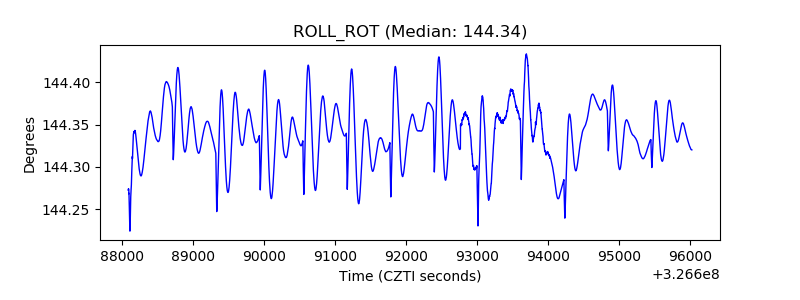 |
| _Roll_DEC | 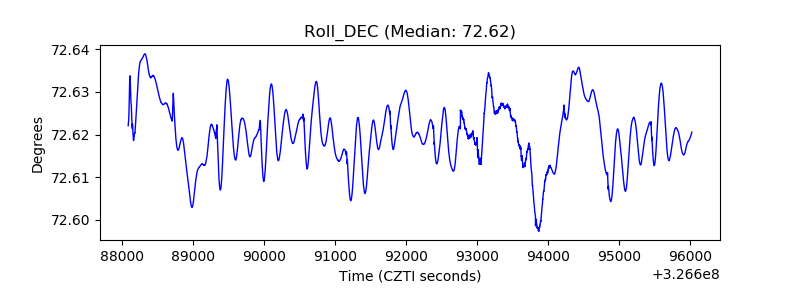 |
| _Roll_RA | 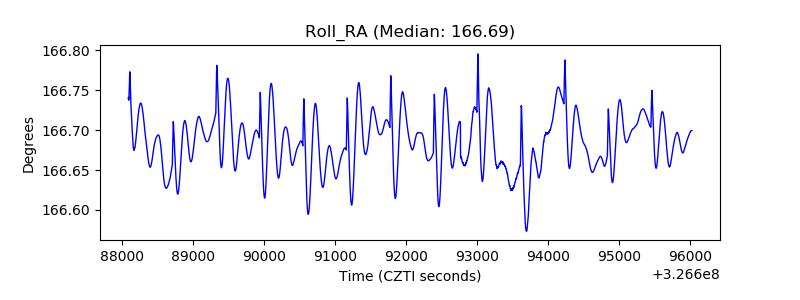 |
| Veto Counter | 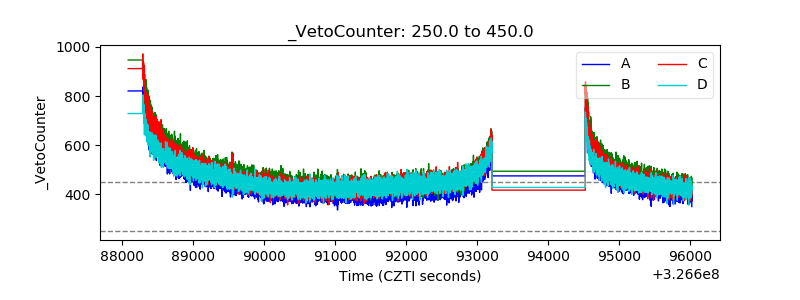 |