| Param | Original file | Final file |
|---|---|---|
| Filename | modeM0/AS1A07_018T09_9000003682_25154cztM0_level2.evt | modeM0/AS1A07_018T09_9000003682_25154cztM0_level2_quad_clean.evt |
| Size (bytes) | 516,363,840 | 67,898,880 |
| Size | 492.4 MB | 64.8 MB |
| Events in quadrant A | 3,375,203 | 407,330 |
| Events in quadrant B | 3,427,567 | 409,965 |
| Events in quadrant C | 3,978,961 | 391,380 |
| Events in quadrant D | 4,410,573 | 388,617 |
| Mode M0 | |||
|---|---|---|---|
| Quadrant | BADHDUFLAG | Total packets | Discarded packets |
| A | 0 | 14147 | 0 |
| B | 0 | 14268 | 0 |
| C | 0 | 16054 | 0 |
| D | 0 | 17491 | 0 |
| Mode M9 | |||
|---|---|---|---|
| Quadrant | BADHDUFLAG | Total packets | Discarded packets |
| A | 0 | 11 | 0 |
| B | 0 | 12 | 0 |
| C | 0 | 12 | 0 |
| D | 0 | 12 | 0 |
| Quadrant | Total seconds | Saturated seconds | Saturation percentage |
|---|---|---|---|
| A | 6574 | 50 | 0.760572% |
| B | 6574 | 55 | 0.836629% |
| C | 6574 | 105 | 1.597201% |
| D | 6573 | 205 | 3.118819% |
Noise dominated data is calculated using 1-second bins in cleaned event files. If a bin has >2000 counts, and if more than 50% of those come from <1% of pixels, then it is considered to be noise-dominated and hence unusable.
| Quadrant | # 1 sec bins | Bins with >0 counts | Bins with >2000 counts | High rate bins dominated by noise | Noise dominated (total time) | Noise dominated (detector-on time) | Marked lightcurve |
|---|---|---|---|---|---|---|---|
| A | 7679 | 6574 | 0 | 0 | 0.00% | 0.00% | 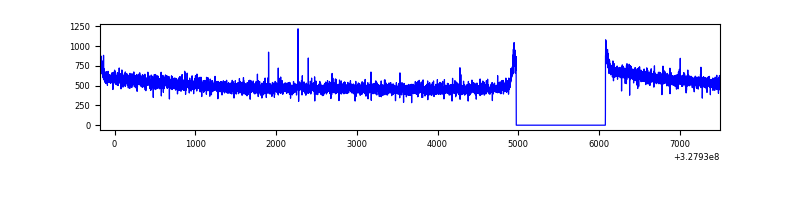 |
| B | 7679 | 6574 | 0 | 0 | 0.00% | 0.00% | 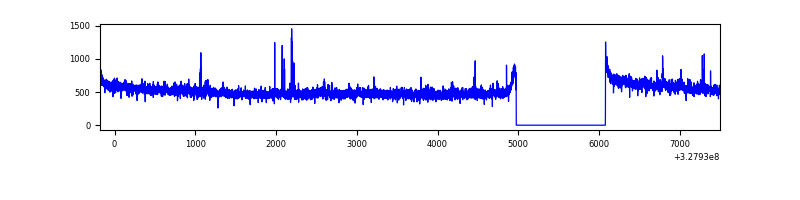 |
| C | 7679 | 6574 | 0 | 0 | 0.00% | 0.00% | 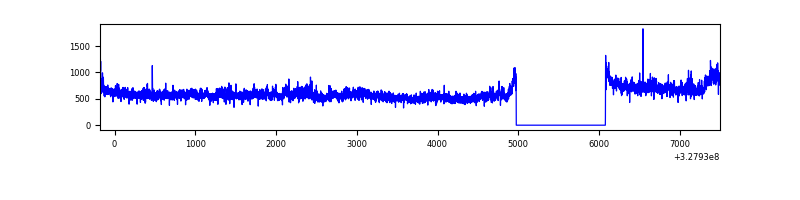 |
| D | 7678 | 6573 | 142 | 142 | 1.85% | 2.16% | 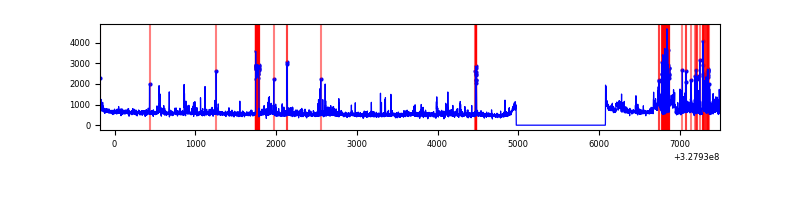 |
Top three noisy pixels from each quadrant. If the there are fewer than three noisy pixels in the level2.evt file, extra rows are filled as -1
| Pixel properties | Quadrant properties | ||||||
|---|---|---|---|---|---|---|---|
| Quadrant | DetID | PixID | Counts | Sigma | Mean | Median | Sigma |
| A | 13 | 254 | 10049 | 52.9 | 874 | 857 | 173.8 |
| A | 3 | 137 | 7710 | 39.44 | 874 | 857 | 173.8 |
| A | 0 | 226 | 7382 | 37.55 | 874 | 857 | 173.8 |
| B | 0 | 229 | 35548 | 209.93 | 862 | 842 | 165.3 |
| B | 12 | 111 | 19652 | 113.78 | 862 | 842 | 165.3 |
| B | 11 | 111 | 17999 | 103.78 | 862 | 842 | 165.3 |
| C | 7 | 247 | 582376 | 3006.48 | 831 | 835 | 193.4 |
| C | 14 | 238 | 133252 | 684.58 | 831 | 835 | 193.4 |
| C | 3 | 233 | 21123 | 104.89 | 831 | 835 | 193.4 |
| D | 1 | 52 | 627303 | 3161.78 | 835 | 815 | 198.1 |
| D | 12 | 235 | 354228 | 1783.62 | 835 | 815 | 198.1 |
| D | 8 | 195 | 263396 | 1325.2 | 835 | 815 | 198.1 |
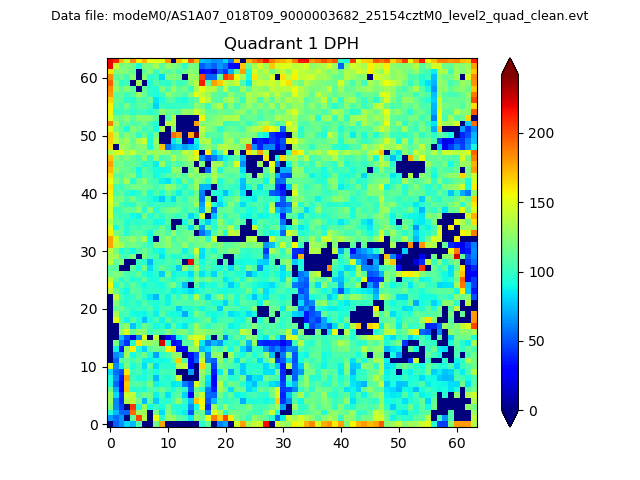
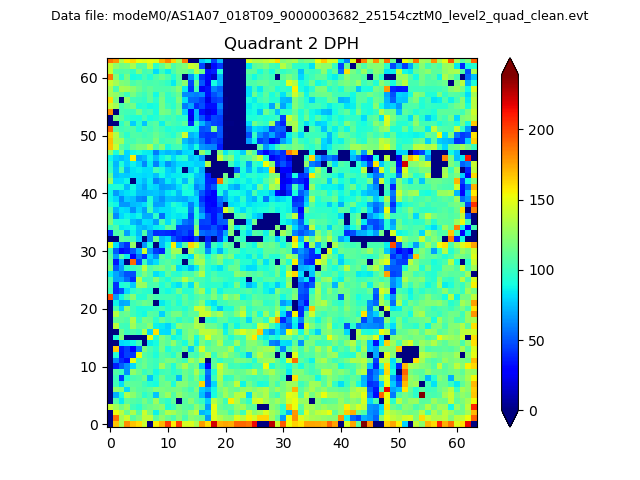
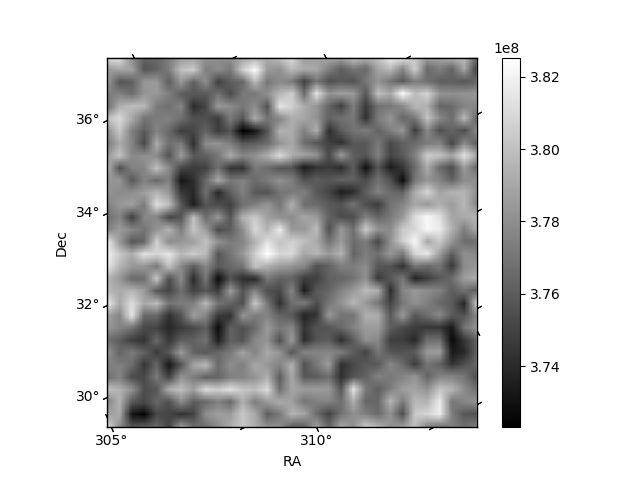
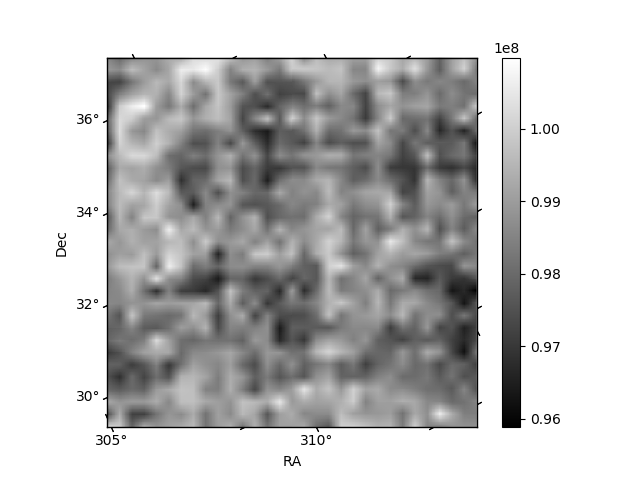
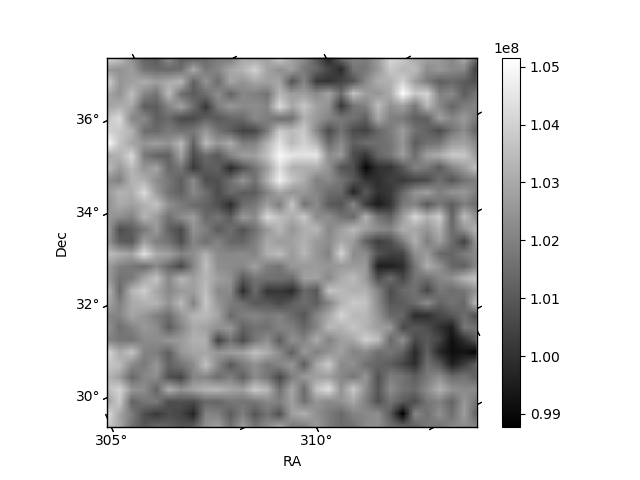
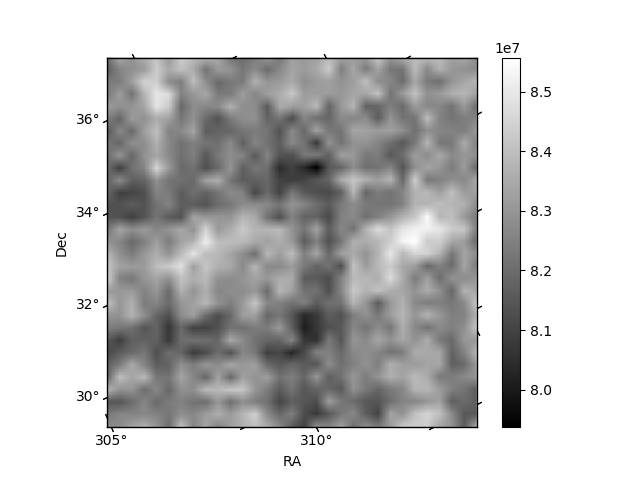
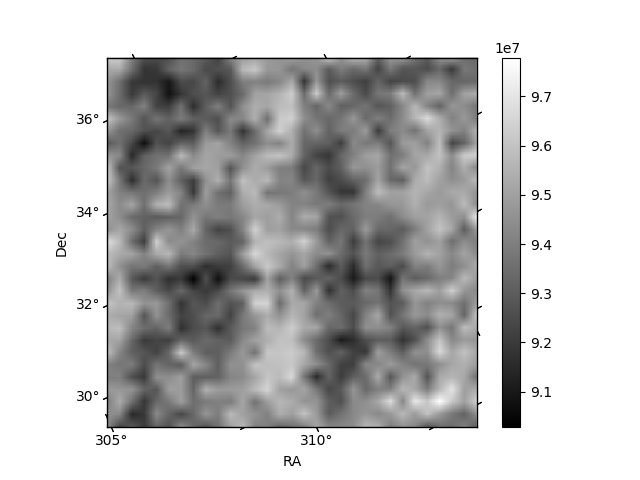
Histogram calculated using DETX and DETY for each event in the final _common_clean file
| Quadrant A |  |
 |
Quadrant B |
|---|---|---|---|
| Quadrant D | 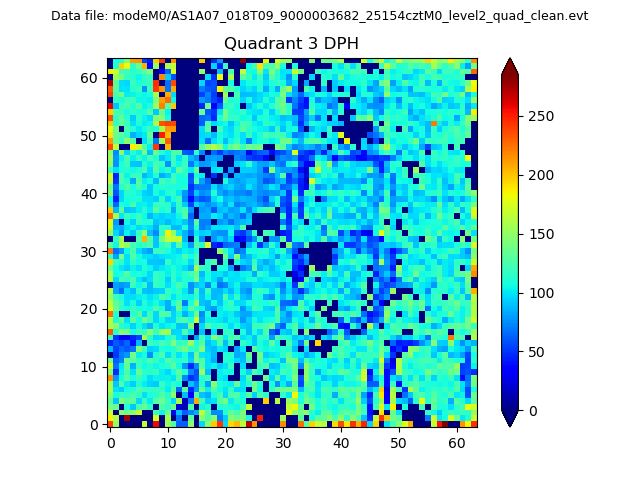 |
 |
Quadrant C |
| Plot type | Count rate plots | Images |
|---|---|---|
| Comparison with Poisson distribution Blue bars denote a histogram of data divided into 1 sec bins. Red curve is a Poisson curve with rate = median count rate of data. |
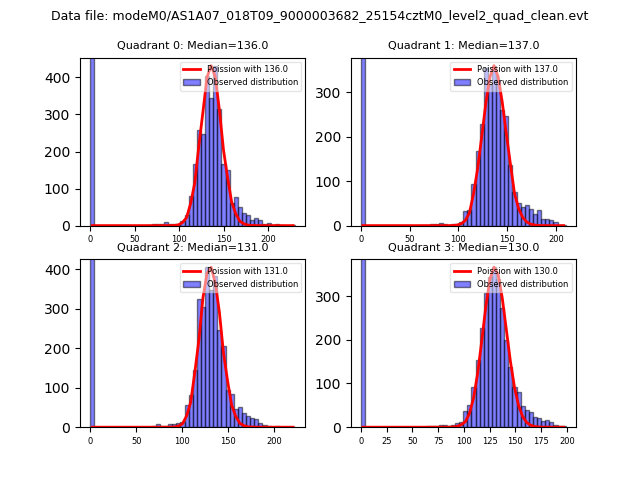 |
 |
| Quadrant-wise count rates Data is divided into 100 sec bins |
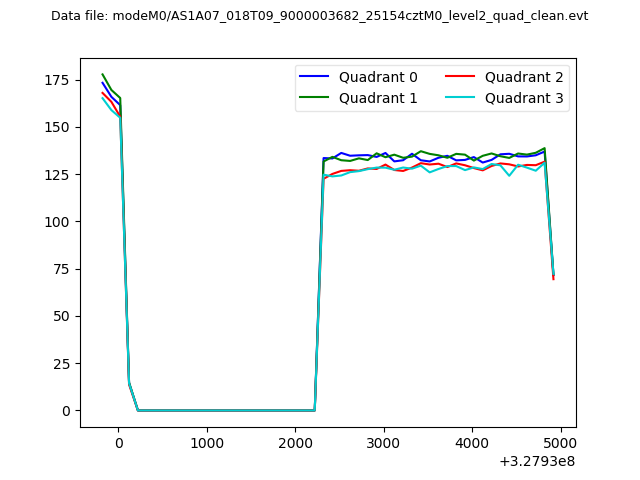 |
|
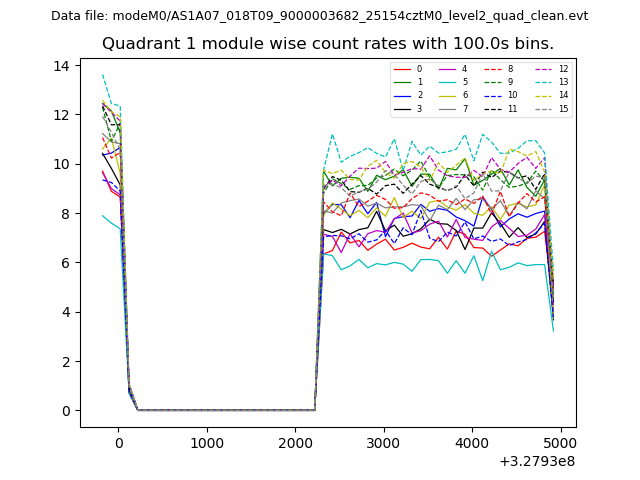
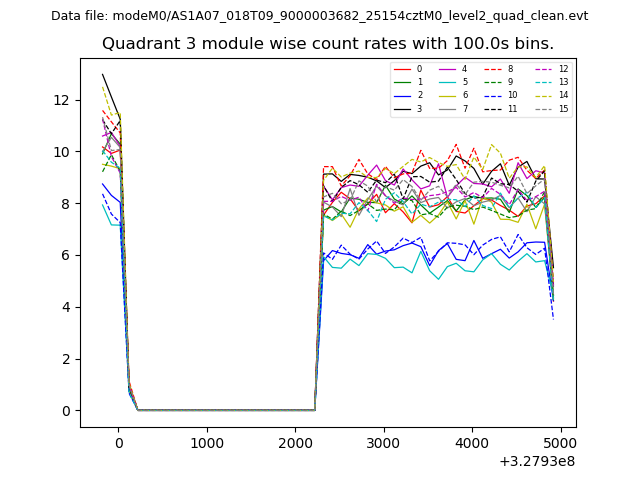
| Module-wise count rates for Quadrant A Data is divided into 100 sec bins |
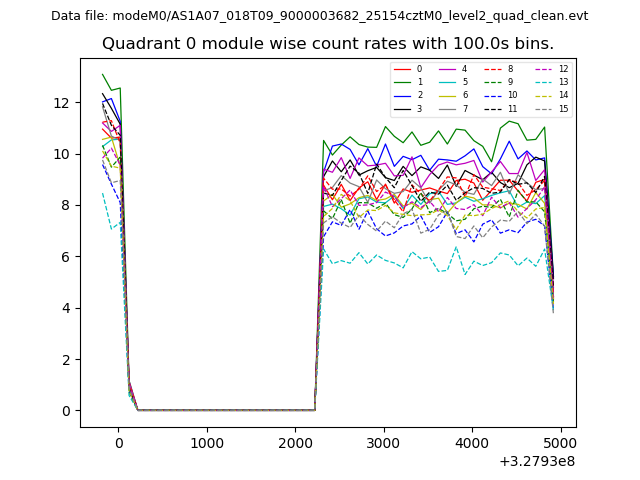 |
 |
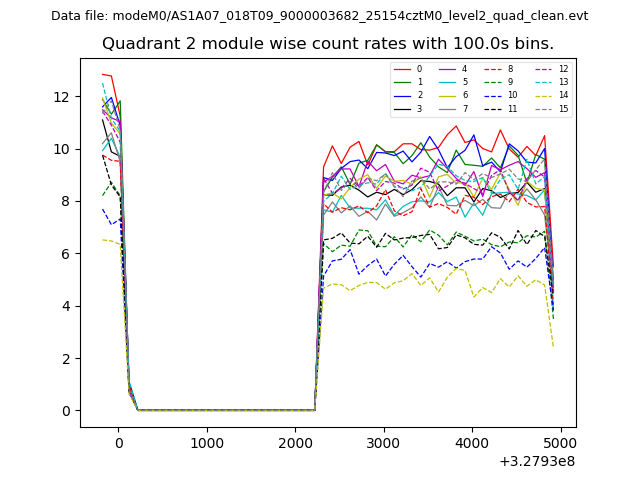
| Module-wise count rates for Quadrant B Data is divided into 100 sec bins |
 |
 |
| Module-wise count rates for Quadrant C Data is divided into 100 sec bins |
 |
 |
| Module-wise count rates for Quadrant D Data is divided into 100 sec bins |
 |
 |
| Parameter | Plot |
|---|---|
| CZT HV Monitor | 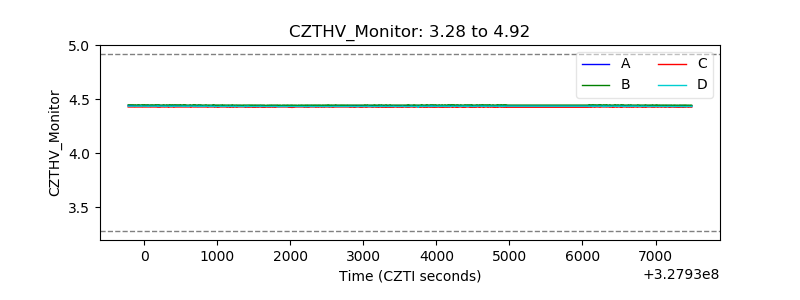 |
| D_VDD | 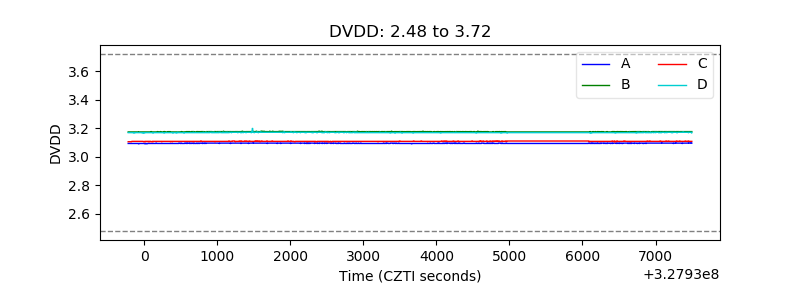 |
| Temperature 1 | 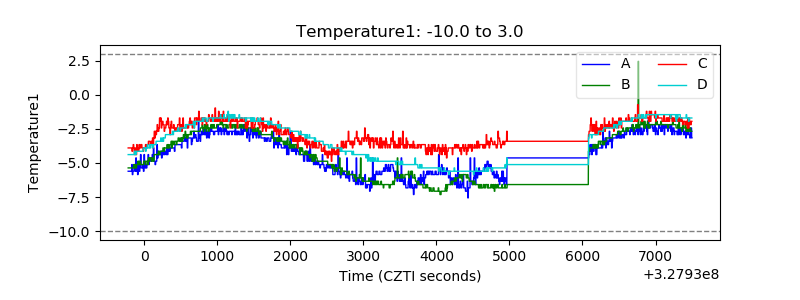 |
| Veto HV Monitor | 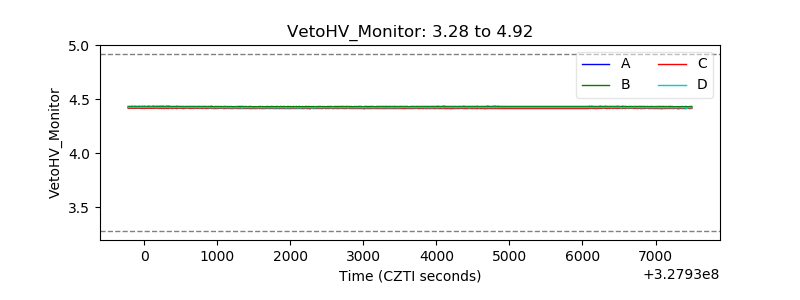 |
| Veto LLD | 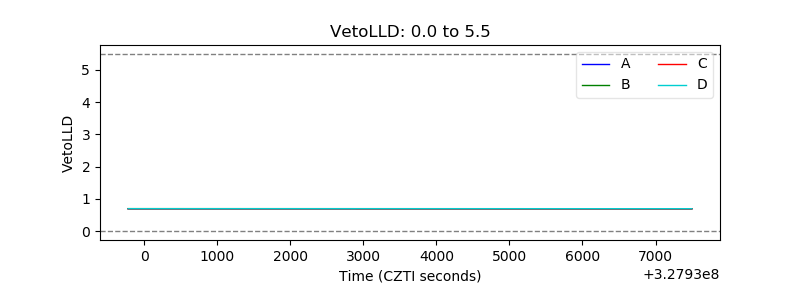 |
| Alpha Counter | 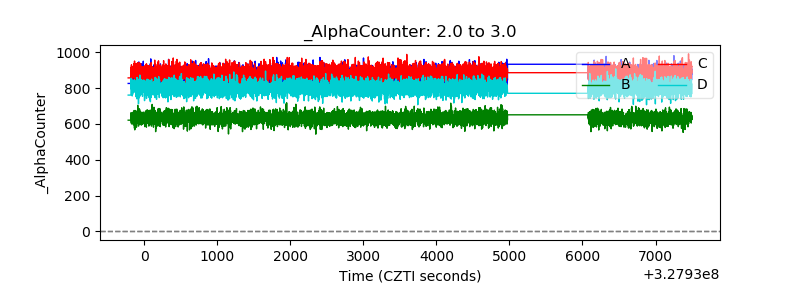 |
| _CPM_Rate | 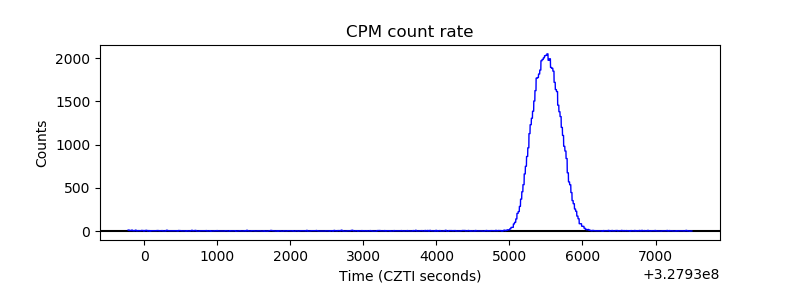 |
| CZT Counter | 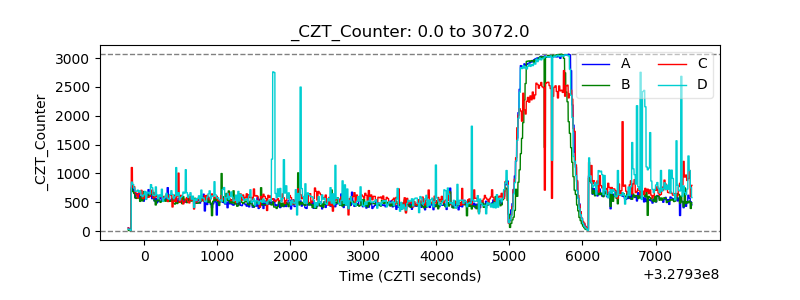 |
| +2.5 Volts monitor |  |
| +5 Volts monitor |  |
| _ROLL_ROT | 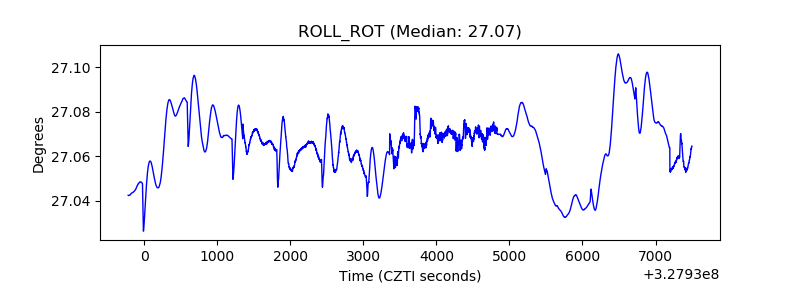 |
| _Roll_DEC | 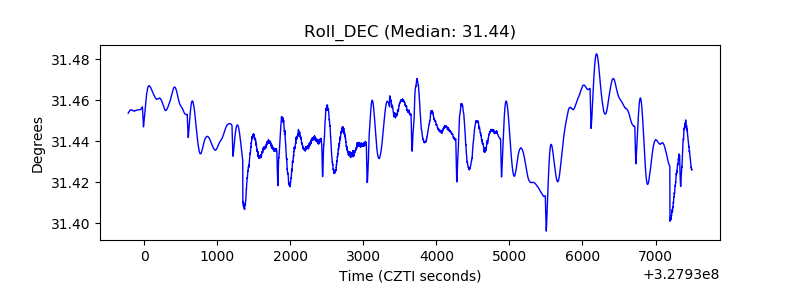 |
| _Roll_RA | 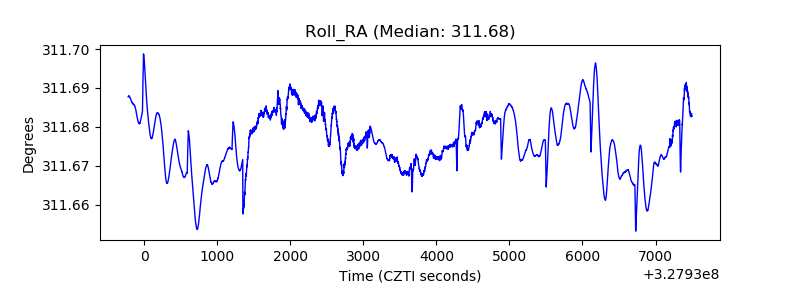 |
| Veto Counter | 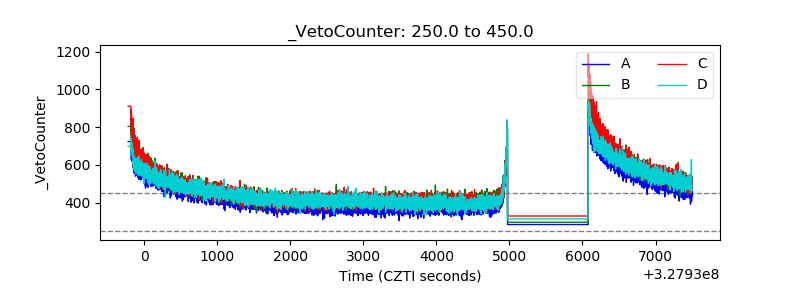 |