| Param | Original file | Final file |
|---|---|---|
| Filename | modeM0/AS1A09_008T05_9000003724_25558cztM0_level2.evt | modeM0/AS1A09_008T05_9000003724_25558cztM0_level2_quad_clean.evt |
| Size (bytes) | 479,995,200 | 93,156,480 |
| Size | 457.8 MB | 88.8 MB |
| Events in quadrant A | 3,272,488 | 607,468 |
| Events in quadrant B | 3,229,363 | 609,193 |
| Events in quadrant C | 3,212,407 | 573,259 |
| Events in quadrant D | 4,367,204 | 563,802 |
| Mode M0 | |||
|---|---|---|---|
| Quadrant | BADHDUFLAG | Total packets | Discarded packets |
| A | 0 | 14055 | 0 |
| B | 0 | 13867 | 0 |
| C | 0 | 13862 | 0 |
| D | 0 | 17592 | 0 |
| Mode M9 | |||
|---|---|---|---|
| Quadrant | BADHDUFLAG | Total packets | Discarded packets |
| A | 0 | 12 | 0 |
| B | 0 | 13 | 0 |
| C | 0 | 13 | 0 |
| D | 0 | 13 | 0 |
| Quadrant | Total seconds | Saturated seconds | Saturation percentage |
|---|---|---|---|
| A | 6705 | 23 | 0.343028% |
| B | 6705 | 29 | 0.432513% |
| C | 6705 | 71 | 1.058911% |
| D | 6705 | 107 | 1.595824% |
Noise dominated data is calculated using 1-second bins in cleaned event files. If a bin has >2000 counts, and if more than 50% of those come from <1% of pixels, then it is considered to be noise-dominated and hence unusable.
| Quadrant | # 1 sec bins | Bins with >0 counts | Bins with >2000 counts | High rate bins dominated by noise | Noise dominated (total time) | Noise dominated (detector-on time) | Marked lightcurve |
|---|---|---|---|---|---|---|---|
| A | 7660 | 6706 | 0 | 0 | 0.00% | 0.00% | 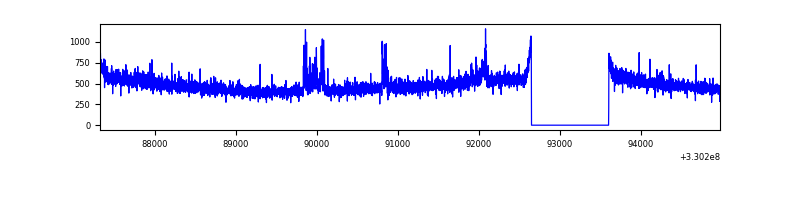 |
| B | 7660 | 6706 | 0 | 0 | 0.00% | 0.00% | 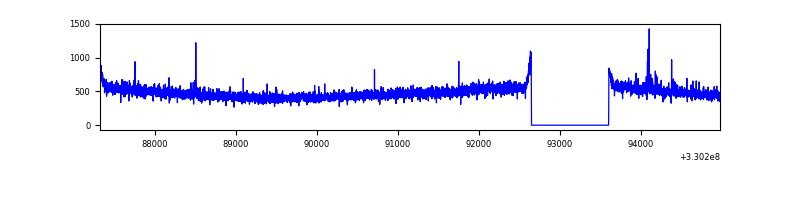 |
| C | 7660 | 6706 | 0 | 0 | 0.00% | 0.00% | 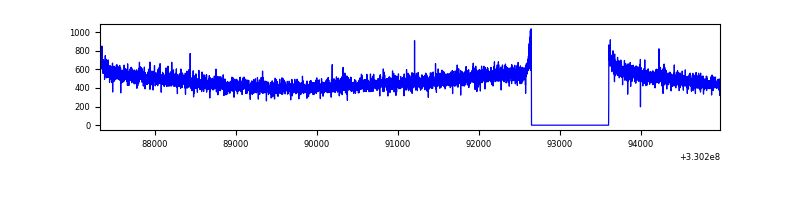 |
| D | 7660 | 6706 | 68 | 68 | 0.89% | 1.01% | 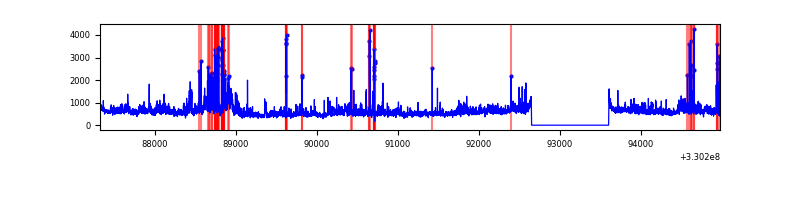 |
Top three noisy pixels from each quadrant. If the there are fewer than three noisy pixels in the level2.evt file, extra rows are filled as -1
| Pixel properties | Quadrant properties | ||||||
|---|---|---|---|---|---|---|---|
| Quadrant | DetID | PixID | Counts | Sigma | Mean | Median | Sigma |
| A | 6 | 16 | 90872 | 542.94 | 825 | 807 | 165.9 |
| A | 13 | 254 | 10200 | 56.62 | 825 | 807 | 165.9 |
| A | 3 | 137 | 7786 | 42.07 | 825 | 807 | 165.9 |
| B | 0 | 190 | 24506 | 150.5 | 817 | 796 | 157.5 |
| B | 12 | 111 | 19373 | 117.92 | 817 | 796 | 157.5 |
| B | 11 | 111 | 17424 | 105.55 | 817 | 796 | 157.5 |
| C | 14 | 238 | 125588 | 669.67 | 790 | 794 | 186.4 |
| C | 2 | 16 | 5434 | 24.9 | 790 | 794 | 186.4 |
| C | 13 | 61 | 5338 | 24.38 | 790 | 794 | 186.4 |
| D | 8 | 195 | 727103 | 3771.75 | 797 | 774 | 192.6 |
| D | 1 | 52 | 460607 | 2387.87 | 797 | 774 | 192.6 |
| D | 2 | 244 | 99469 | 512.51 | 797 | 774 | 192.6 |
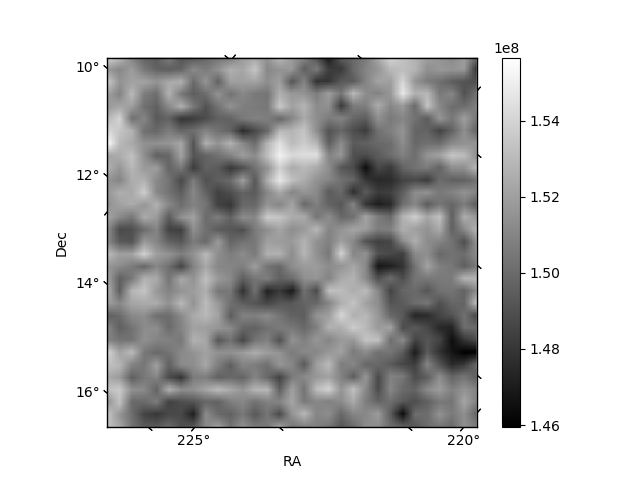
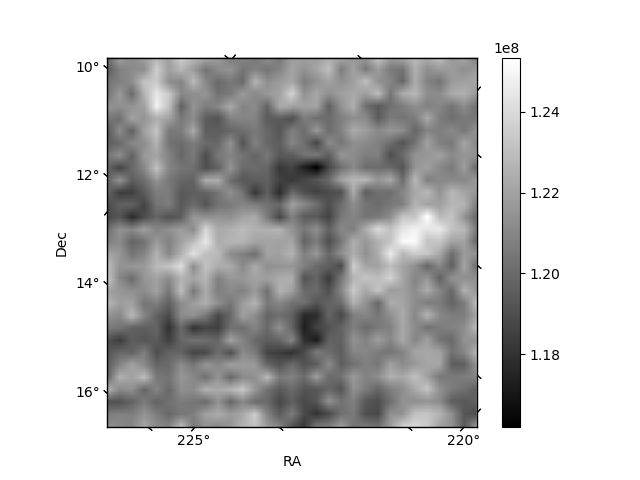
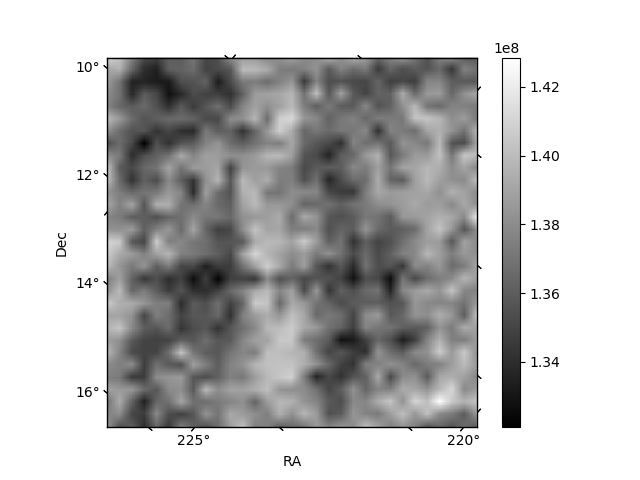
Histogram calculated using DETX and DETY for each event in the final _common_clean file
| Quadrant A | 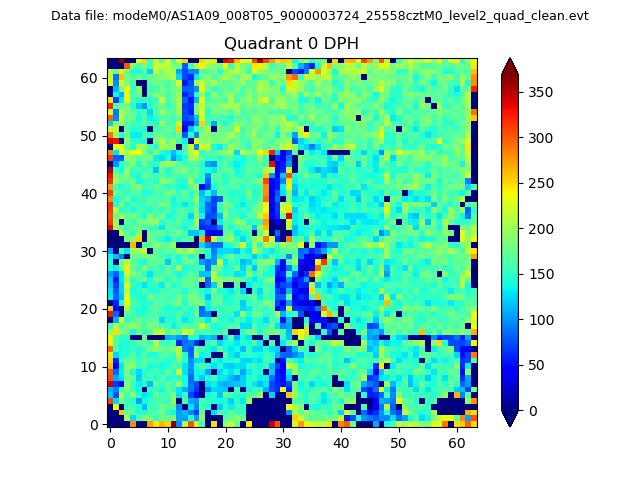 |
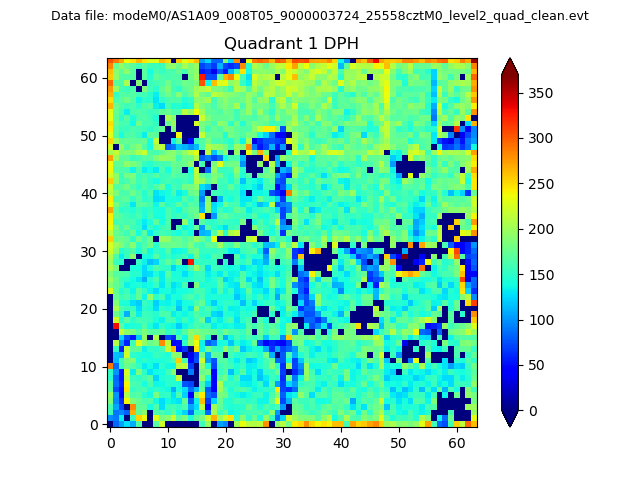 |
Quadrant B |
|---|---|---|---|
| Quadrant D | 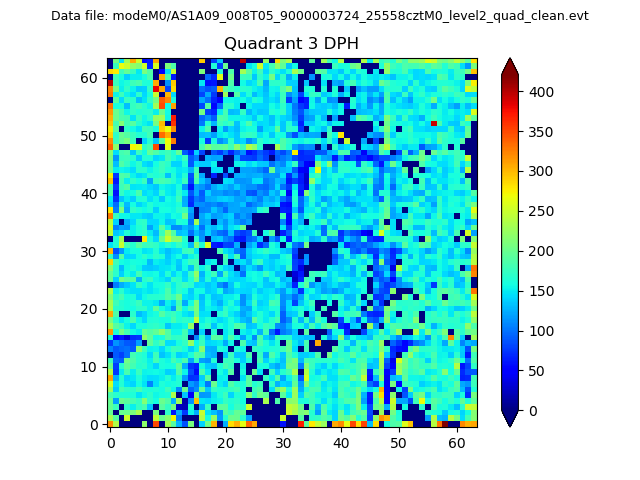 |
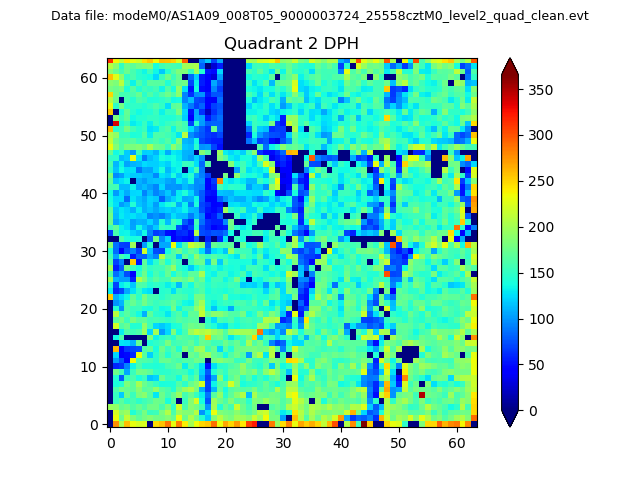 |
Quadrant C |
| Plot type | Count rate plots | Images |
|---|---|---|
| Comparison with Poisson distribution Blue bars denote a histogram of data divided into 1 sec bins. Red curve is a Poisson curve with rate = median count rate of data. |
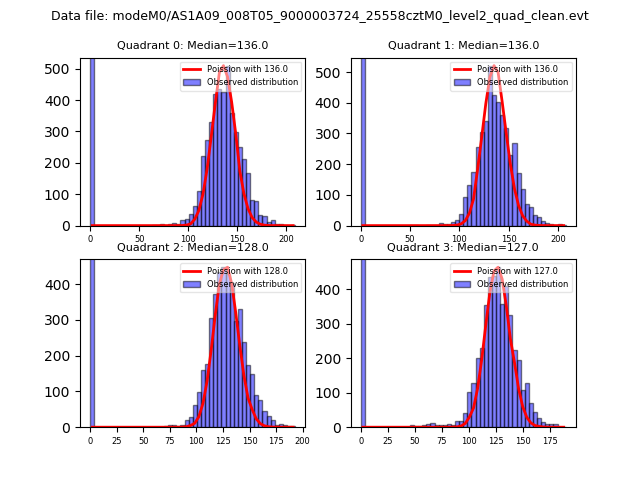 |
 |
| Quadrant-wise count rates Data is divided into 100 sec bins |
 |
|
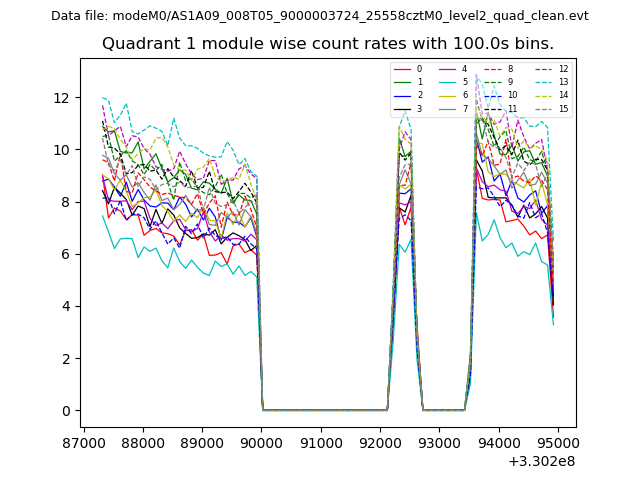
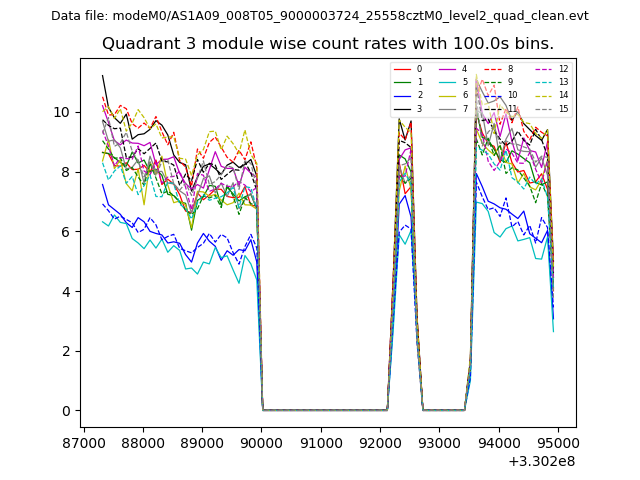
| Module-wise count rates for Quadrant A Data is divided into 100 sec bins |
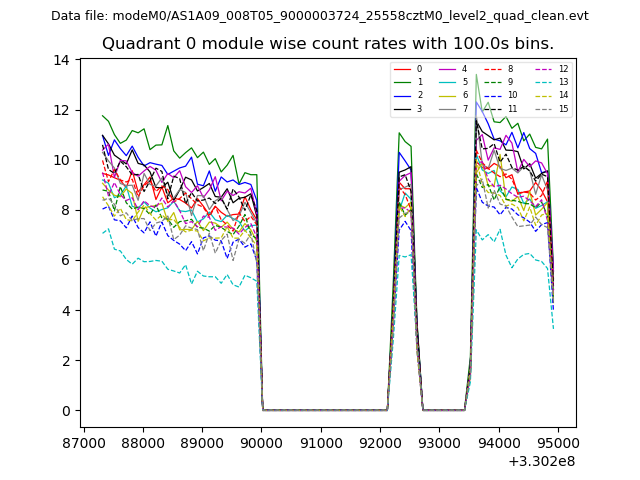 |
 |
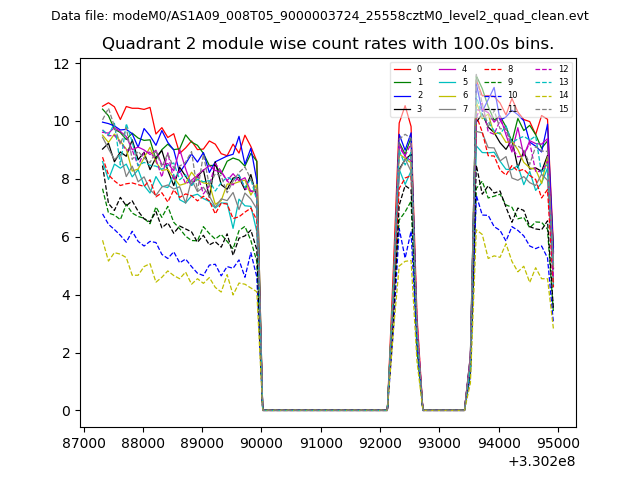
| Module-wise count rates for Quadrant B Data is divided into 100 sec bins |
 |
 |
| Module-wise count rates for Quadrant C Data is divided into 100 sec bins |
 |
 |
| Module-wise count rates for Quadrant D Data is divided into 100 sec bins |
 |
 |
| Parameter | Plot |
|---|---|
| CZT HV Monitor | 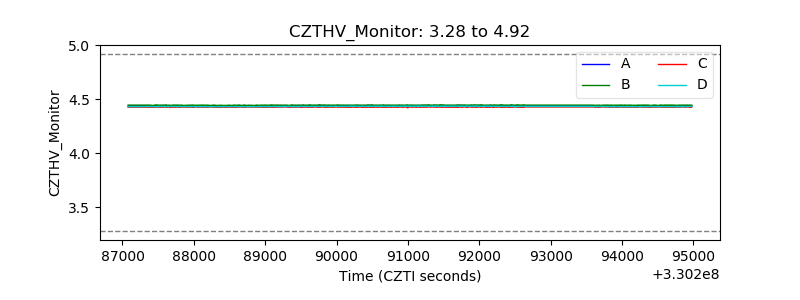 |
| D_VDD | 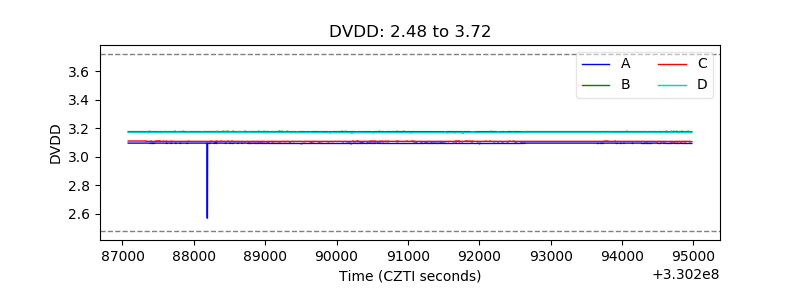 |
| Temperature 1 | 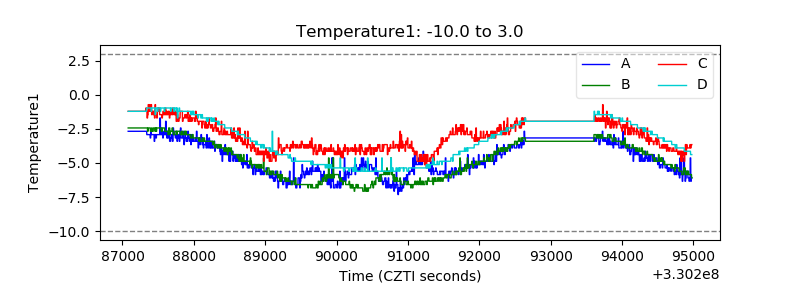 |
| Veto HV Monitor | 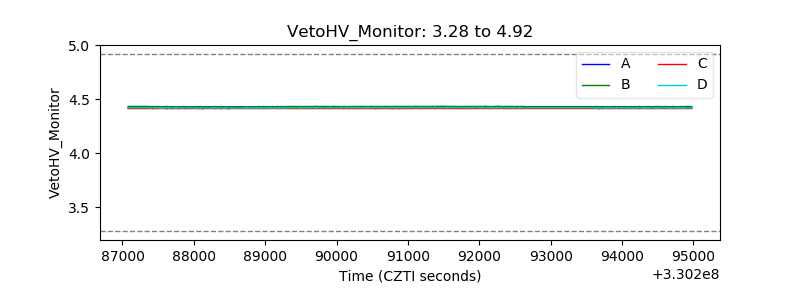 |
| Veto LLD |  |
| Alpha Counter |  |
| _CPM_Rate | 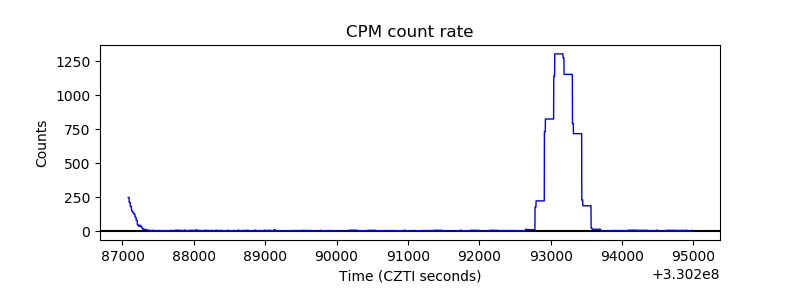 |
| CZT Counter |  |
| +2.5 Volts monitor |  |
| +5 Volts monitor |  |
| _ROLL_ROT | 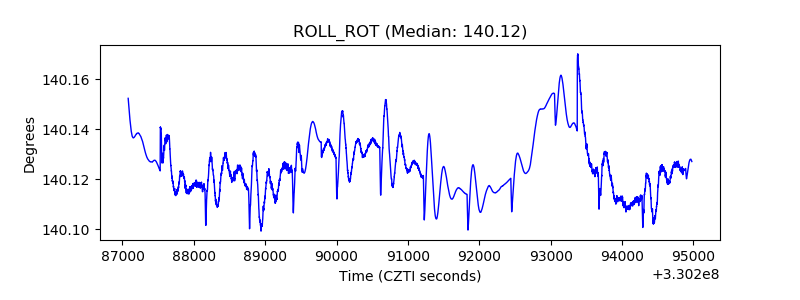 |
| _Roll_DEC | 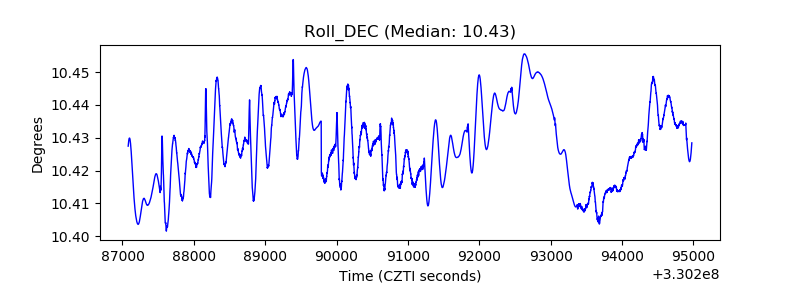 |
| _Roll_RA | 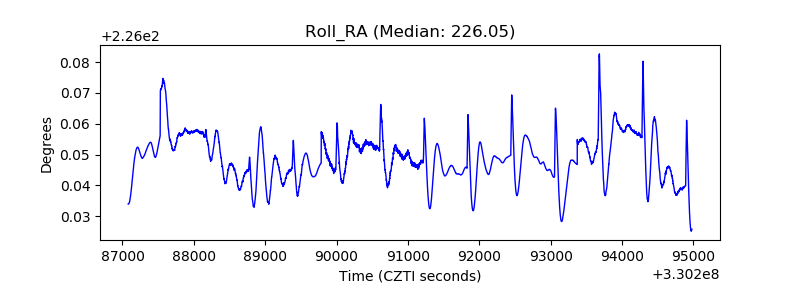 |
| Veto Counter | 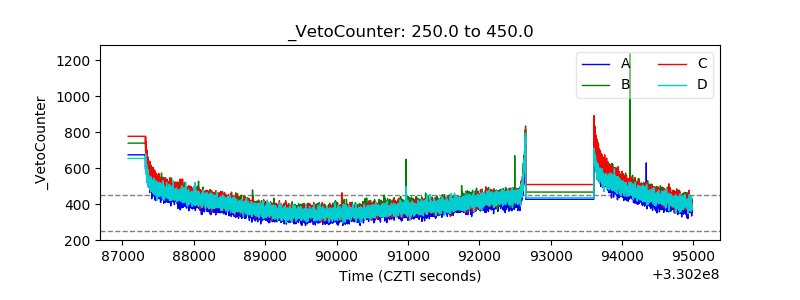 |