| Param | Original file | Final file |
|---|---|---|
| Filename | modeM0/AS1A09_013T02_9000003734_25649cztM0_level2.evt | modeM0/AS1A09_013T02_9000003734_25649cztM0_level2_quad_clean.evt |
| Size (bytes) | 482,336,640 | 107,357,760 |
| Size | 460.0 MB | 102.4 MB |
| Events in quadrant A | 3,195,851 | 717,476 |
| Events in quadrant B | 3,210,563 | 747,311 |
| Events in quadrant C | 3,175,889 | 705,946 |
| Events in quadrant D | 4,607,365 | 650,905 |
| Mode M9 | |||
|---|---|---|---|
| Quadrant | BADHDUFLAG | Total packets | Discarded packets |
| A | 0 | 19 | 0 |
| B | 0 | 20 | 0 |
| C | 0 | 20 | 0 |
| D | 0 | 20 | 0 |
| Mode M0 | |||
|---|---|---|---|
| Quadrant | BADHDUFLAG | Total packets | Discarded packets |
| A | 0 | 13198 | 0 |
| B | 0 | 13299 | 0 |
| C | 0 | 13232 | 0 |
| D | 0 | 17751 | 0 |
| Quadrant | Total seconds | Saturated seconds | Saturation percentage |
|---|---|---|---|
| A | 6153 | 17 | 0.276288% |
| B | 6153 | 25 | 0.406306% |
| C | 6153 | 58 | 0.942630% |
| D | 6152 | 512 | 8.322497% |
Noise dominated data is calculated using 1-second bins in cleaned event files. If a bin has >2000 counts, and if more than 50% of those come from <1% of pixels, then it is considered to be noise-dominated and hence unusable.
| Quadrant | # 1 sec bins | Bins with >0 counts | Bins with >2000 counts | High rate bins dominated by noise | Noise dominated (total time) | Noise dominated (detector-on time) | Marked lightcurve |
|---|---|---|---|---|---|---|---|
| A | 7568 | 6155 | 0 | 0 | 0.00% | 0.00% | 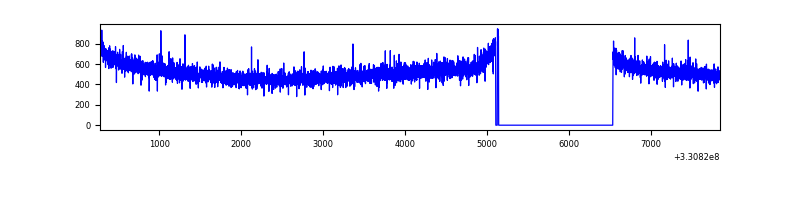 |
| B | 7568 | 6155 | 0 | 0 | 0.00% | 0.00% | 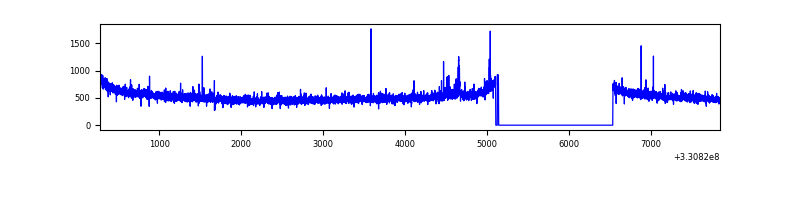 |
| C | 7568 | 6155 | 0 | 0 | 0.00% | 0.00% | 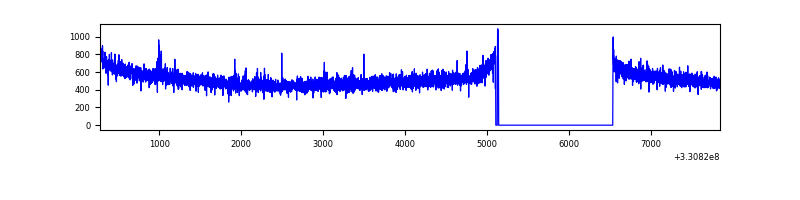 |
| D | 7567 | 6154 | 396 | 396 | 5.23% | 6.43% | 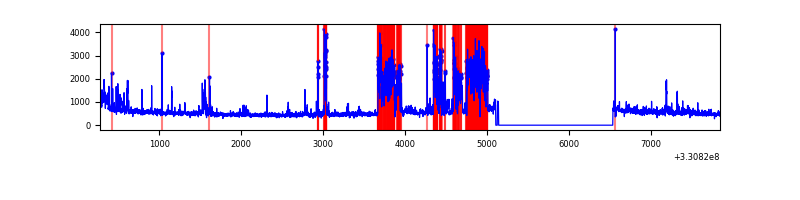 |
Top three noisy pixels from each quadrant. If the there are fewer than three noisy pixels in the level2.evt file, extra rows are filled as -1
| Pixel properties | Quadrant properties | ||||||
|---|---|---|---|---|---|---|---|
| Quadrant | DetID | PixID | Counts | Sigma | Mean | Median | Sigma |
| A | 8 | 192 | 124960 | 792.16 | 797 | 784 | 156.8 |
| A | 13 | 254 | 9055 | 52.76 | 797 | 784 | 156.8 |
| A | 3 | 137 | 6748 | 38.05 | 797 | 784 | 156.8 |
| B | 0 | 190 | 18089 | 118.91 | 806 | 789 | 145.5 |
| B | 12 | 111 | 17550 | 115.21 | 806 | 789 | 145.5 |
| B | 11 | 111 | 15314 | 99.84 | 806 | 789 | 145.5 |
| C | 14 | 238 | 127190 | 705.37 | 776 | 782 | 179.2 |
| C | 3 | 233 | 23638 | 127.54 | 776 | 782 | 179.2 |
| C | 13 | 61 | 5434 | 25.96 | 776 | 782 | 179.2 |
| D | 1 | 52 | 1523714 | 7731.96 | 739 | 725 | 197.0 |
| D | 8 | 195 | 235314 | 1190.97 | 739 | 725 | 197.0 |
| D | 2 | 244 | 25297 | 124.75 | 739 | 725 | 197.0 |
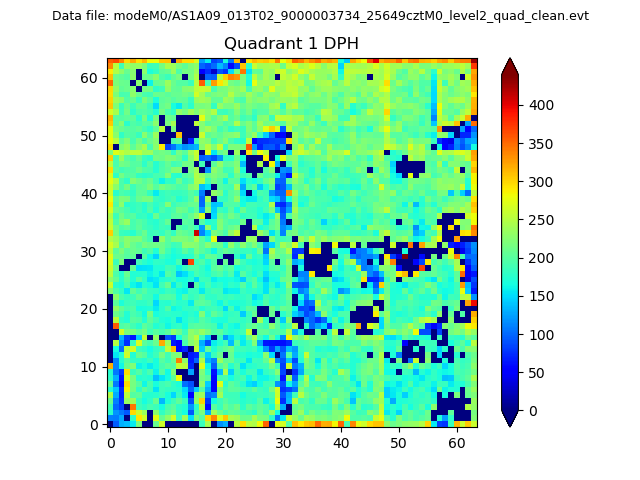
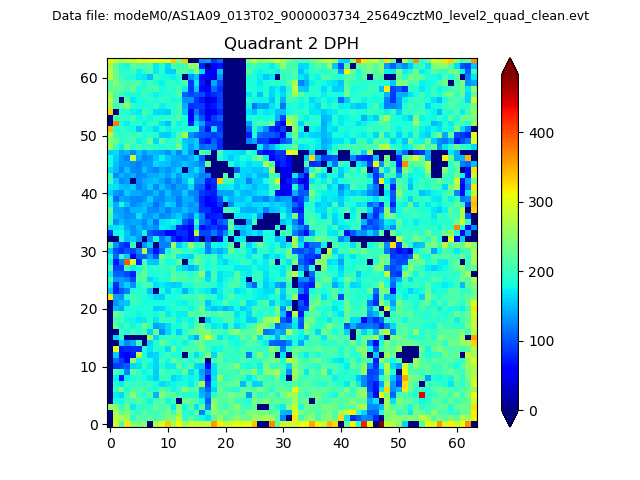
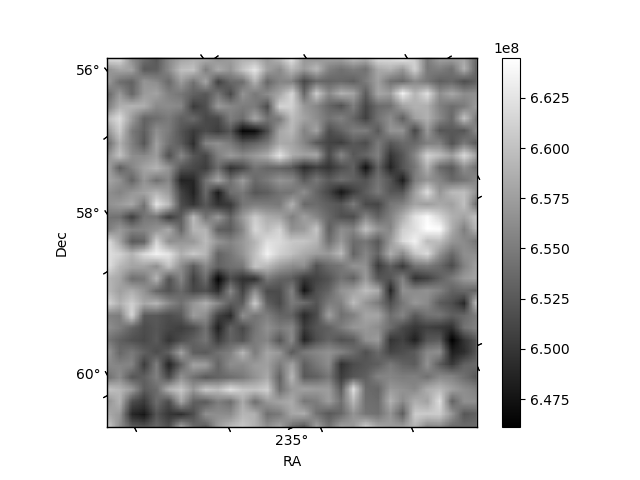
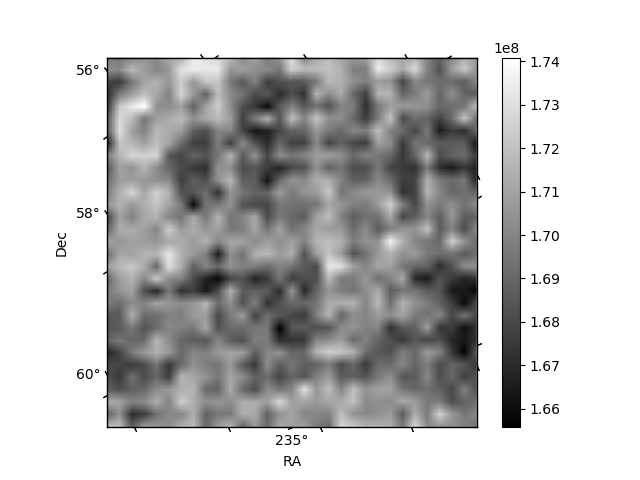
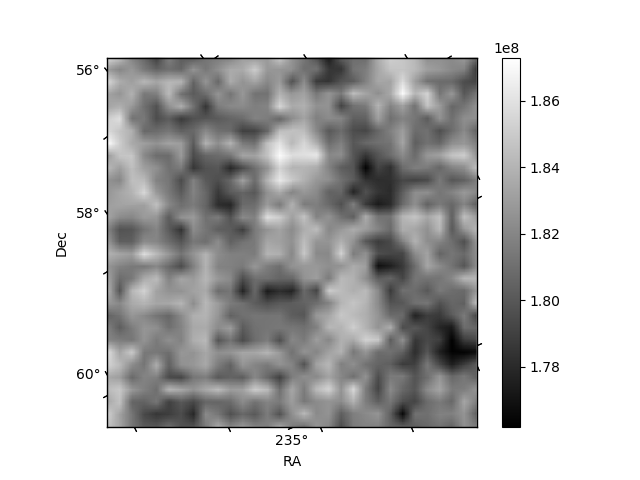
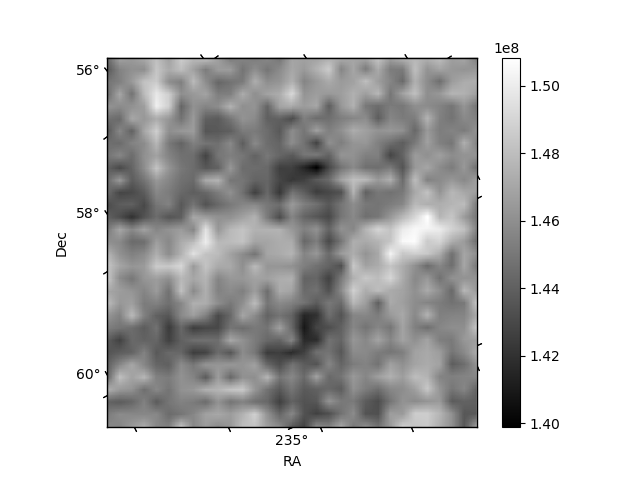
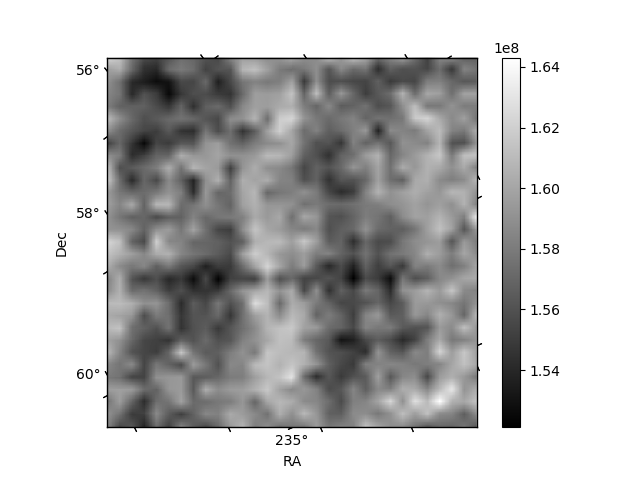
Histogram calculated using DETX and DETY for each event in the final _common_clean file
| Quadrant A |  |
 |
Quadrant B |
|---|---|---|---|
| Quadrant D | 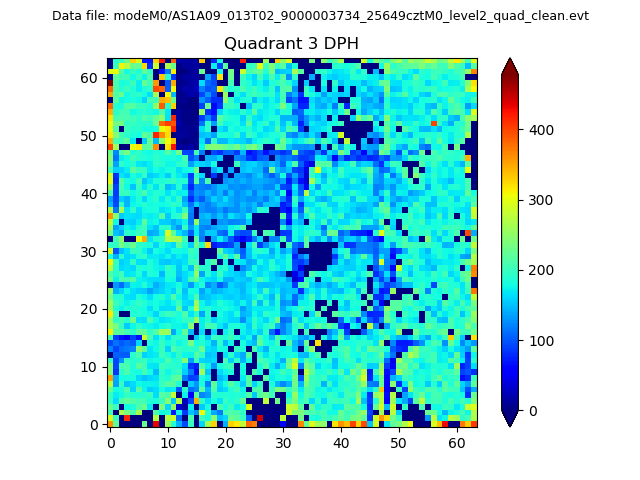 |
 |
Quadrant C |
| Plot type | Count rate plots | Images |
|---|---|---|
| Comparison with Poisson distribution Blue bars denote a histogram of data divided into 1 sec bins. Red curve is a Poisson curve with rate = median count rate of data. |
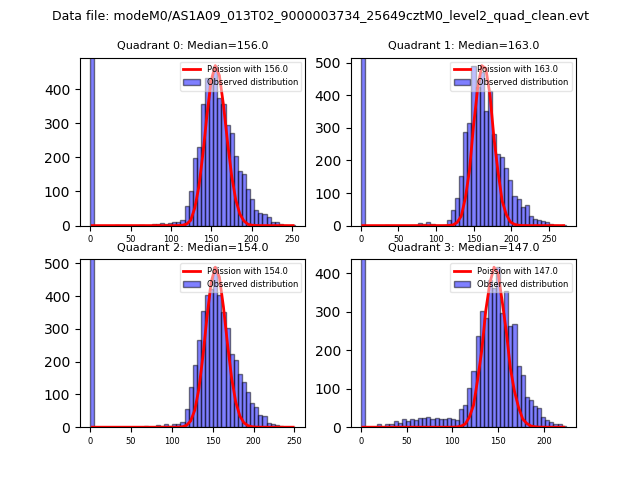 |
 |
| Quadrant-wise count rates Data is divided into 100 sec bins |
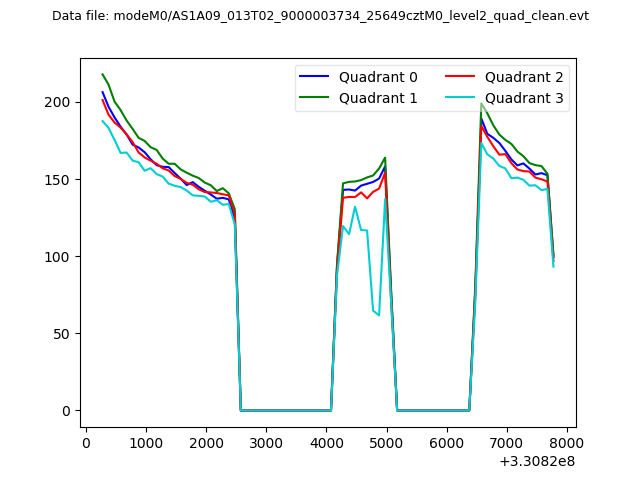 |
|
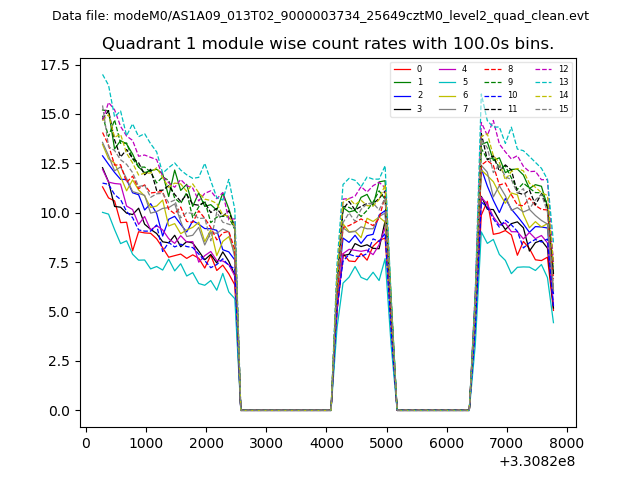
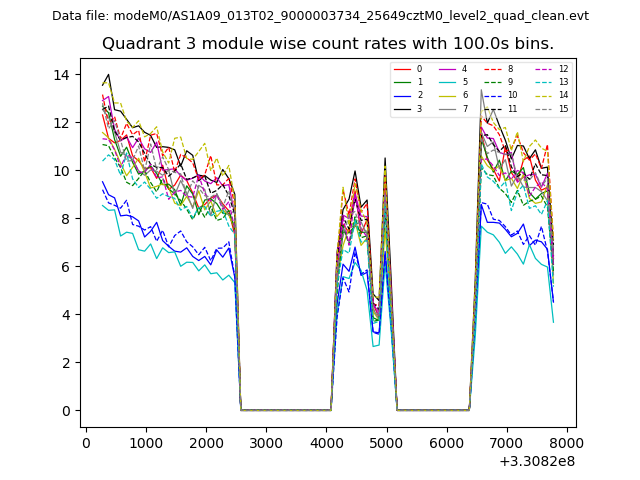
| Module-wise count rates for Quadrant A Data is divided into 100 sec bins |
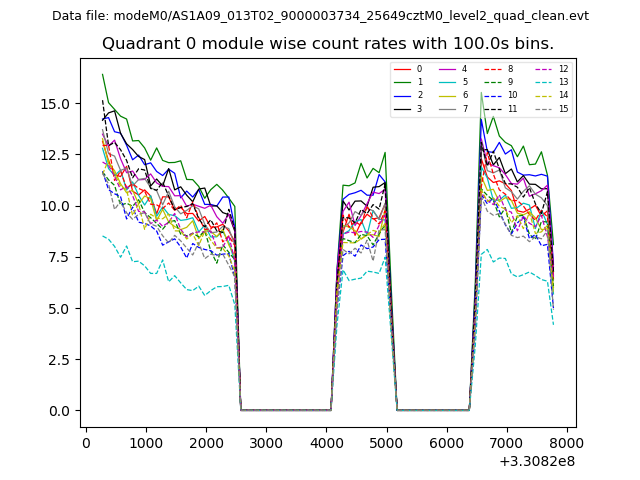 |
 |
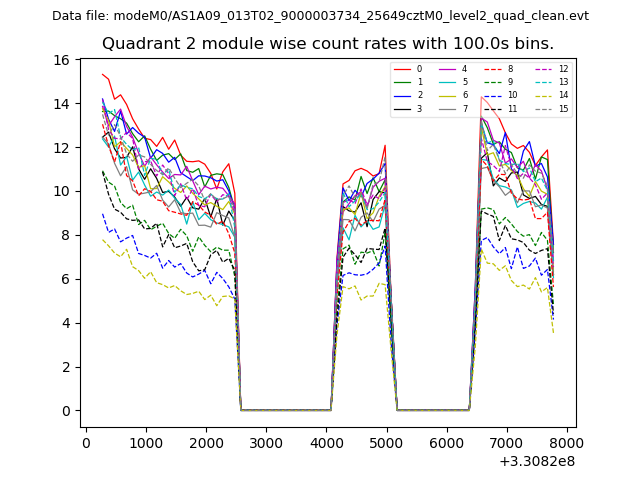
| Module-wise count rates for Quadrant B Data is divided into 100 sec bins |
 |
 |
| Module-wise count rates for Quadrant C Data is divided into 100 sec bins |
 |
 |
| Module-wise count rates for Quadrant D Data is divided into 100 sec bins |
 |
 |
| Parameter | Plot |
|---|---|
| CZT HV Monitor | 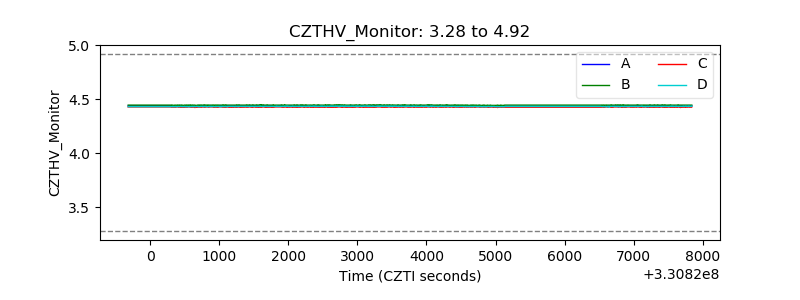 |
| D_VDD | 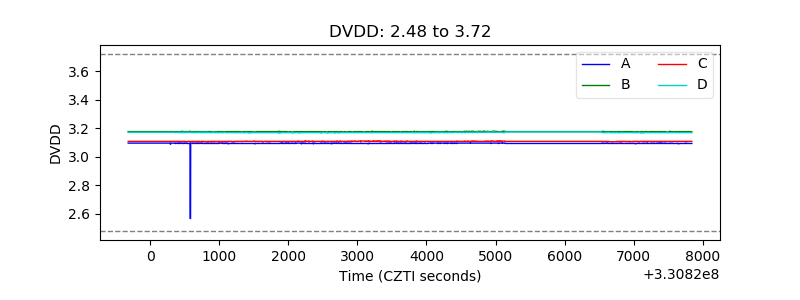 |
| Temperature 1 | 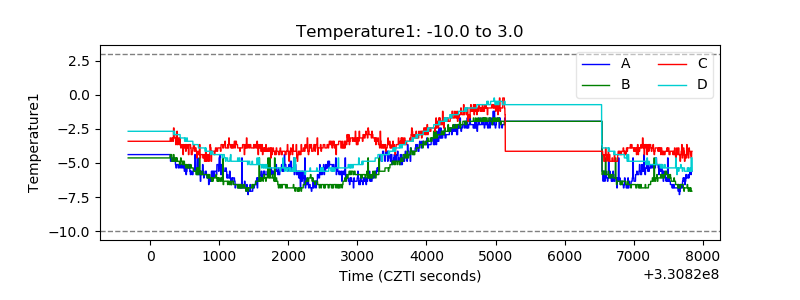 |
| Veto HV Monitor | 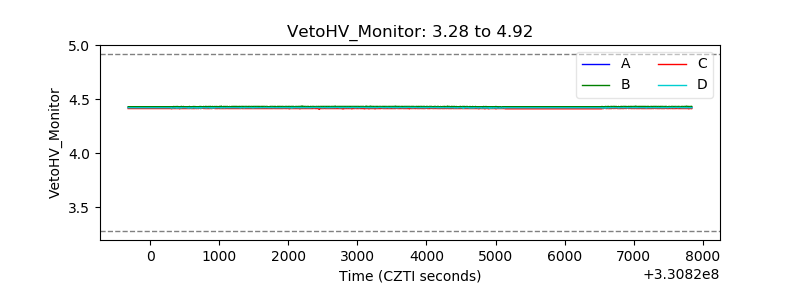 |
| Veto LLD | 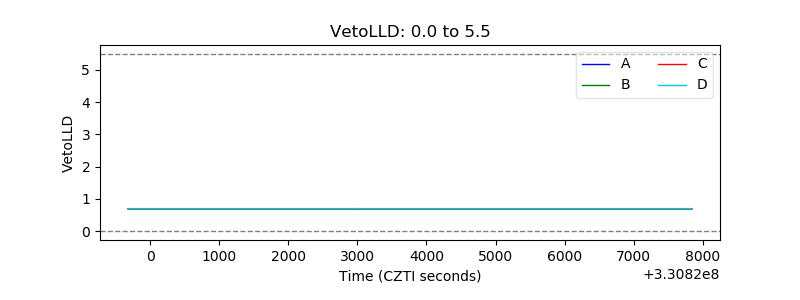 |
| Alpha Counter |  |
| _CPM_Rate | 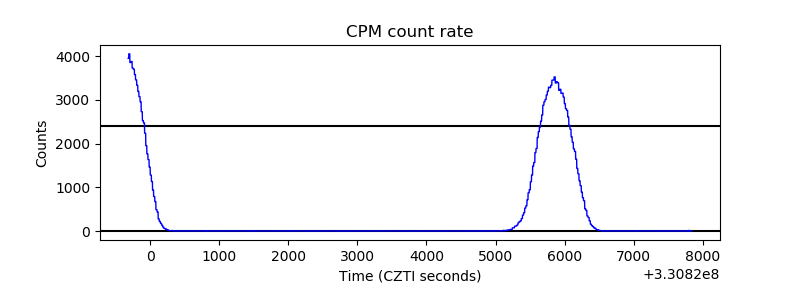 |
| CZT Counter | 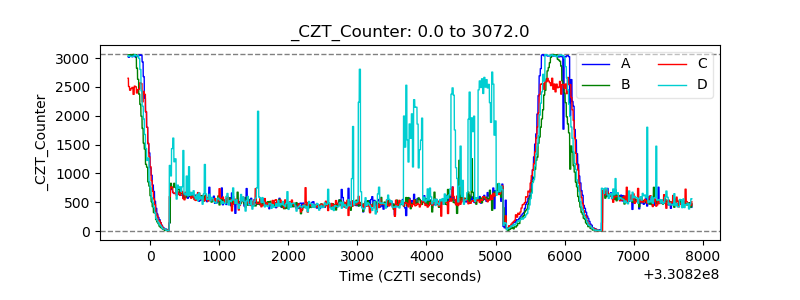 |
| +2.5 Volts monitor |  |
| +5 Volts monitor |  |
| _ROLL_ROT | 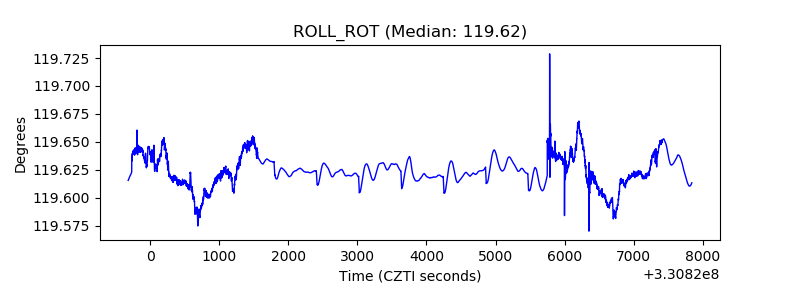 |
| _Roll_DEC | 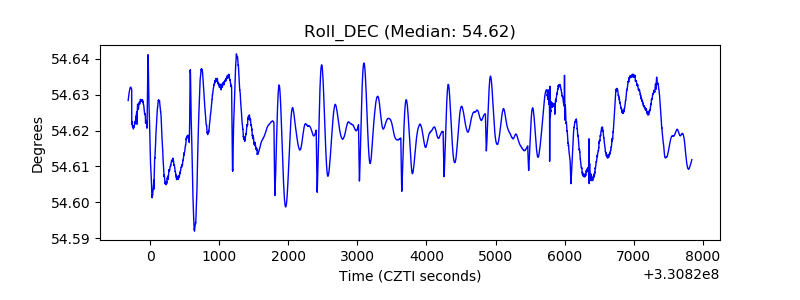 |
| _Roll_RA | 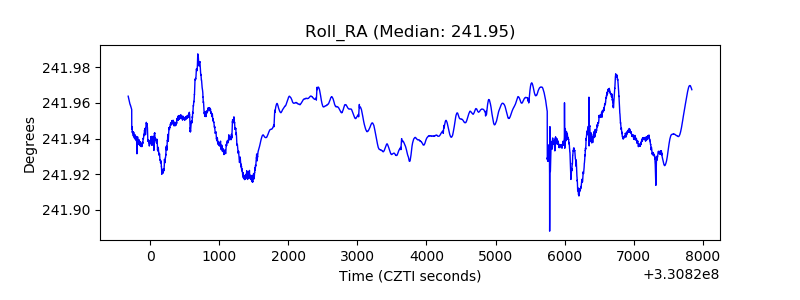 |
| Veto Counter | 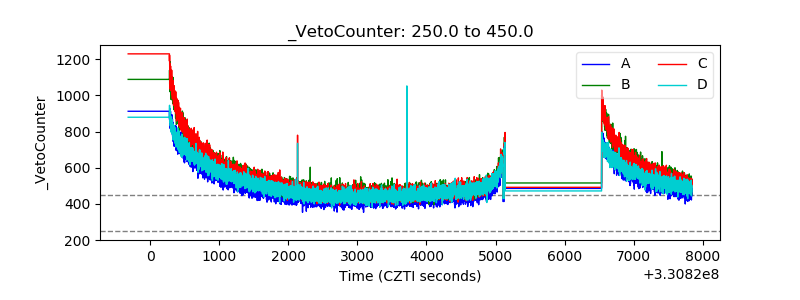 |