| Param | Original file | Final file |
|---|---|---|
| Filename | modeM0/AS1A09_013T02_9000003734_25654cztM0_level2.evt | modeM0/AS1A09_013T02_9000003734_25654cztM0_level2_quad_clean.evt |
| Size (bytes) | 589,573,440 | 86,950,080 |
| Size | 562.3 MB | 82.9 MB |
| Events in quadrant A | 3,675,450 | 541,179 |
| Events in quadrant B | 3,571,794 | 547,054 |
| Events in quadrant C | 3,589,725 | 522,588 |
| Events in quadrant D | 6,506,017 | 496,670 |
| Mode M0 | |||
|---|---|---|---|
| Quadrant | BADHDUFLAG | Total packets | Discarded packets |
| A | 0 | 15591 | 0 |
| B | 0 | 15510 | 0 |
| C | 0 | 15568 | 0 |
| D | 0 | 24386 | 0 |
| Quadrant | Total seconds | Saturated seconds | Saturation percentage |
|---|---|---|---|
| A | 7542 | 277 | 3.672766% |
| B | 7543 | 304 | 4.030227% |
| C | 7543 | 290 | 3.844624% |
| D | 7543 | 911 | 12.077423% |
Noise dominated data is calculated using 1-second bins in cleaned event files. If a bin has >2000 counts, and if more than 50% of those come from <1% of pixels, then it is considered to be noise-dominated and hence unusable.
| Quadrant | # 1 sec bins | Bins with >0 counts | Bins with >2000 counts | High rate bins dominated by noise | Noise dominated (total time) | Noise dominated (detector-on time) | Marked lightcurve |
|---|---|---|---|---|---|---|---|
| A | 7587 | 7543 | 0 | 0 | 0.00% | 0.00% | 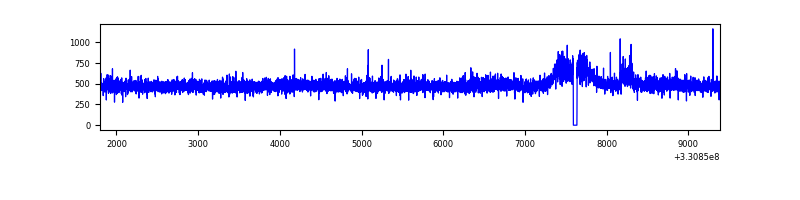 |
| B | 7588 | 7543 | 0 | 0 | 0.00% | 0.00% | 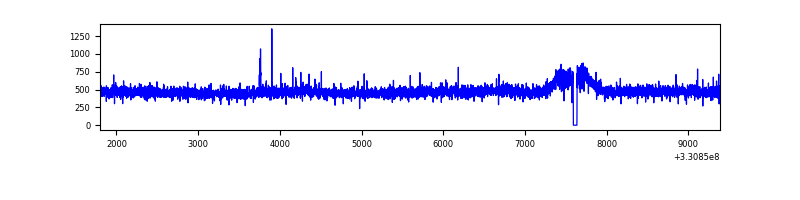 |
| C | 7588 | 7544 | 0 | 0 | 0.00% | 0.00% | 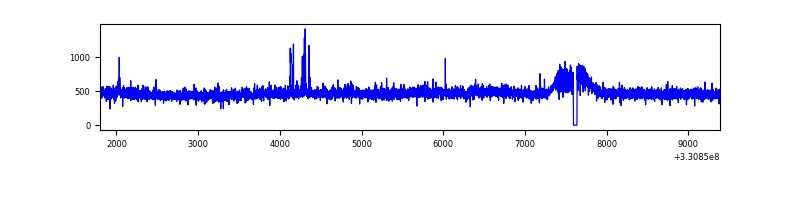 |
| D | 7588 | 7544 | 640 | 640 | 8.43% | 8.48% | 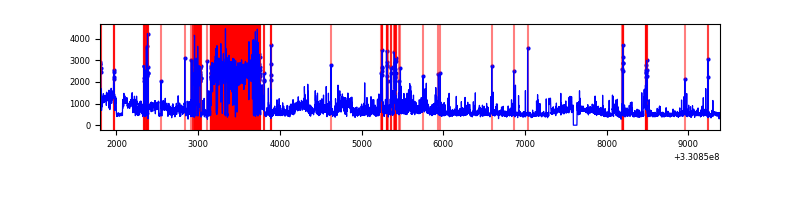 |
Top three noisy pixels from each quadrant. If the there are fewer than three noisy pixels in the level2.evt file, extra rows are filled as -1
| Pixel properties | Quadrant properties | ||||||
|---|---|---|---|---|---|---|---|
| Quadrant | DetID | PixID | Counts | Sigma | Mean | Median | Sigma |
| A | 8 | 192 | 183622 | 998.27 | 905 | 882 | 183.1 |
| A | 13 | 254 | 10840 | 54.4 | 905 | 882 | 183.1 |
| A | 3 | 137 | 8718 | 42.81 | 905 | 882 | 183.1 |
| B | 12 | 111 | 21892 | 121.03 | 902 | 877 | 173.6 |
| B | 11 | 111 | 19929 | 109.73 | 902 | 877 | 173.6 |
| B | 0 | 245 | 18951 | 104.09 | 902 | 877 | 173.6 |
| C | 14 | 238 | 139006 | 676.68 | 867 | 869 | 204.1 |
| C | 3 | 233 | 67964 | 328.67 | 867 | 869 | 204.1 |
| C | 13 | 61 | 6096 | 25.61 | 867 | 869 | 204.1 |
| D | 1 | 52 | 2360838 | 10766.41 | 846 | 822 | 219.2 |
| D | 8 | 195 | 555295 | 2529.51 | 846 | 822 | 219.2 |
| D | 2 | 244 | 170198 | 772.69 | 846 | 822 | 219.2 |
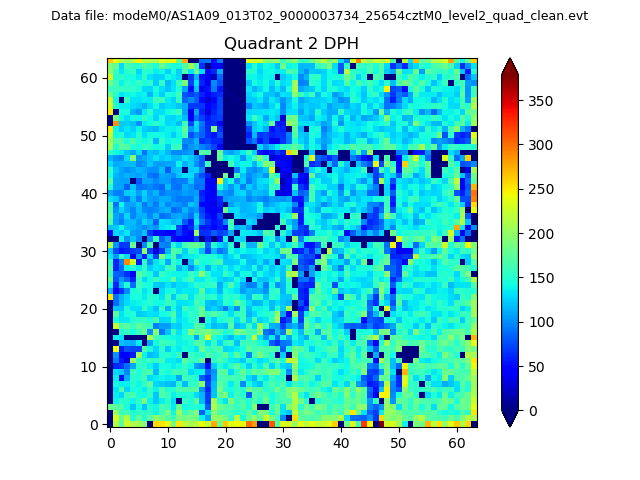
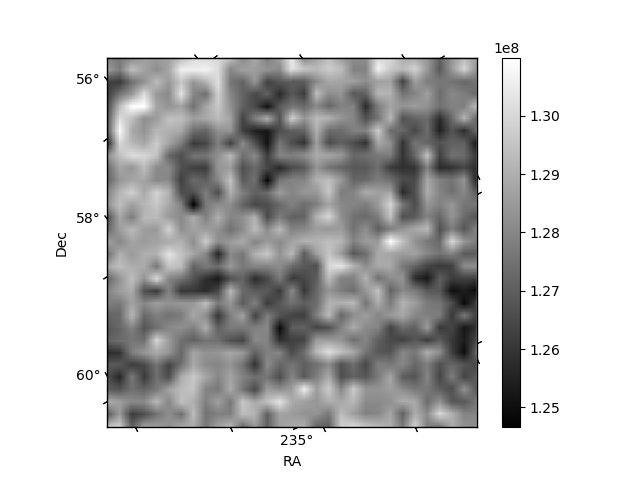
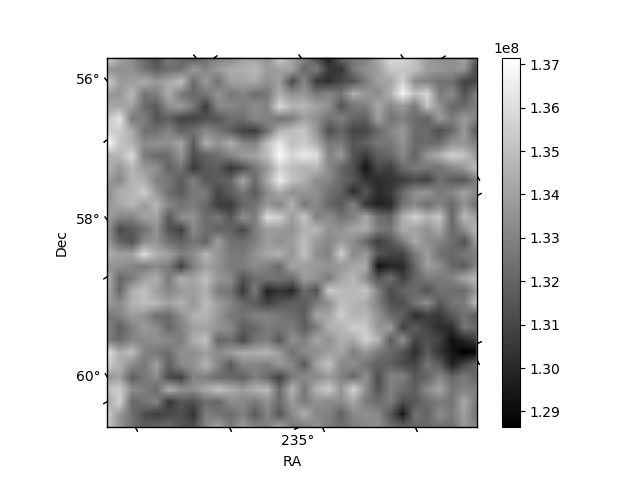
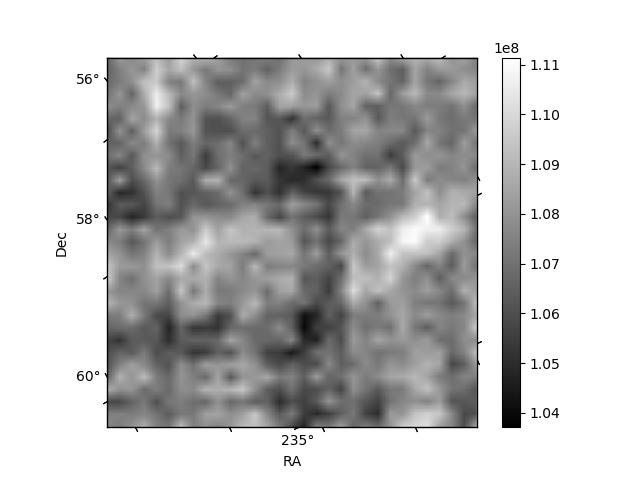
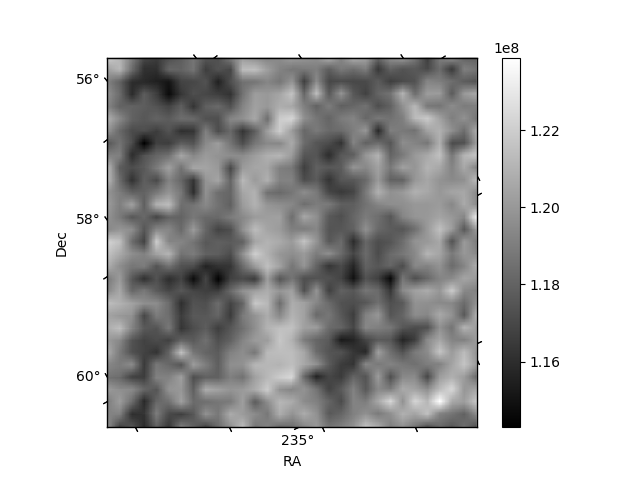
Histogram calculated using DETX and DETY for each event in the final _common_clean file
| Quadrant A | 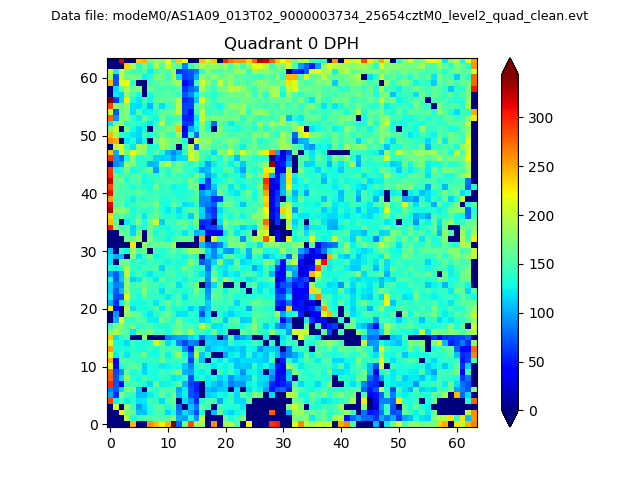 |
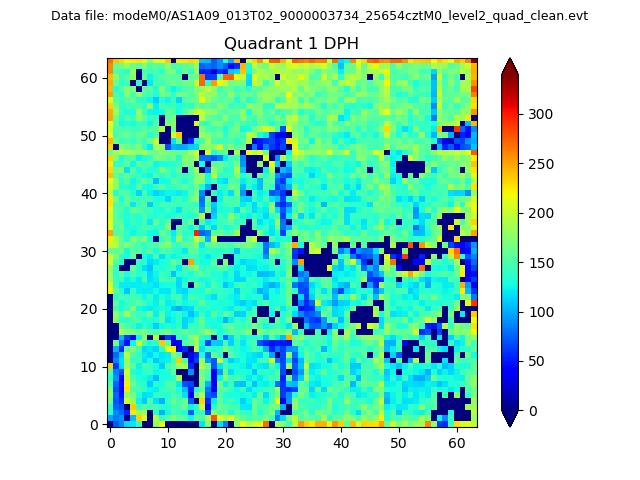 |
Quadrant B |
|---|---|---|---|
| Quadrant D | 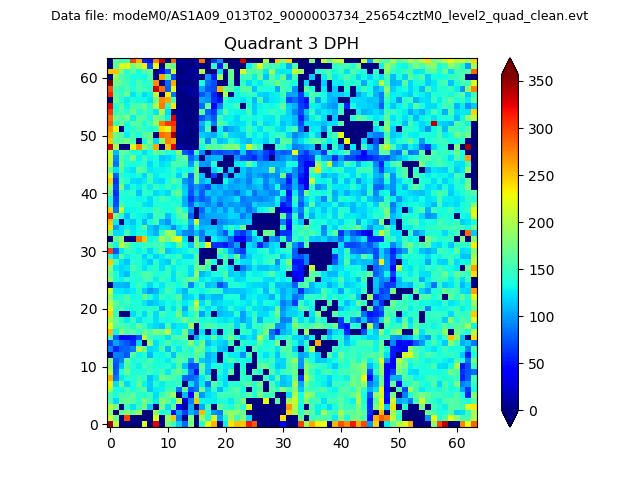 |
 |
Quadrant C |
| Plot type | Count rate plots | Images |
|---|---|---|
| Comparison with Poisson distribution Blue bars denote a histogram of data divided into 1 sec bins. Red curve is a Poisson curve with rate = median count rate of data. |
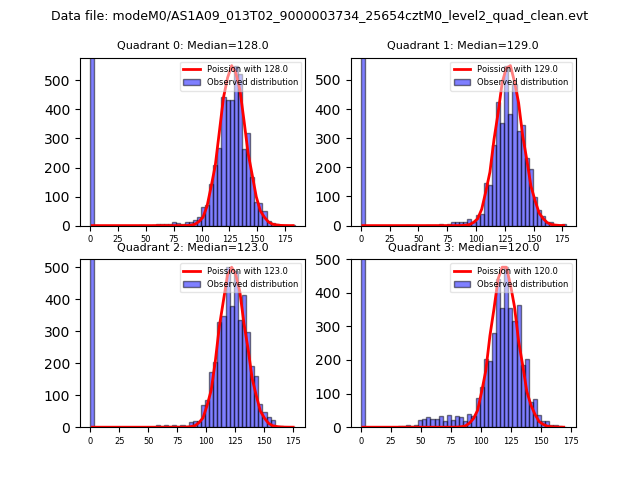 |
 |
| Quadrant-wise count rates Data is divided into 100 sec bins |
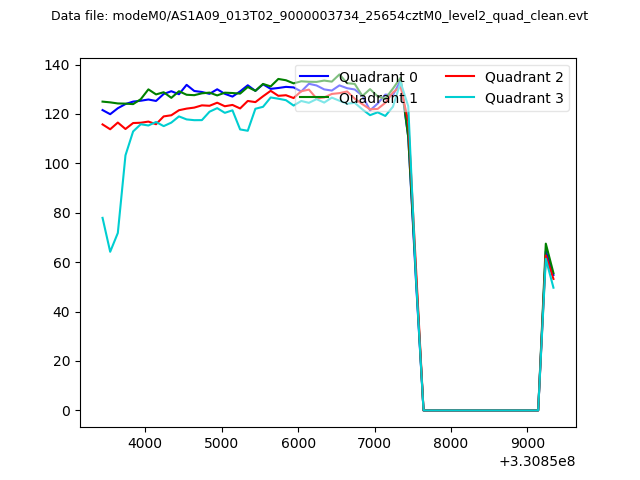 |
|
| Module-wise count rates for Quadrant A Data is divided into 100 sec bins |
 |
 |
| Module-wise count rates for Quadrant B Data is divided into 100 sec bins |
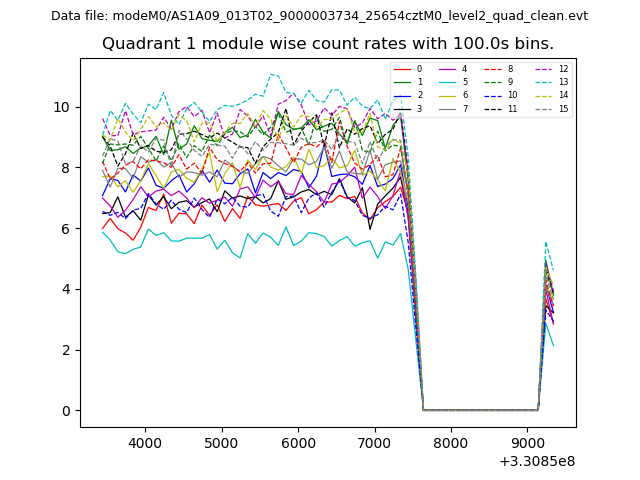 |
 |
| Module-wise count rates for Quadrant C Data is divided into 100 sec bins |
 |
 |
| Module-wise count rates for Quadrant D Data is divided into 100 sec bins |
 |
 |
| Parameter | Plot |
|---|---|
| CZT HV Monitor |  |
| D_VDD | 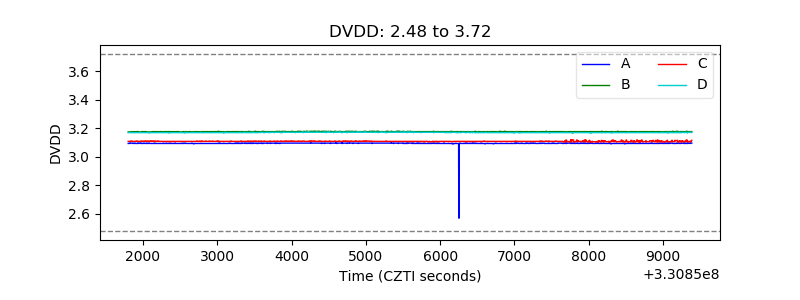 |
| Temperature 1 | 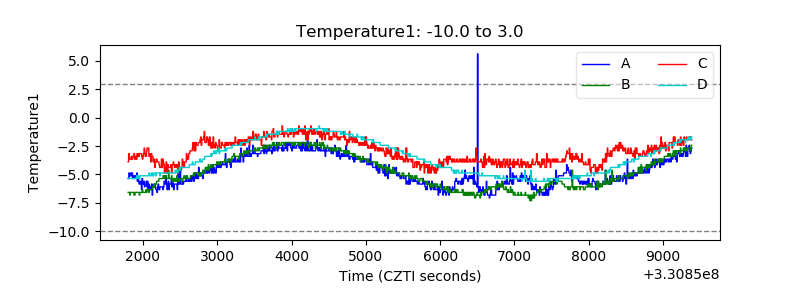 |
| Veto HV Monitor | 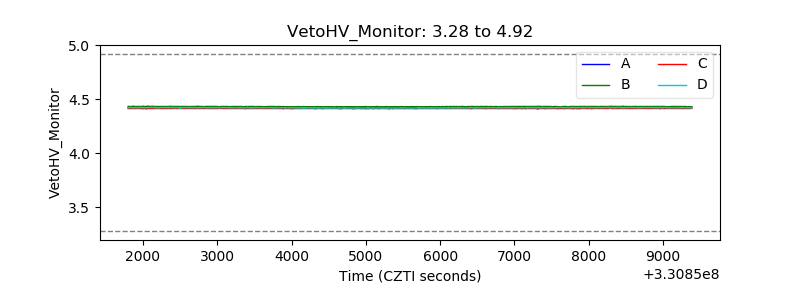 |
| Veto LLD | 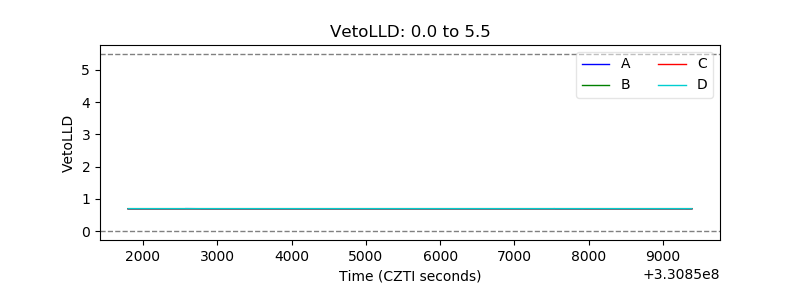 |
| Alpha Counter | 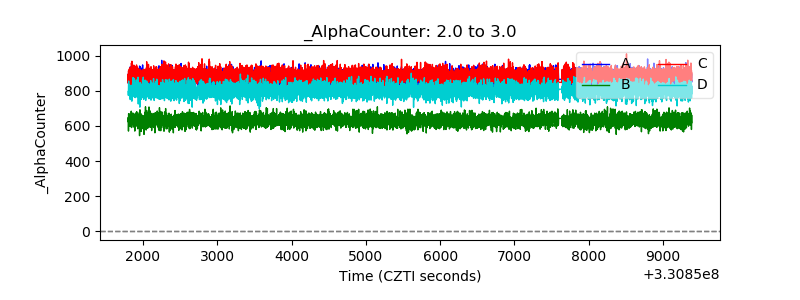 |
| _CPM_Rate | 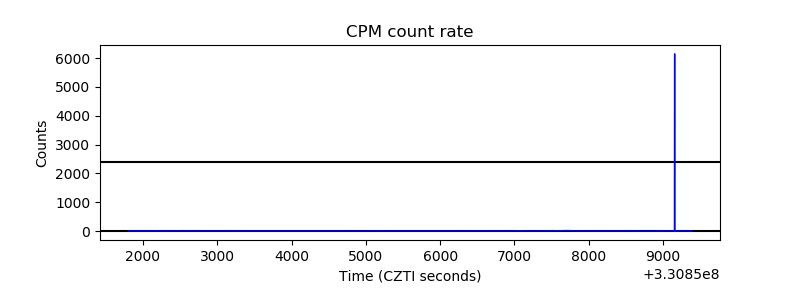 |
| CZT Counter | 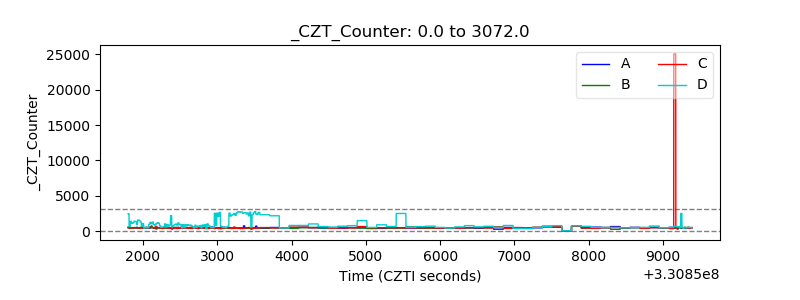 |
| +2.5 Volts monitor |  |
| +5 Volts monitor |  |
| _ROLL_ROT | 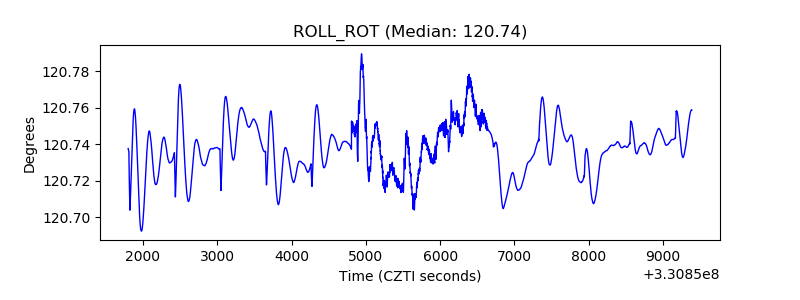 |
| _Roll_DEC | 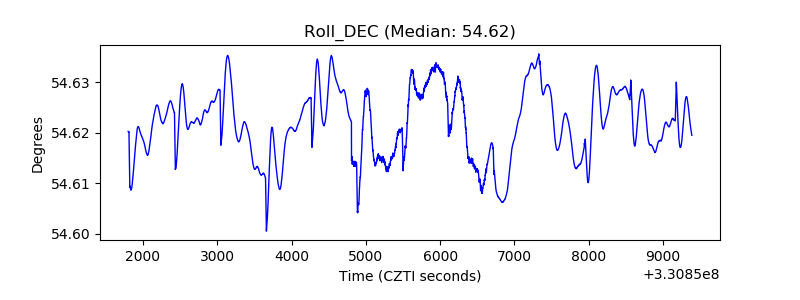 |
| _Roll_RA | 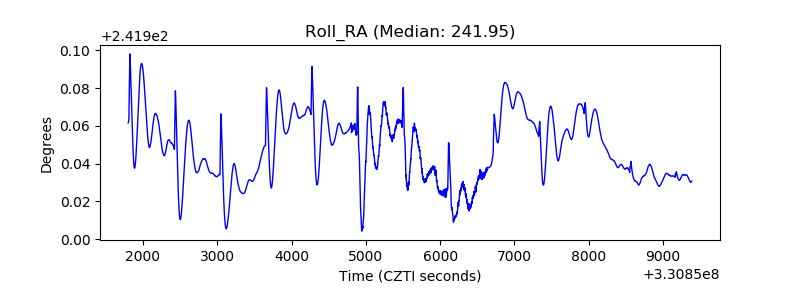 |
| Veto Counter |  |