| Param | Original file | Final file |
|---|---|---|
| Filename | modeM0/AS1A07_068T01_9000003760_25973cztM0_level2.evt | modeM0/AS1A07_068T01_9000003760_25973cztM0_level2_quad_clean.evt |
| Size (bytes) | 590,425,920 | 106,750,080 |
| Size | 563.1 MB | 101.8 MB |
| Events in quadrant A | 3,617,703 | 704,386 |
| Events in quadrant B | 3,661,694 | 701,255 |
| Events in quadrant C | 3,792,178 | 665,311 |
| Events in quadrant D | 6,290,895 | 629,780 |
| Mode M0 | |||
|---|---|---|---|
| Quadrant | BADHDUFLAG | Total packets | Discarded packets |
| A | 0 | 15803 | 0 |
| B | 0 | 15910 | 0 |
| C | 0 | 16230 | 0 |
| D | 0 | 24085 | 0 |
| Mode M9 | |||
|---|---|---|---|
| Quadrant | BADHDUFLAG | Total packets | Discarded packets |
| A | 0 | 7 | 0 |
| B | 0 | 7 | 0 |
| C | 0 | 7 | 0 |
| D | 0 | 7 | 0 |
| Quadrant | Total seconds | Saturated seconds | Saturation percentage |
|---|---|---|---|
| A | 7649 | 88 | 1.150477% |
| B | 7649 | 114 | 1.490391% |
| C | 7646 | 138 | 1.804865% |
| D | 7649 | 772 | 10.092823% |
Noise dominated data is calculated using 1-second bins in cleaned event files. If a bin has >2000 counts, and if more than 50% of those come from <1% of pixels, then it is considered to be noise-dominated and hence unusable.
| Quadrant | # 1 sec bins | Bins with >0 counts | Bins with >2000 counts | High rate bins dominated by noise | Noise dominated (total time) | Noise dominated (detector-on time) | Marked lightcurve |
|---|---|---|---|---|---|---|---|
| A | 8304 | 7651 | 0 | 0 | 0.00% | 0.00% | 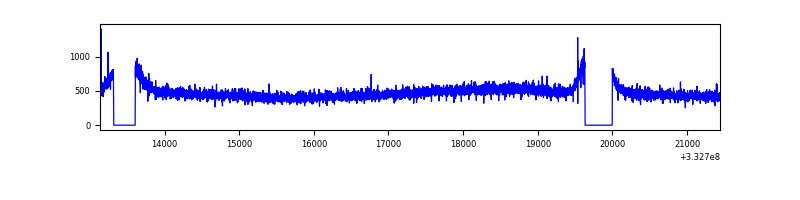 |
| B | 8304 | 7651 | 0 | 0 | 0.00% | 0.00% | 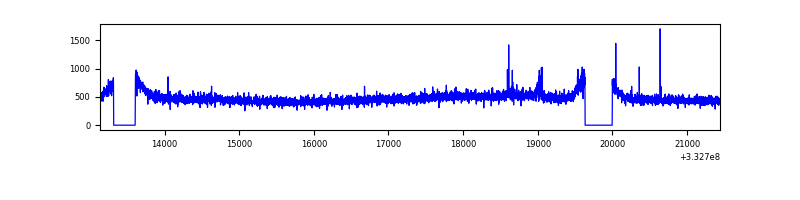 |
| C | 8304 | 7651 | 0 | 0 | 0.00% | 0.00% | 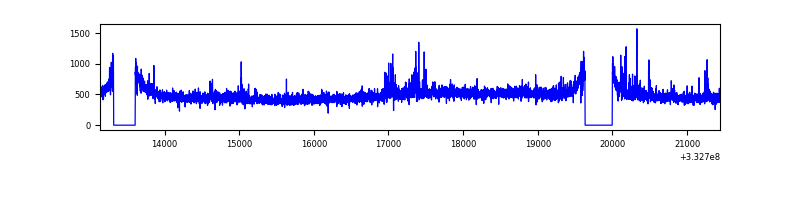 |
| D | 8304 | 7651 | 592 | 592 | 7.13% | 7.74% | 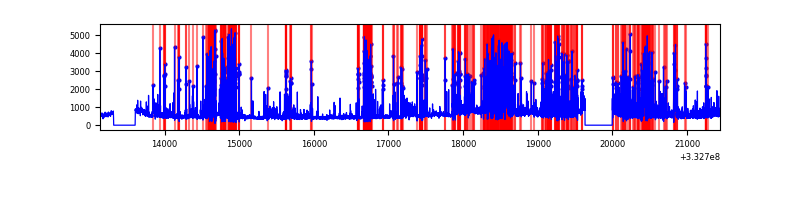 |
Top three noisy pixels from each quadrant. If the there are fewer than three noisy pixels in the level2.evt file, extra rows are filled as -1
| Pixel properties | Quadrant properties | ||||||
|---|---|---|---|---|---|---|---|
| Quadrant | DetID | PixID | Counts | Sigma | Mean | Median | Sigma |
| A | 13 | 254 | 13077 | 63.76 | 937 | 916 | 190.7 |
| A | 3 | 137 | 8724 | 40.93 | 937 | 916 | 190.7 |
| A | 0 | 226 | 8065 | 37.48 | 937 | 916 | 190.7 |
| B | 0 | 190 | 33287 | 180.53 | 923 | 899 | 179.4 |
| B | 12 | 111 | 22202 | 118.74 | 923 | 899 | 179.4 |
| B | 11 | 111 | 19830 | 105.52 | 923 | 899 | 179.4 |
| C | 3 | 233 | 208277 | 998.57 | 879 | 880 | 207.7 |
| C | 14 | 238 | 140254 | 671.06 | 879 | 880 | 207.7 |
| C | 2 | 16 | 10504 | 46.34 | 879 | 880 | 207.7 |
| D | 1 | 52 | 2630981 | 12622.48 | 863 | 843 | 208.4 |
| D | 7 | 80 | 324954 | 1555.46 | 863 | 843 | 208.4 |
| D | 13 | 168 | 36939 | 173.23 | 863 | 843 | 208.4 |
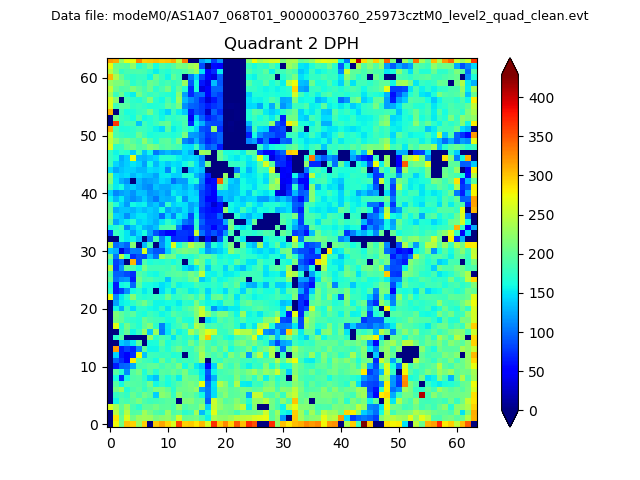
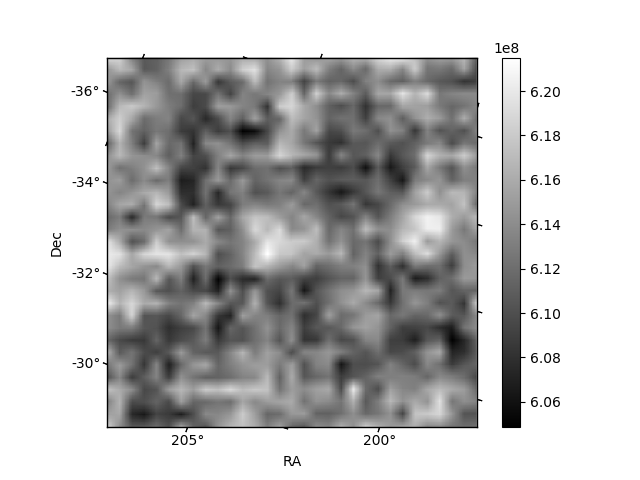
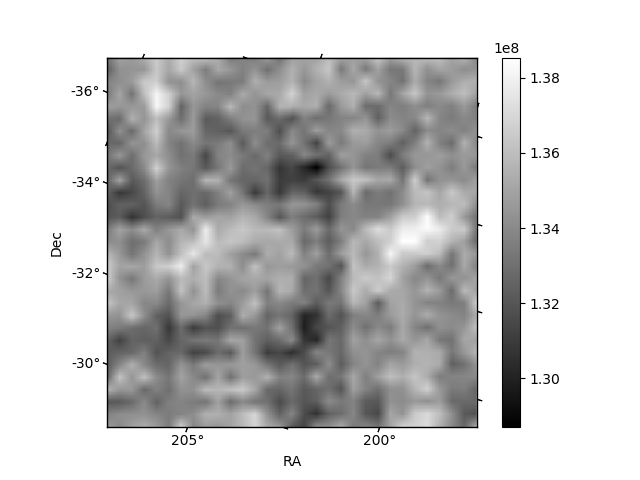
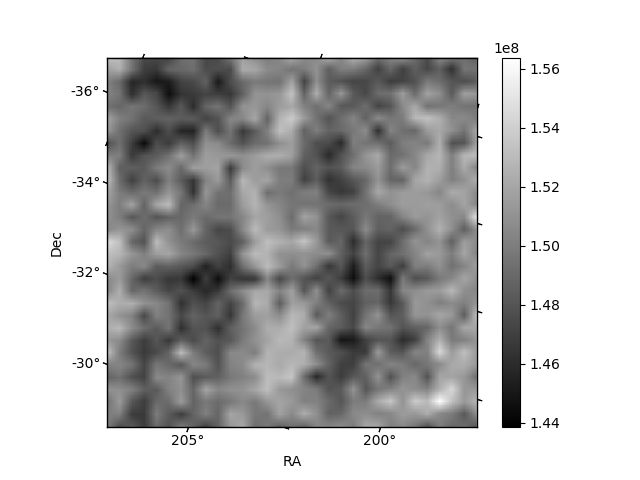
Histogram calculated using DETX and DETY for each event in the final _common_clean file
| Quadrant A | 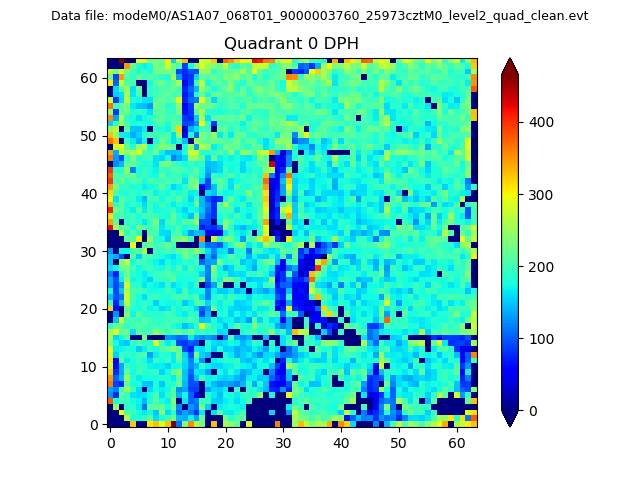 |
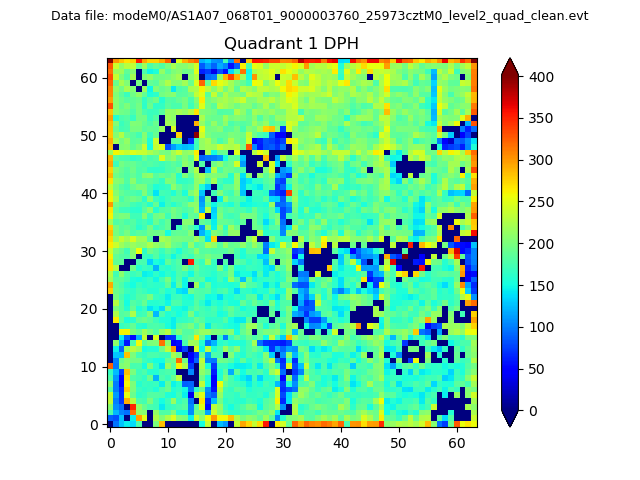 |
Quadrant B |
|---|---|---|---|
| Quadrant D | 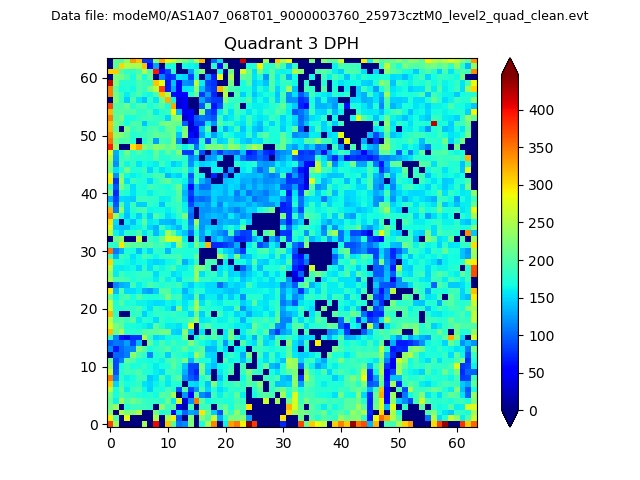 |
 |
Quadrant C |
| Plot type | Count rate plots | Images |
|---|---|---|
| Comparison with Poisson distribution Blue bars denote a histogram of data divided into 1 sec bins. Red curve is a Poisson curve with rate = median count rate of data. |
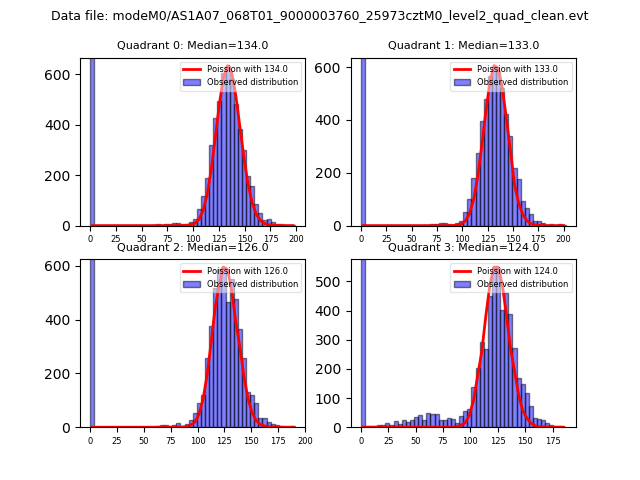 |
 |
| Quadrant-wise count rates Data is divided into 100 sec bins |
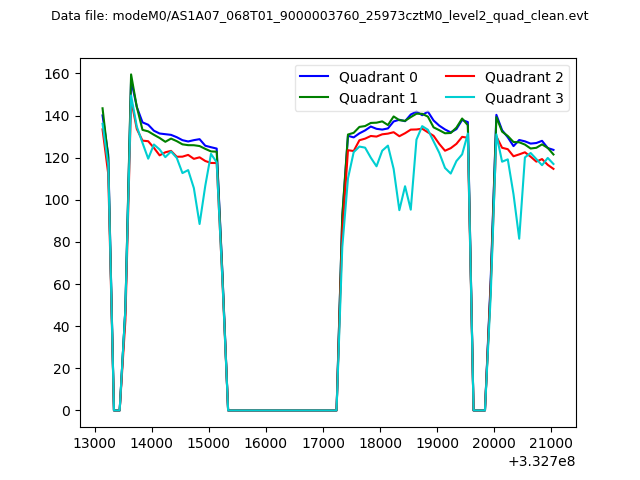 |
|
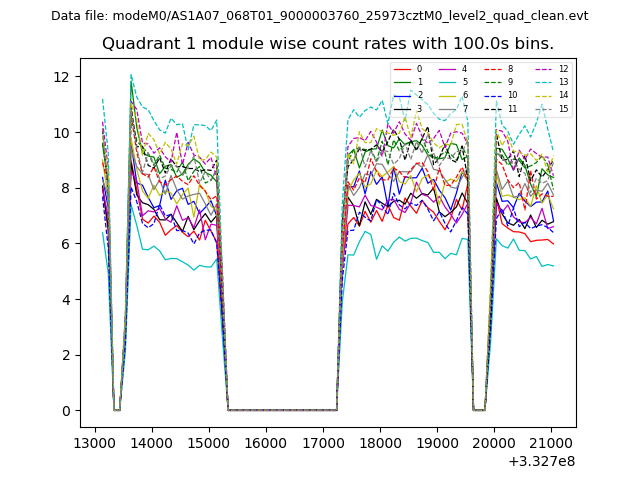
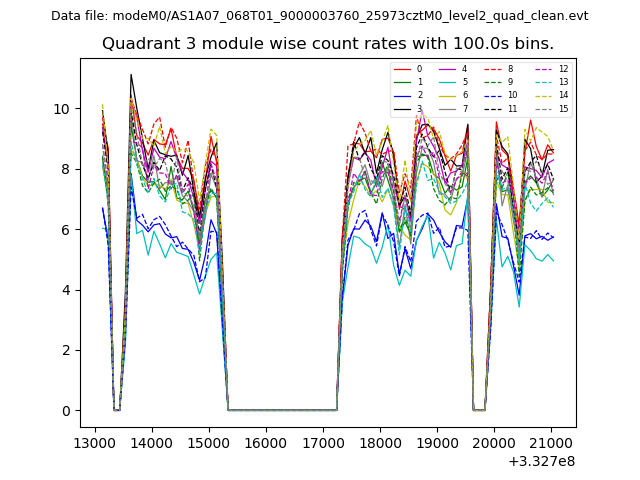
| Module-wise count rates for Quadrant A Data is divided into 100 sec bins |
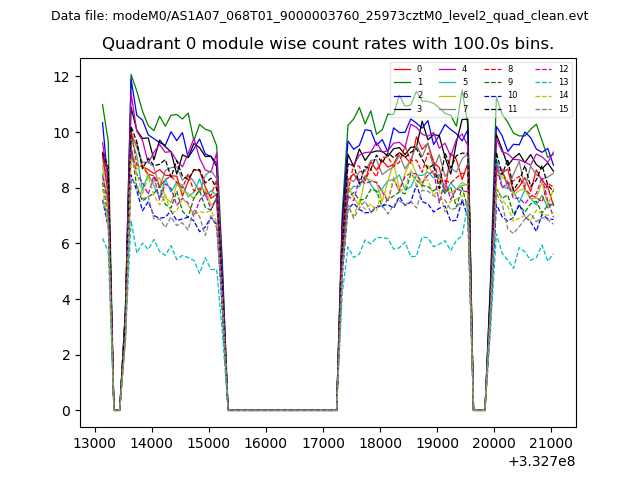 |
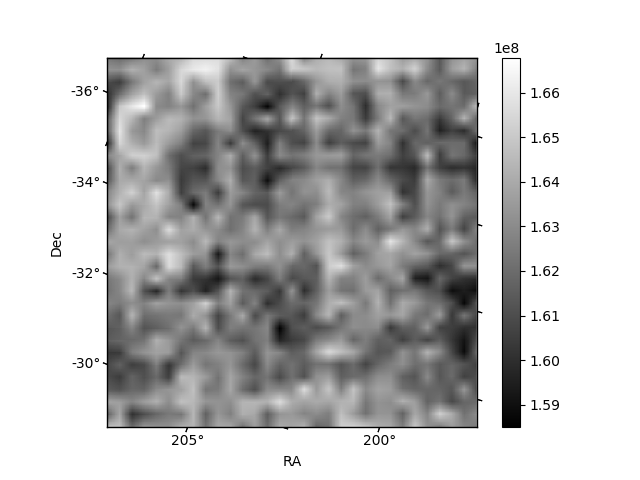 |
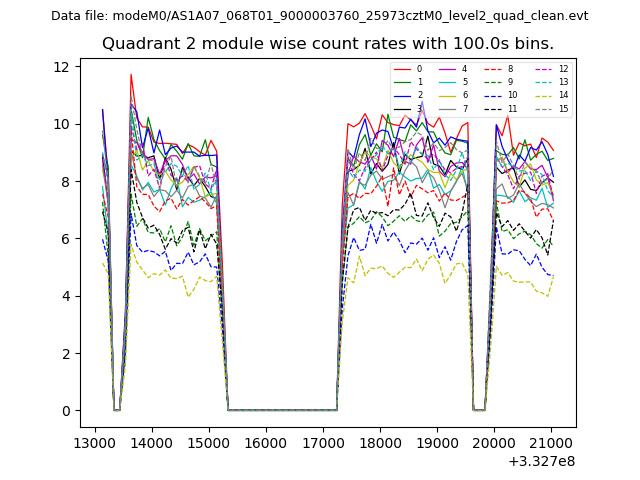
| Module-wise count rates for Quadrant B Data is divided into 100 sec bins |
 |
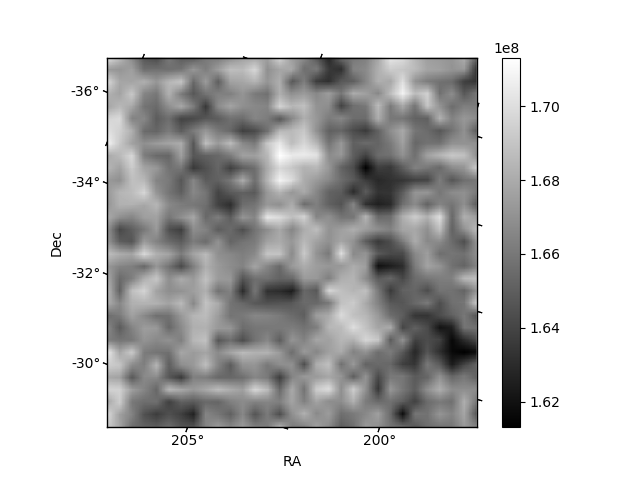 |
| Module-wise count rates for Quadrant C Data is divided into 100 sec bins |
 |
 |
| Module-wise count rates for Quadrant D Data is divided into 100 sec bins |
 |
 |
| Parameter | Plot |
|---|---|
| CZT HV Monitor | 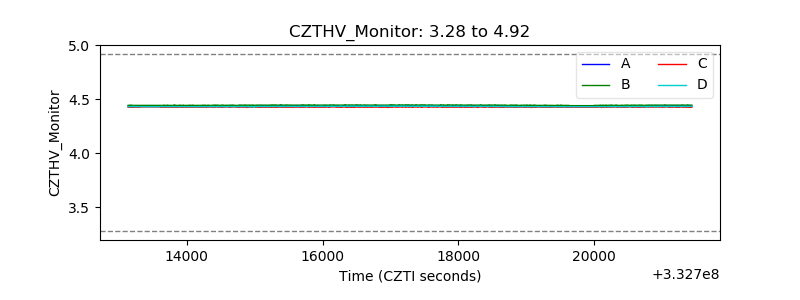 |
| D_VDD | 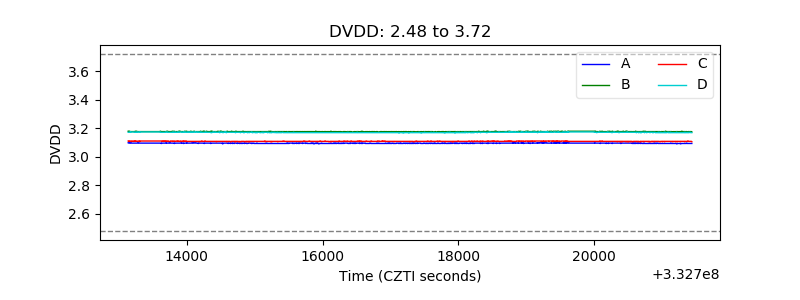 |
| Temperature 1 |  |
| Veto HV Monitor | 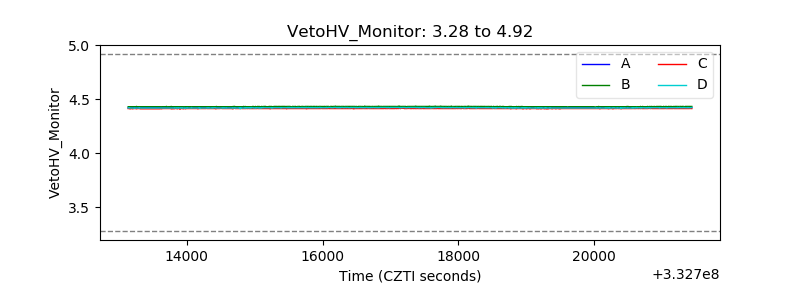 |
| Veto LLD | 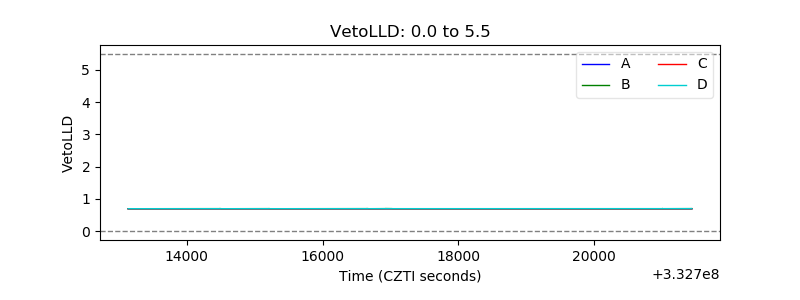 |
| Alpha Counter | 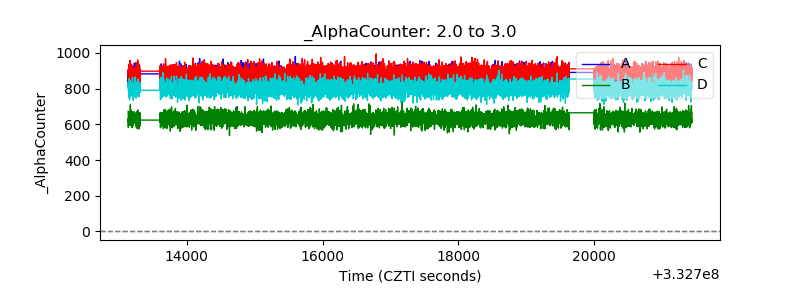 |
| _CPM_Rate | 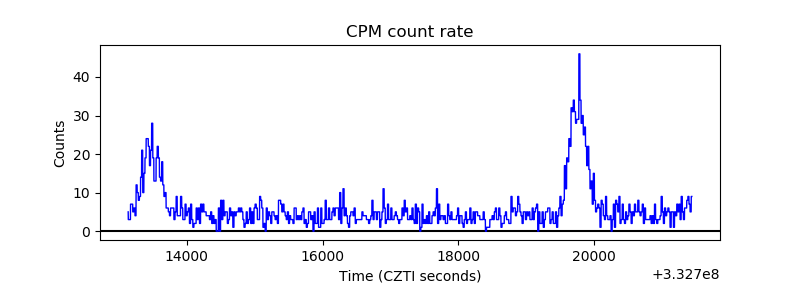 |
| CZT Counter | 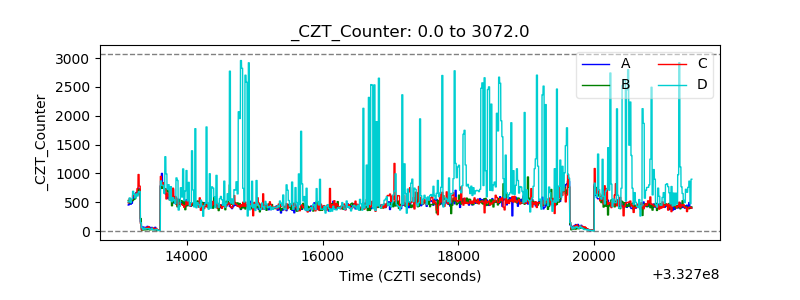 |
| +2.5 Volts monitor |  |
| +5 Volts monitor |  |
| _ROLL_ROT |  |
| _Roll_DEC |  |
| _Roll_RA | 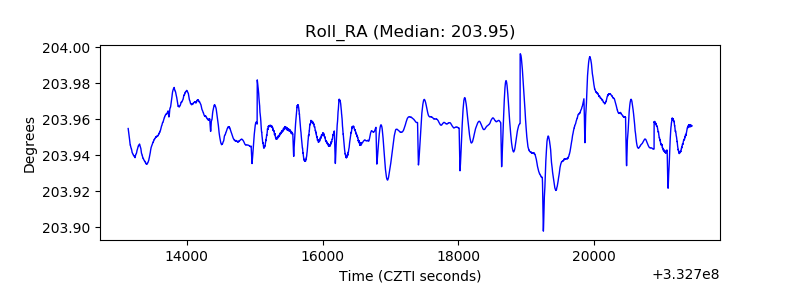 |
| Veto Counter | 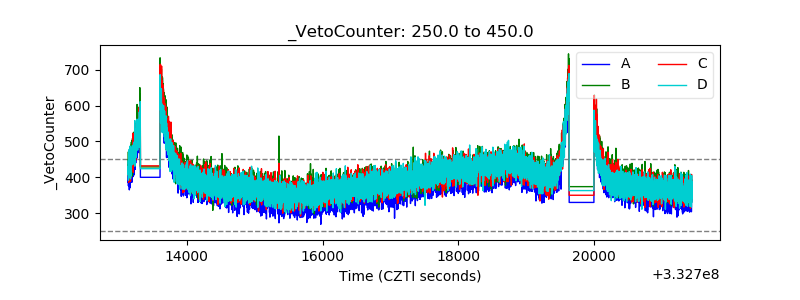 |