| Param | Original file | Final file |
|---|---|---|
| Filename | modeM0/AS1A09_033T02_9000003762_26024cztM0_level2.evt | modeM0/AS1A09_033T02_9000003762_26024cztM0_level2_quad_clean.evt |
| Size (bytes) | 132,543,360 | 35,156,160 |
| Size | 126.4 MB | 33.5 MB |
| Events in quadrant A | 1,194,588 | 239,878 |
| Events in quadrant B | 903,991 | 247,521 |
| Events in quadrant C | 885,621 | 228,986 |
| Events in quadrant D | 920,532 | 231,756 |
| Mode M9 | |||
|---|---|---|---|
| Quadrant | BADHDUFLAG | Total packets | Discarded packets |
| A | 0 | 3 | 0 |
| B | 0 | 3 | 0 |
| C | 0 | 3 | 0 |
| D | 0 | 3 | 0 |
| Mode M0 | |||
|---|---|---|---|
| Quadrant | BADHDUFLAG | Total packets | Discarded packets |
| A | 0 | 4605 | 0 |
| B | 0 | 3645 | 0 |
| C | 0 | 3578 | 0 |
| D | 0 | 3736 | 0 |
| Quadrant | Total seconds | Saturated seconds | Saturation percentage |
|---|---|---|---|
| A | 1572 | 67 | 4.262087% |
| B | 1572 | 6 | 0.381679% |
| C | 1572 | 3 | 0.190840% |
| D | 1572 | 3 | 0.190840% |
Noise dominated data is calculated using 1-second bins in cleaned event files. If a bin has >2000 counts, and if more than 50% of those come from <1% of pixels, then it is considered to be noise-dominated and hence unusable.
| Quadrant | # 1 sec bins | Bins with >0 counts | Bins with >2000 counts | High rate bins dominated by noise | Noise dominated (total time) | Noise dominated (detector-on time) | Marked lightcurve |
|---|---|---|---|---|---|---|---|
| A | 1572 | 1572 | 54 | 54 | 3.44% | 3.44% | 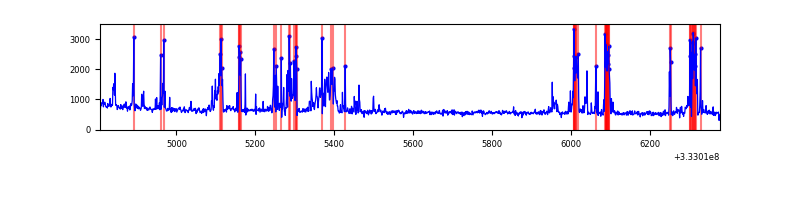 |
| B | 1572 | 1572 | 0 | 0 | 0.00% | 0.00% |  |
| C | 1572 | 1572 | 0 | 0 | 0.00% | 0.00% |  |
| D | 1572 | 1572 | 1 | 1 | 0.06% | 0.06% |  |
Top three noisy pixels from each quadrant. If the there are fewer than three noisy pixels in the level2.evt file, extra rows are filled as -1
| Pixel properties | Quadrant properties | ||||||
|---|---|---|---|---|---|---|---|
| Quadrant | DetID | PixID | Counts | Sigma | Mean | Median | Sigma |
| A | 0 | 13 | 284544 | 5947.63 | 235 | 231 | 47.8 |
| A | 5 | 244 | 5737 | 115.18 | 235 | 231 | 47.8 |
| A | 0 | 226 | 2094 | 38.97 | 235 | 231 | 47.8 |
| B | 12 | 111 | 4751 | 100.5 | 231 | 227 | 45.0 |
| B | 14 | 111 | 4317 | 90.86 | 231 | 227 | 45.0 |
| B | 11 | 111 | 4213 | 88.55 | 231 | 227 | 45.0 |
| C | 14 | 238 | 36262 | 704.3 | 217 | 219 | 51.2 |
| C | 13 | 61 | 1666 | 28.28 | 217 | 219 | 51.2 |
| C | 3 | 233 | 1446 | 23.98 | 217 | 219 | 51.2 |
| D | 1 | 52 | 38064 | 699.22 | 224 | 219 | 54.1 |
| D | 7 | 223 | 19835 | 362.42 | 224 | 219 | 54.1 |
| D | 13 | 174 | 7378 | 132.27 | 224 | 219 | 54.1 |
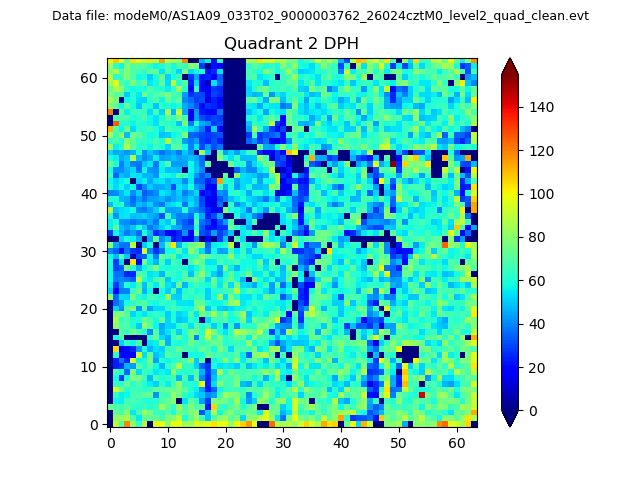
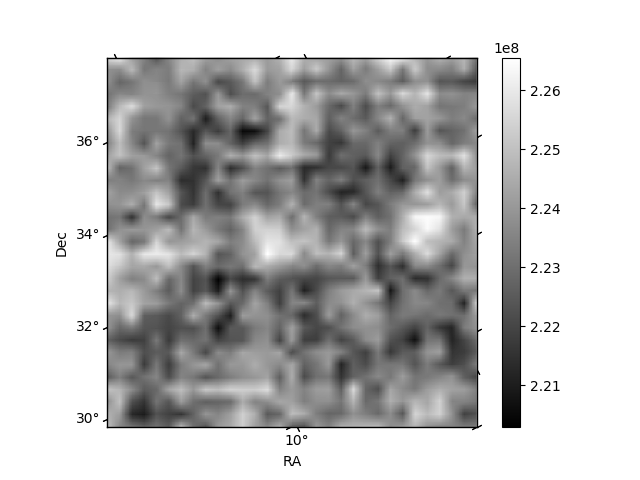
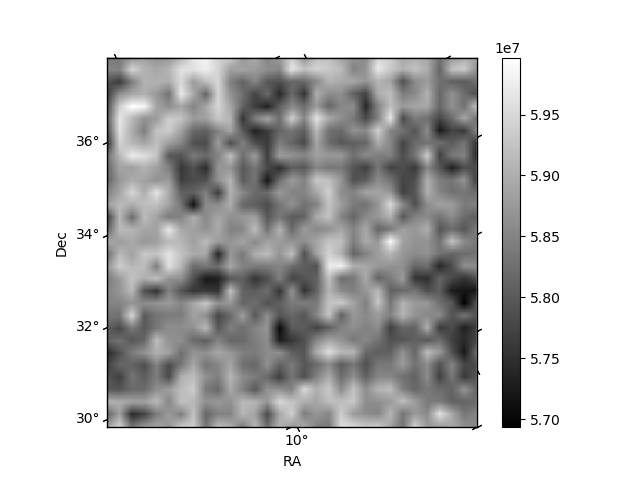
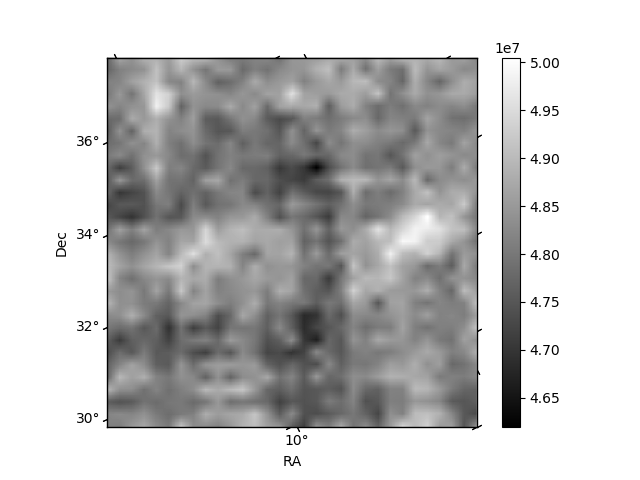
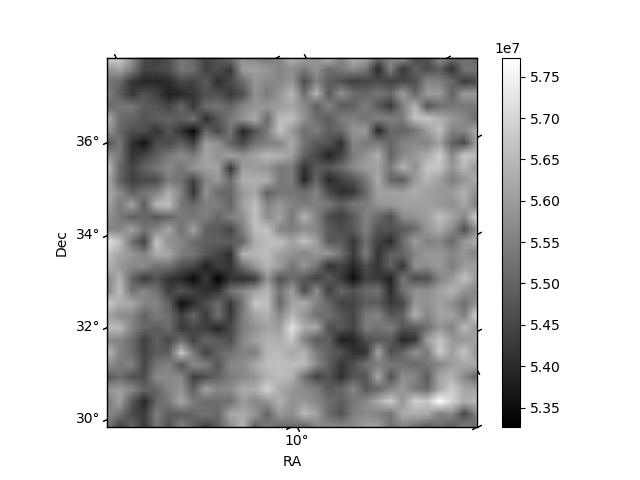
Histogram calculated using DETX and DETY for each event in the final _common_clean file
| Quadrant A | 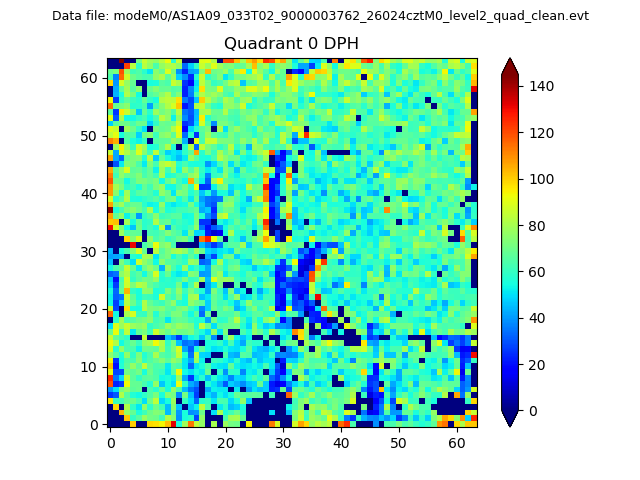 |
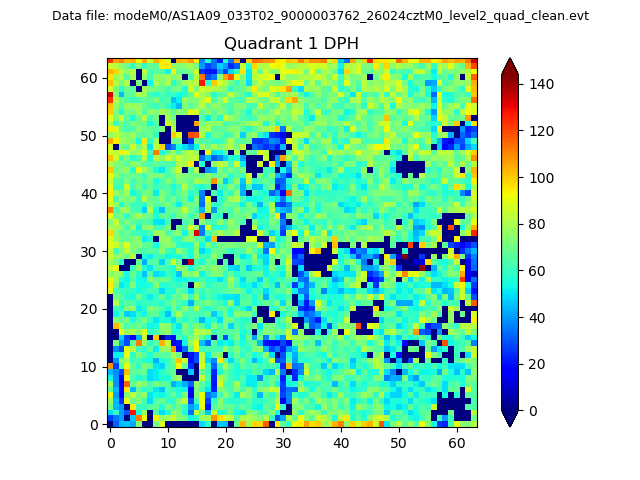 |
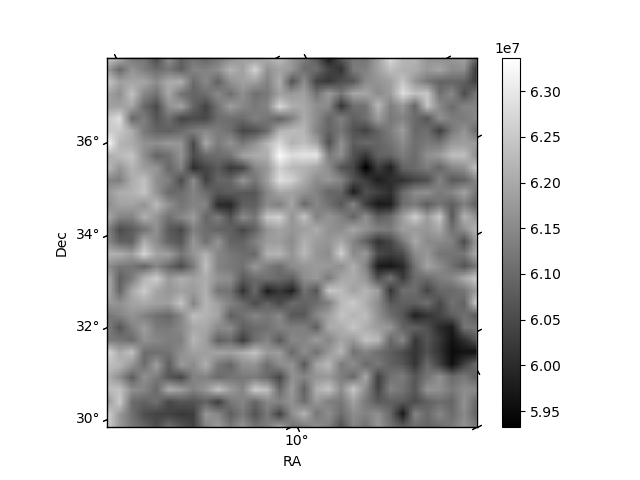
Quadrant B |
|---|---|---|---|
| Quadrant D | 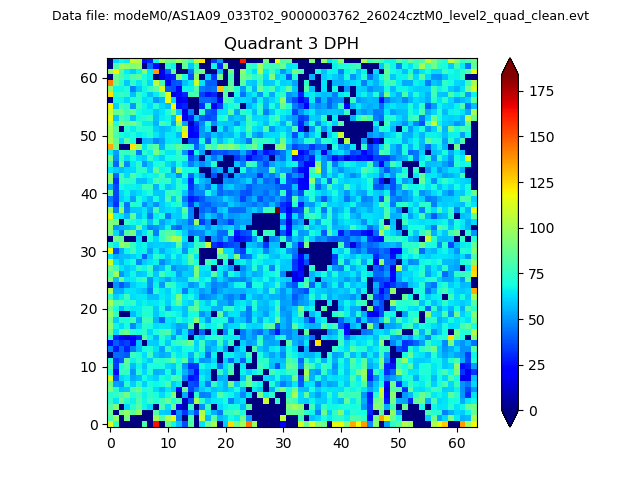 |
 |
Quadrant C |
| Plot type | Count rate plots | Images |
|---|---|---|
| Comparison with Poisson distribution Blue bars denote a histogram of data divided into 1 sec bins. Red curve is a Poisson curve with rate = median count rate of data. |
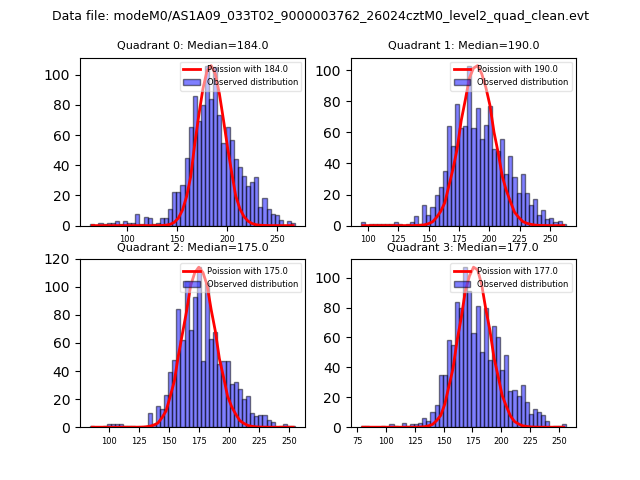 |
 |
| Quadrant-wise count rates Data is divided into 100 sec bins |
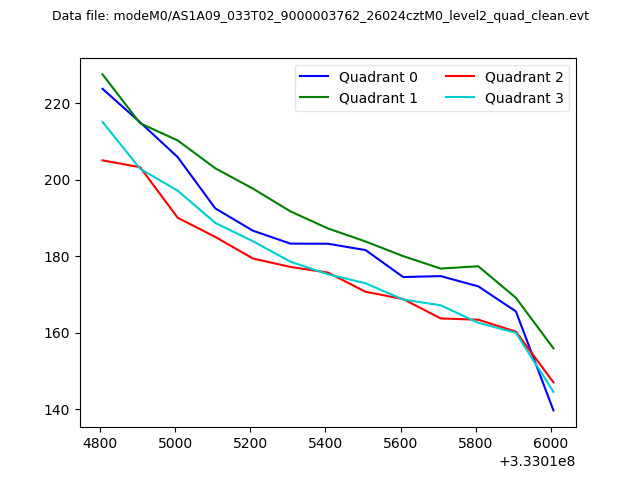 |
|
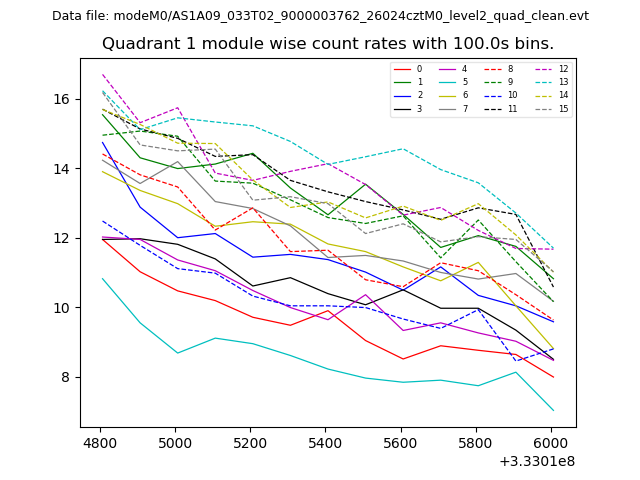
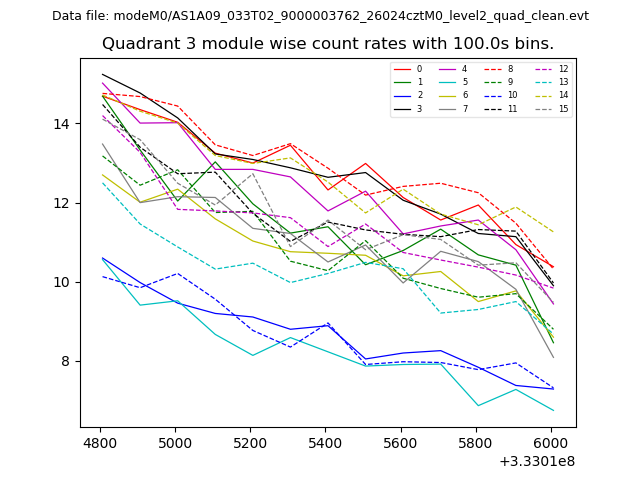
| Module-wise count rates for Quadrant A Data is divided into 100 sec bins |
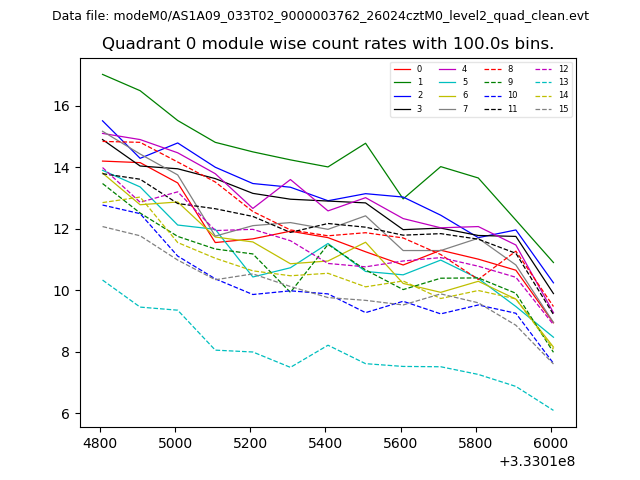 |
 |
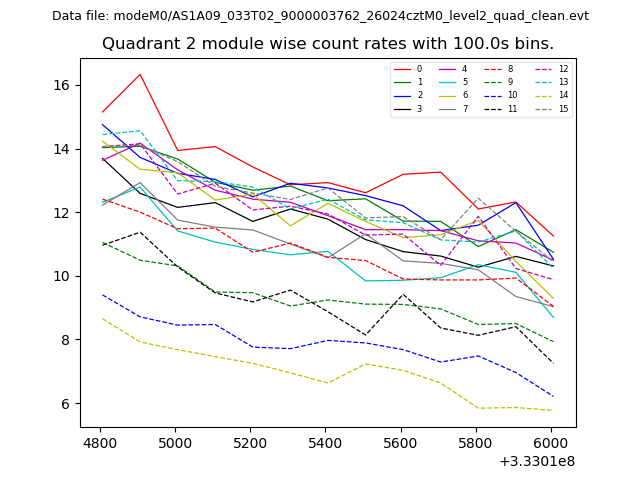
| Module-wise count rates for Quadrant B Data is divided into 100 sec bins |
 |
 |
| Module-wise count rates for Quadrant C Data is divided into 100 sec bins |
 |
 |
| Module-wise count rates for Quadrant D Data is divided into 100 sec bins |
 |
 |
| Parameter | Plot |
|---|---|
| CZT HV Monitor | 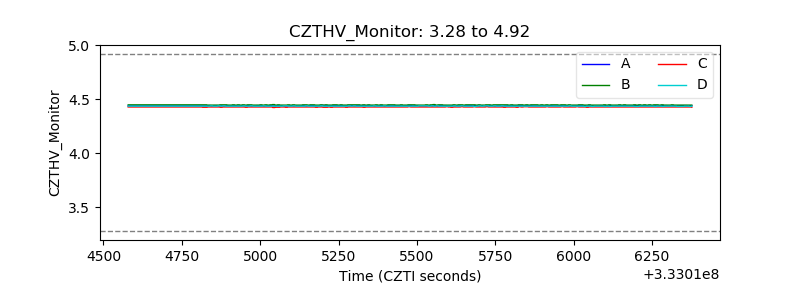 |
| D_VDD | 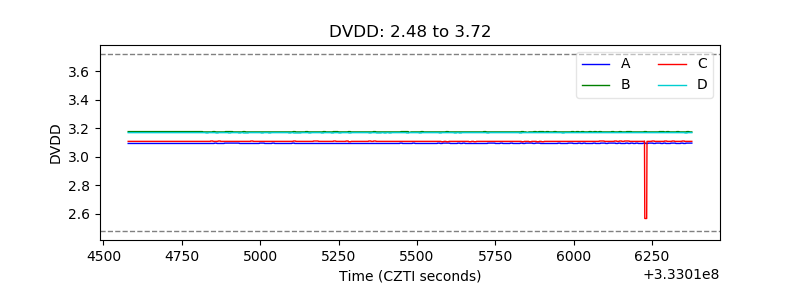 |
| Temperature 1 | 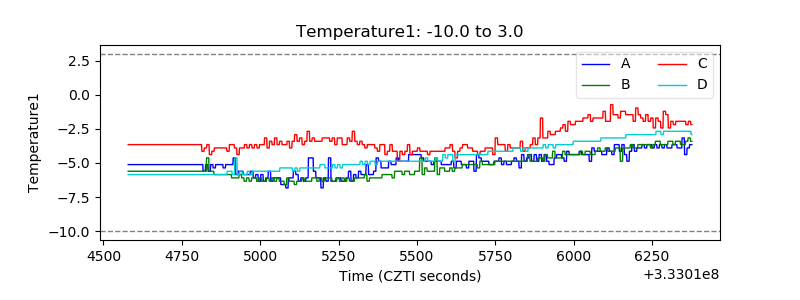 |
| Veto HV Monitor |  |
| Veto LLD | 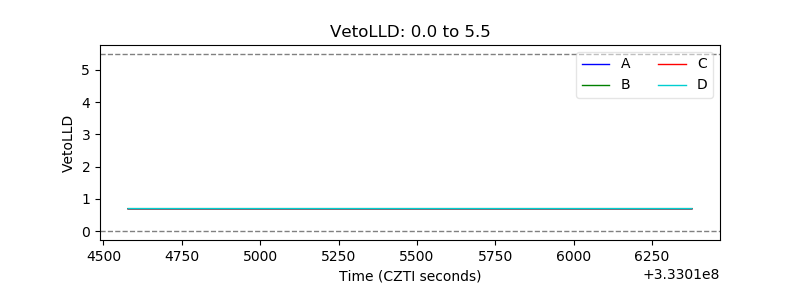 |
| Alpha Counter | 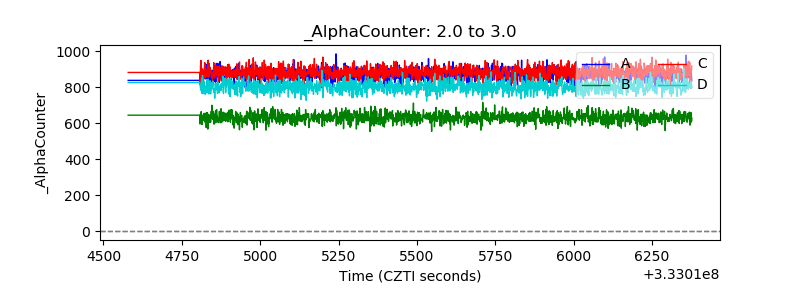 |
| _CPM_Rate | 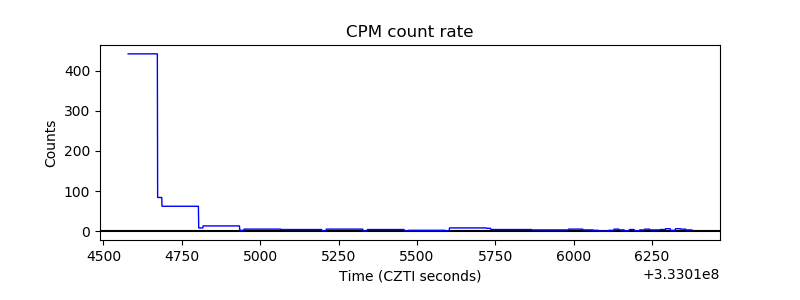 |
| CZT Counter | 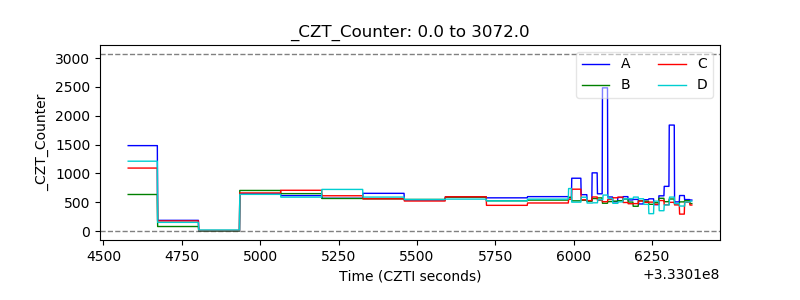 |
| +2.5 Volts monitor |  |
| +5 Volts monitor |  |
| _ROLL_ROT | 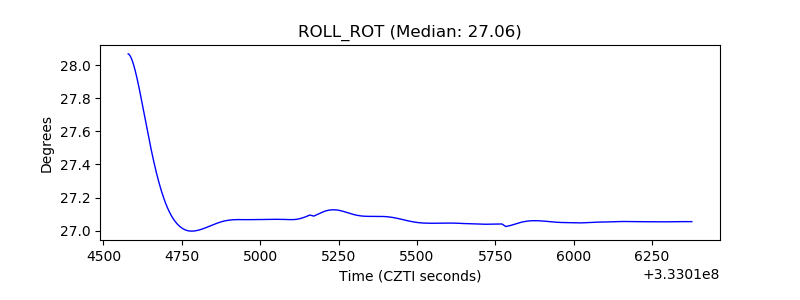 |
| _Roll_DEC | 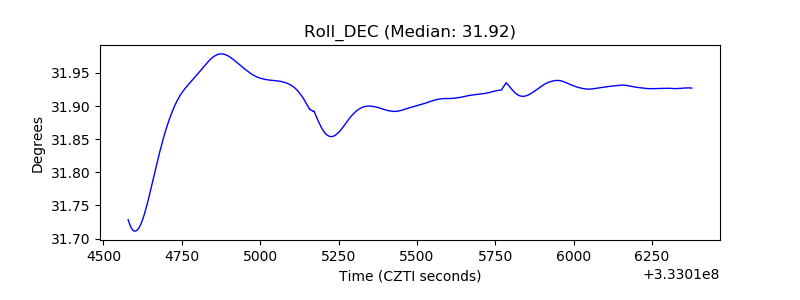 |
| _Roll_RA | 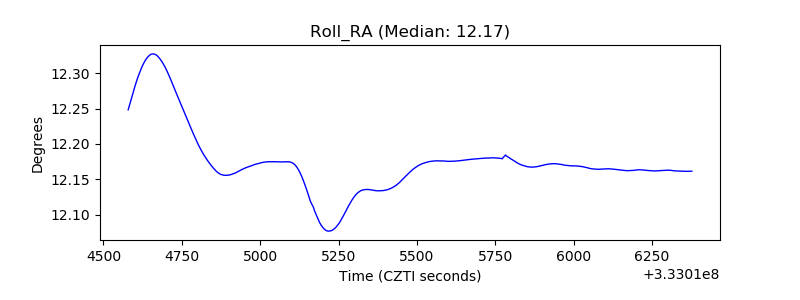 |
| Veto Counter | 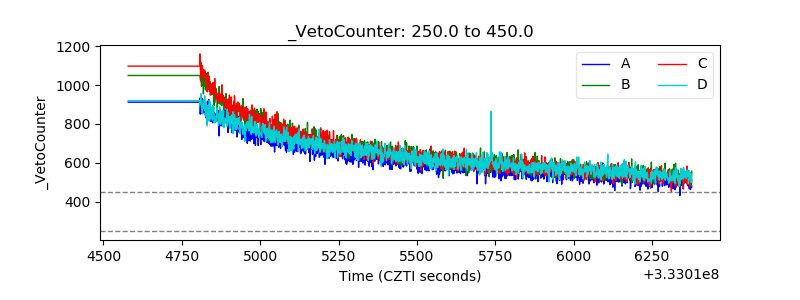 |