| Param | Original file | Final file |
|---|---|---|
| Filename | modeM0/AS1A09_142T01_9000003766_26064cztM0_level2.evt | modeM0/AS1A09_142T01_9000003766_26064cztM0_level2_quad_clean.evt |
| Size (bytes) | 845,012,160 | 63,529,920 |
| Size | 805.9 MB | 60.6 MB |
| Events in quadrant A | 3,086,213 | 452,573 |
| Events in quadrant B | 3,232,848 | 456,722 |
| Events in quadrant C | 3,117,979 | 433,095 |
| Events in quadrant D | 15,709,573 | 121,543 |
| Mode M9 | |||
|---|---|---|---|
| Quadrant | BADHDUFLAG | Total packets | Discarded packets |
| A | 0 | 10 | 0 |
| B | 0 | 10 | 0 |
| C | 0 | 10 | 0 |
| D | 0 | 10 | 0 |
| Mode M0 | |||
|---|---|---|---|
| Quadrant | BADHDUFLAG | Total packets | Discarded packets |
| A | 0 | 13343 | 0 |
| B | 0 | 13781 | 0 |
| C | 0 | 13425 | 0 |
| D | 0 | 51078 | 0 |
| Quadrant | Total seconds | Saturated seconds | Saturation percentage |
|---|---|---|---|
| A | 6565 | 27 | 0.411272% |
| B | 6566 | 44 | 0.670119% |
| C | 6566 | 70 | 1.066098% |
| D | 6566 | 5681 | 86.521474% |
Noise dominated data is calculated using 1-second bins in cleaned event files. If a bin has >2000 counts, and if more than 50% of those come from <1% of pixels, then it is considered to be noise-dominated and hence unusable.
| Quadrant | # 1 sec bins | Bins with >0 counts | Bins with >2000 counts | High rate bins dominated by noise | Noise dominated (total time) | Noise dominated (detector-on time) | Marked lightcurve |
|---|---|---|---|---|---|---|---|
| A | 7580 | 6565 | 0 | 0 | 0.00% | 0.00% | 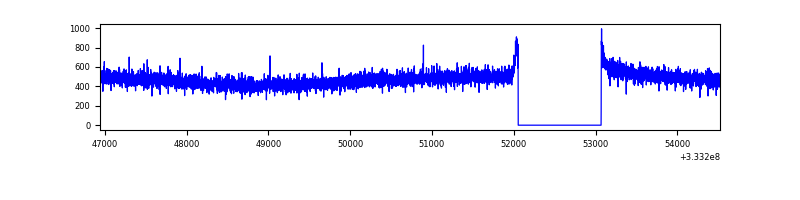 |
| B | 7581 | 6566 | 6 | 6 | 0.08% | 0.09% | 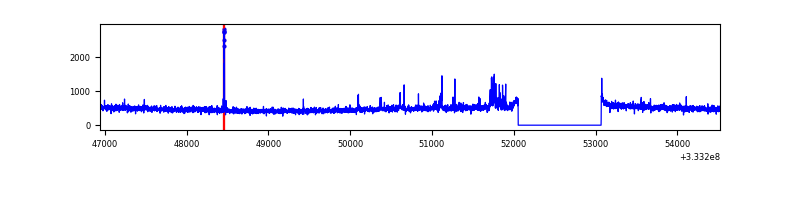 |
| C | 7581 | 6566 | 0 | 0 | 0.00% | 0.00% | 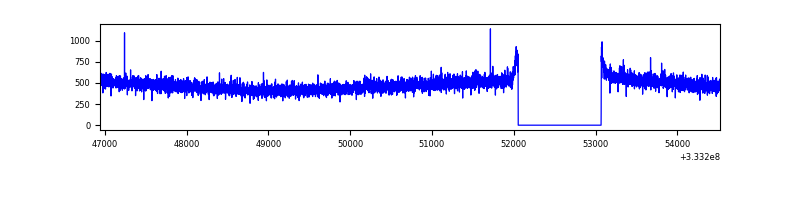 |
| D | 7580 | 6565 | 5600 | 5600 | 73.88% | 85.30% | 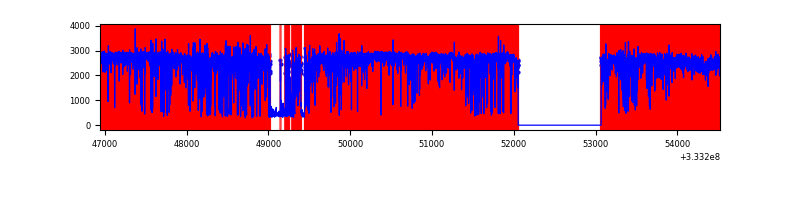 |
Top three noisy pixels from each quadrant. If the there are fewer than three noisy pixels in the level2.evt file, extra rows are filled as -1
| Pixel properties | Quadrant properties | ||||||
|---|---|---|---|---|---|---|---|
| Quadrant | DetID | PixID | Counts | Sigma | Mean | Median | Sigma |
| A | 13 | 254 | 11245 | 65.22 | 799 | 783 | 160.4 |
| A | 3 | 137 | 7306 | 40.66 | 799 | 783 | 160.4 |
| A | 0 | 226 | 6935 | 38.35 | 799 | 783 | 160.4 |
| B | 5 | 172 | 71823 | 464.57 | 797 | 775 | 152.9 |
| B | 0 | 230 | 22635 | 142.94 | 797 | 775 | 152.9 |
| B | 12 | 111 | 18589 | 116.48 | 797 | 775 | 152.9 |
| C | 14 | 238 | 123631 | 682.54 | 766 | 771 | 180.0 |
| C | 3 | 233 | 6109 | 29.65 | 766 | 771 | 180.0 |
| C | 13 | 61 | 5378 | 25.59 | 766 | 771 | 180.0 |
| D | 1 | 3 | 13790065 | 153254.38 | 373 | 364 | 90.0 |
| D | 1 | 52 | 470677 | 5226.91 | 373 | 364 | 90.0 |
| D | 2 | 234 | 13275 | 143.49 | 373 | 364 | 90.0 |
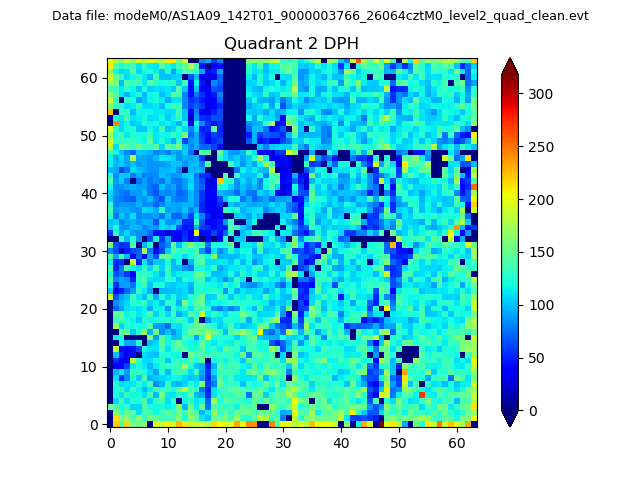
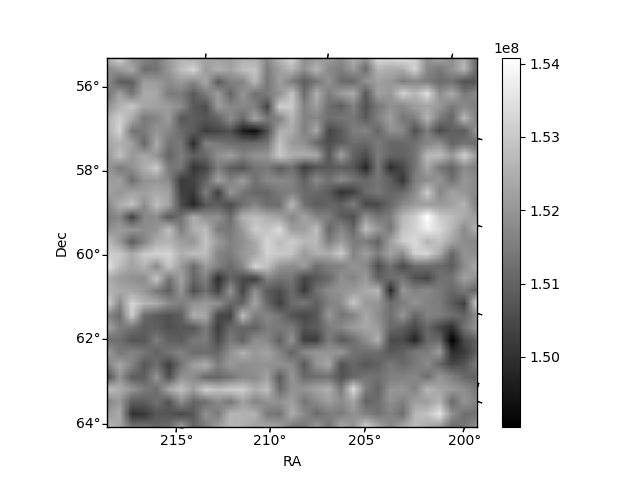
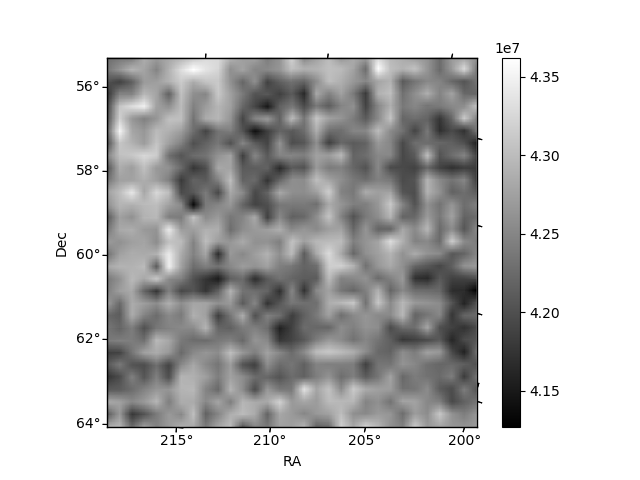
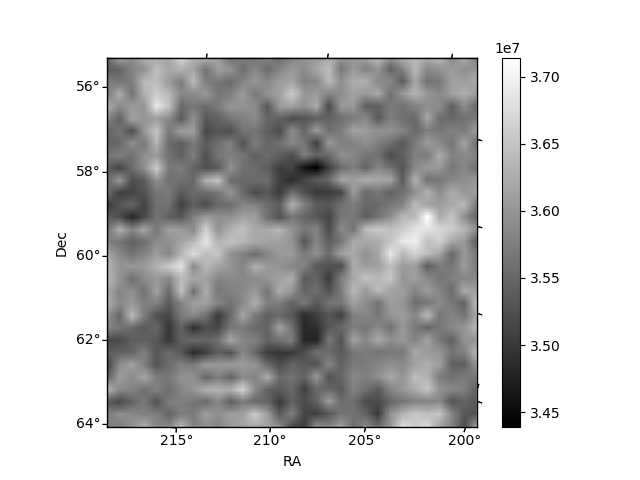
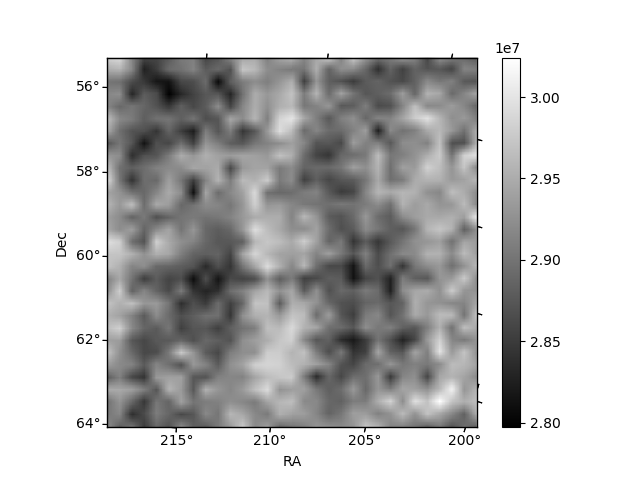
Histogram calculated using DETX and DETY for each event in the final _common_clean file
| Quadrant A | 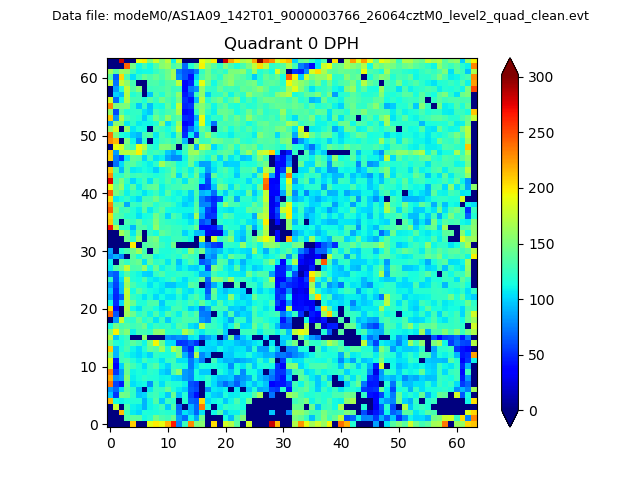 |
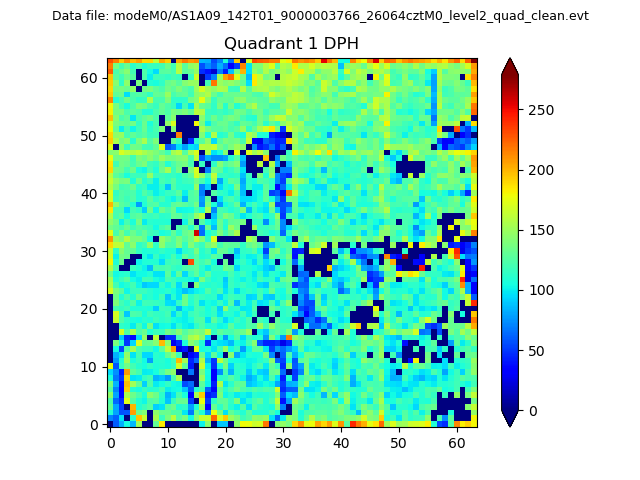 |
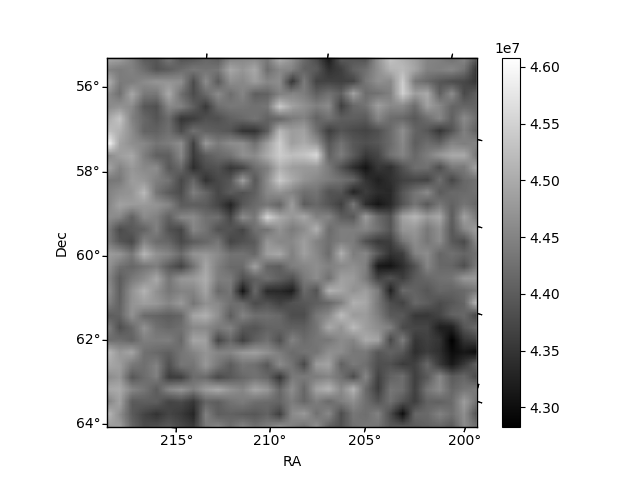
Quadrant B |
|---|---|---|---|
| Quadrant D | 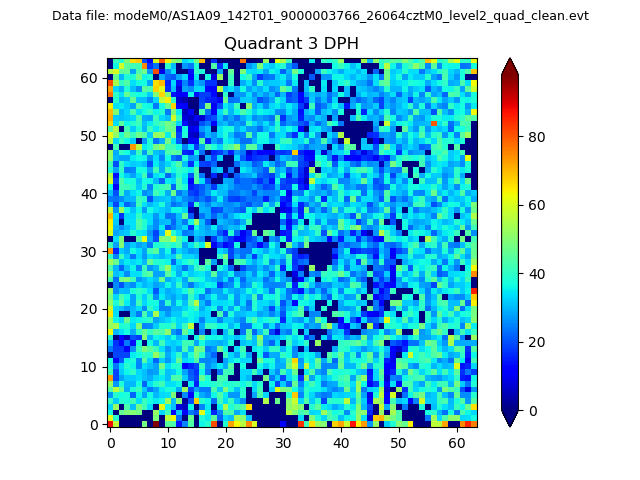 |
 |
Quadrant C |
| Plot type | Count rate plots | Images |
|---|---|---|
| Comparison with Poisson distribution Blue bars denote a histogram of data divided into 1 sec bins. Red curve is a Poisson curve with rate = median count rate of data. |
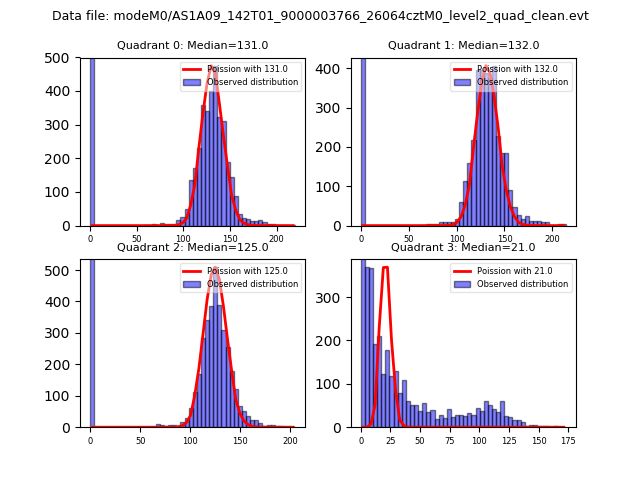 |
 |
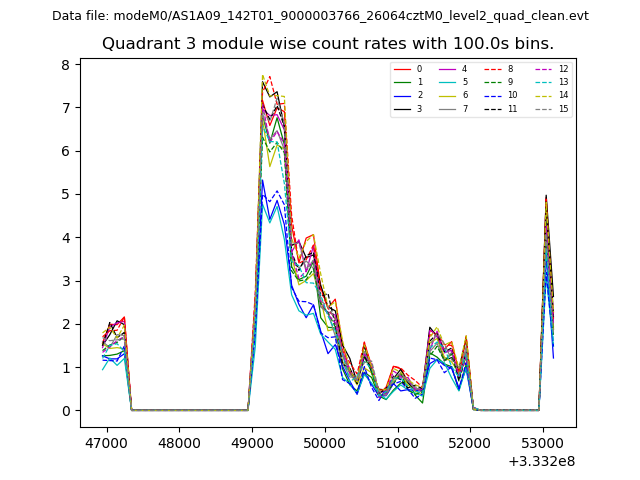
| Quadrant-wise count rates Data is divided into 100 sec bins |
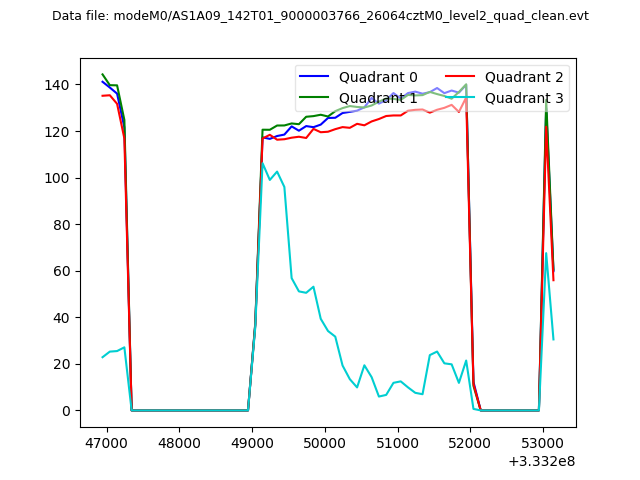 |
|
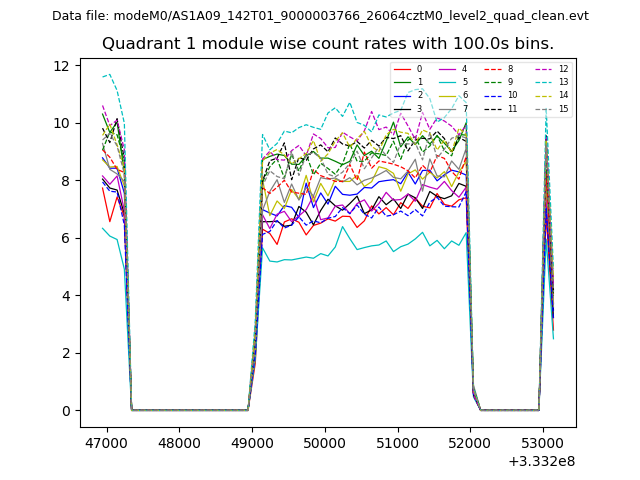
| Module-wise count rates for Quadrant A Data is divided into 100 sec bins |
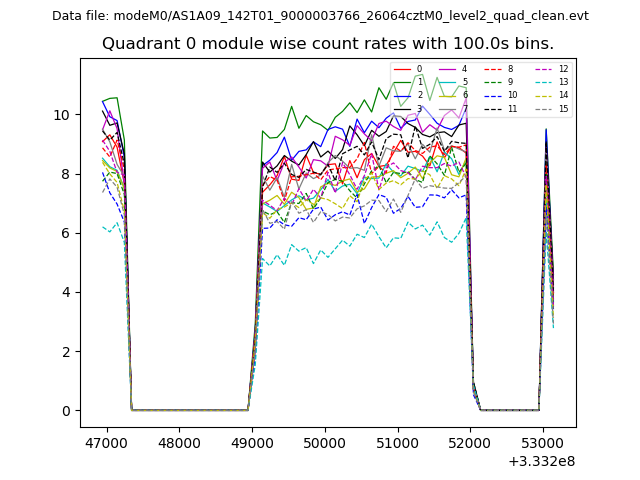 |
 |
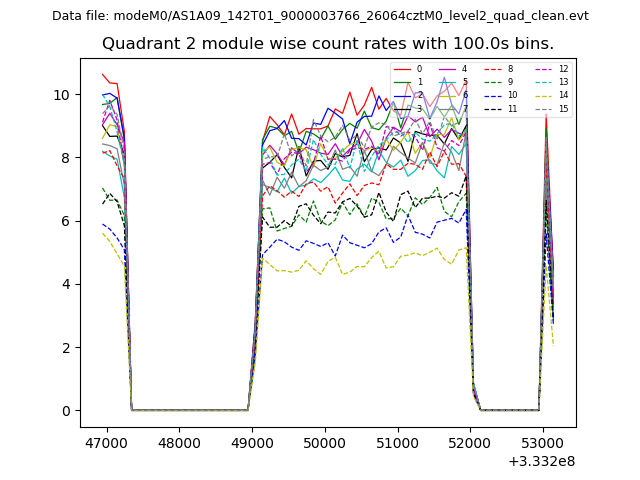
| Module-wise count rates for Quadrant B Data is divided into 100 sec bins |
 |
 |
| Module-wise count rates for Quadrant C Data is divided into 100 sec bins |
 |
 |
| Module-wise count rates for Quadrant D Data is divided into 100 sec bins |
 |
 |
| Parameter | Plot |
|---|---|
| CZT HV Monitor | 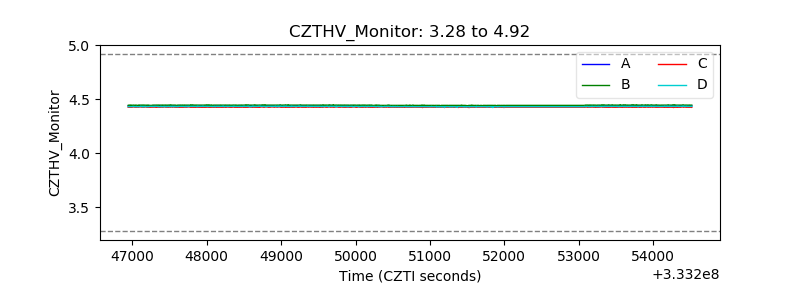 |
| D_VDD | 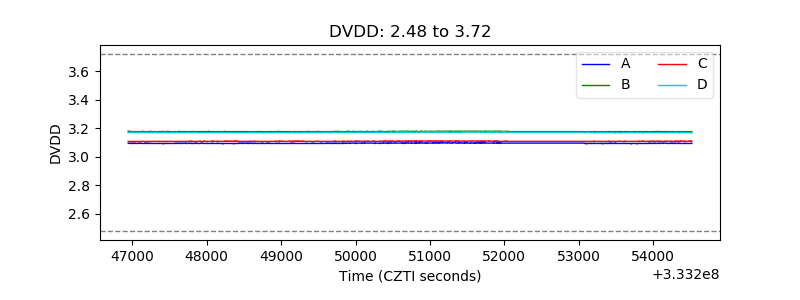 |
| Temperature 1 | 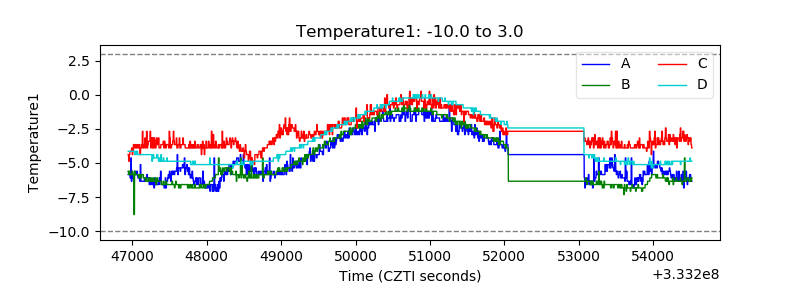 |
| Veto HV Monitor | 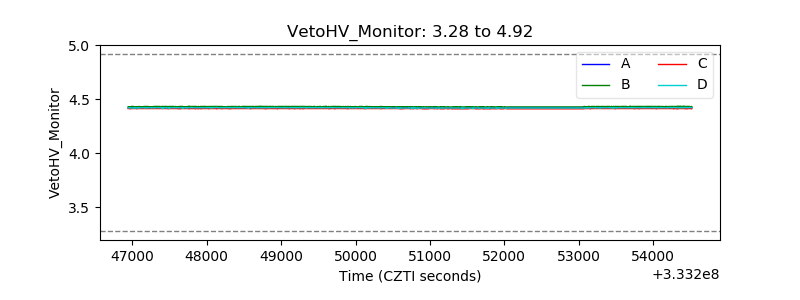 |
| Veto LLD | 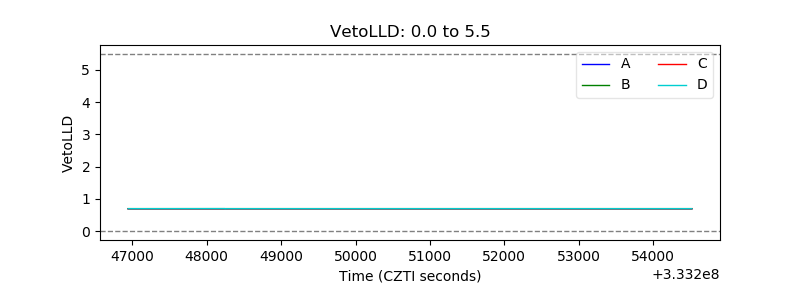 |
| Alpha Counter | 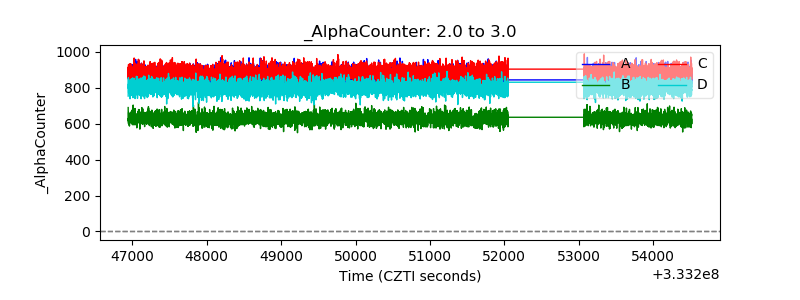 |
| _CPM_Rate | 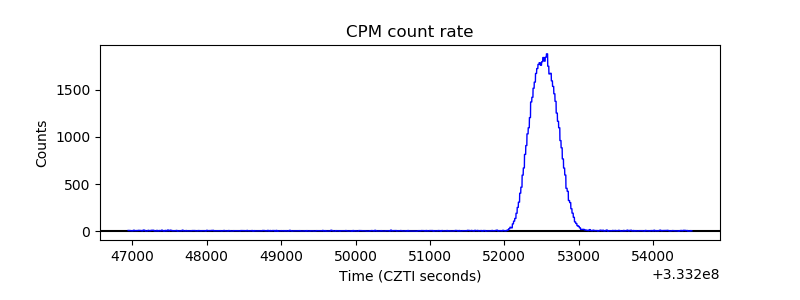 |
| CZT Counter | 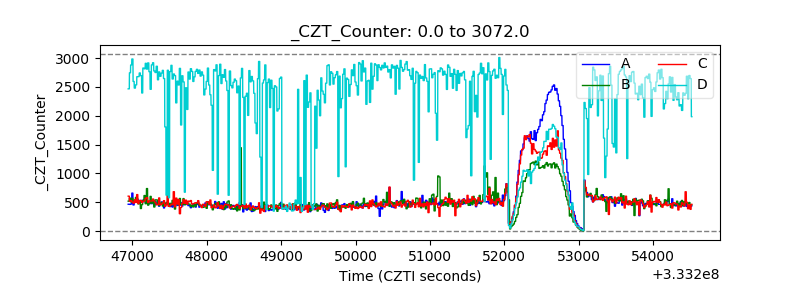 |
| +2.5 Volts monitor | 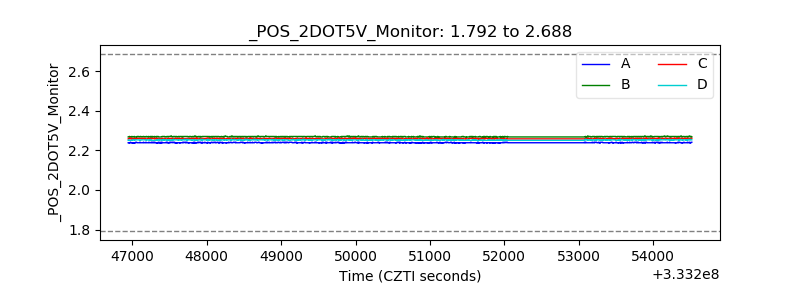 |
| +5 Volts monitor |  |
| _ROLL_ROT | 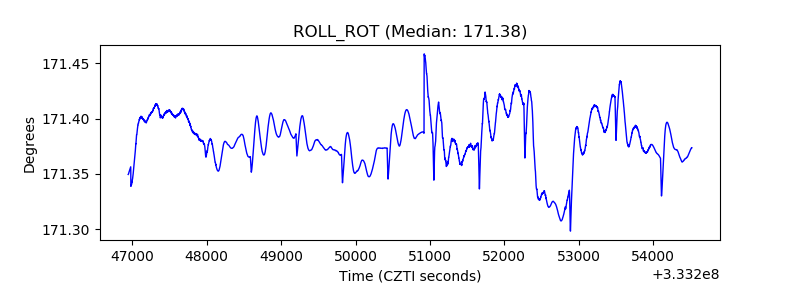 |
| _Roll_DEC | 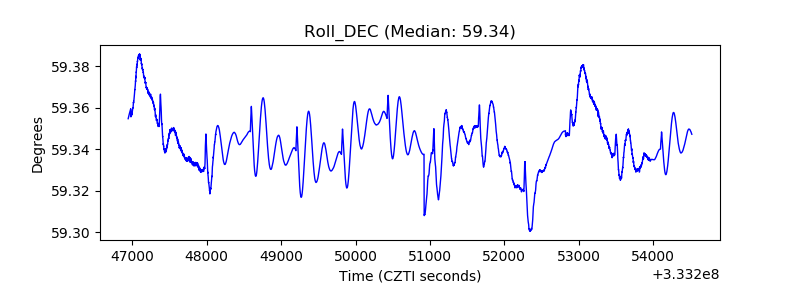 |
| _Roll_RA | 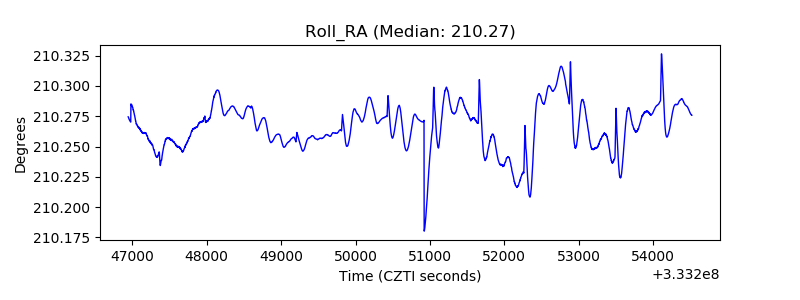 |
| Veto Counter | 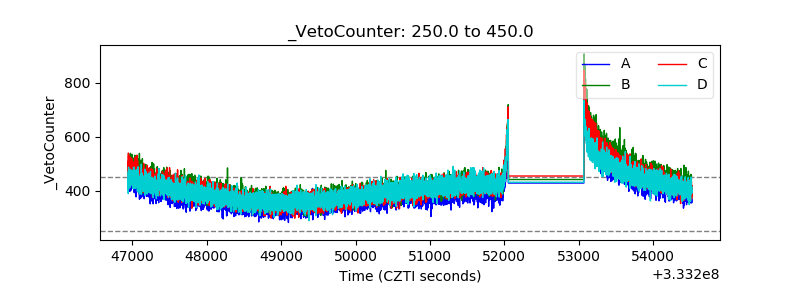 |