| Param | Original file | Final file |
|---|---|---|
| Filename | modeM0/AS1A09_138T04_9000003776_26174cztM0_level2.evt | modeM0/AS1A09_138T04_9000003776_26174cztM0_level2_quad_clean.evt |
| Size (bytes) | 513,912,960 | 91,681,920 |
| Size | 490.1 MB | 87.4 MB |
| Events in quadrant A | 3,216,471 | 584,362 |
| Events in quadrant B | 3,398,220 | 598,880 |
| Events in quadrant C | 3,348,563 | 574,120 |
| Events in quadrant D | 5,143,275 | 549,151 |
| Mode M9 | |||
|---|---|---|---|
| Quadrant | BADHDUFLAG | Total packets | Discarded packets |
| A | 0 | 5 | 0 |
| B | 0 | 5 | 0 |
| C | 0 | 5 | 0 |
| D | 0 | 5 | 0 |
| Mode M0 | |||
|---|---|---|---|
| Quadrant | BADHDUFLAG | Total packets | Discarded packets |
| A | 0 | 13783 | 0 |
| B | 0 | 14190 | 0 |
| C | 0 | 14084 | 0 |
| D | 0 | 19746 | 0 |
| Quadrant | Total seconds | Saturated seconds | Saturation percentage |
|---|---|---|---|
| A | 6744 | 144 | 2.135231% |
| B | 6745 | 155 | 2.297999% |
| C | 6745 | 173 | 2.564863% |
| D | 6745 | 538 | 7.976279% |
Noise dominated data is calculated using 1-second bins in cleaned event files. If a bin has >2000 counts, and if more than 50% of those come from <1% of pixels, then it is considered to be noise-dominated and hence unusable.
| Quadrant | # 1 sec bins | Bins with >0 counts | Bins with >2000 counts | High rate bins dominated by noise | Noise dominated (total time) | Noise dominated (detector-on time) | Marked lightcurve |
|---|---|---|---|---|---|---|---|
| A | 7158 | 6745 | 0 | 0 | 0.00% | 0.00% | 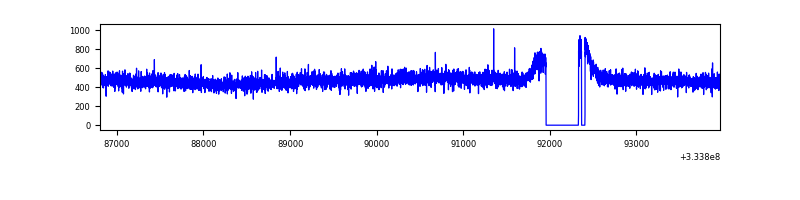 |
| B | 7160 | 6747 | 0 | 0 | 0.00% | 0.00% | 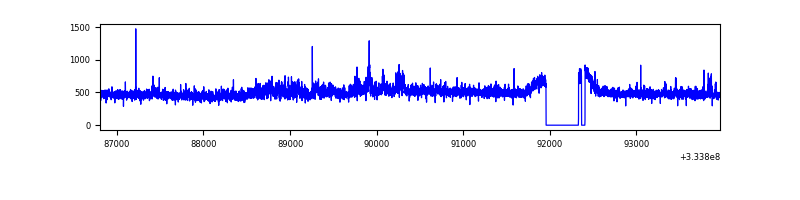 |
| C | 7160 | 6747 | 0 | 0 | 0.00% | 0.00% | 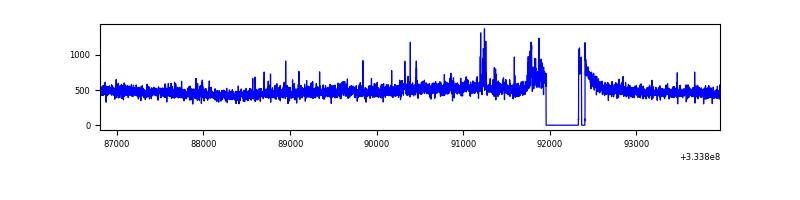 |
| D | 7160 | 6747 | 404 | 404 | 5.64% | 5.99% | 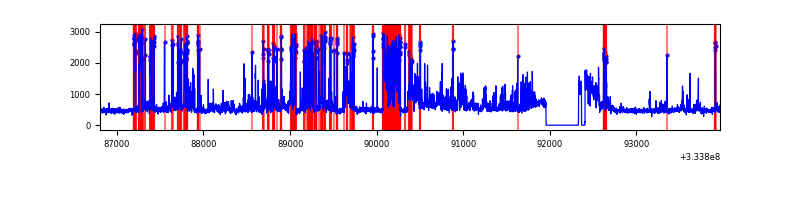 |
Top three noisy pixels from each quadrant. If the there are fewer than three noisy pixels in the level2.evt file, extra rows are filled as -1
| Pixel properties | Quadrant properties | ||||||
|---|---|---|---|---|---|---|---|
| Quadrant | DetID | PixID | Counts | Sigma | Mean | Median | Sigma |
| A | 13 | 254 | 10181 | 56.01 | 831 | 812 | 167.3 |
| A | 3 | 137 | 7636 | 40.79 | 831 | 812 | 167.3 |
| A | 0 | 226 | 7115 | 37.68 | 831 | 812 | 167.3 |
| B | 0 | 230 | 167866 | 1054.95 | 823 | 802 | 158.4 |
| B | 12 | 111 | 19530 | 118.26 | 823 | 802 | 158.4 |
| B | 11 | 111 | 17684 | 106.6 | 823 | 802 | 158.4 |
| C | 14 | 238 | 128668 | 675.95 | 801 | 806 | 189.2 |
| C | 3 | 233 | 68672 | 358.78 | 801 | 806 | 189.2 |
| C | 2 | 16 | 34177 | 176.42 | 801 | 806 | 189.2 |
| D | 1 | 52 | 2096356 | 11118.67 | 793 | 776 | 188.5 |
| D | 2 | 234 | 31960 | 165.46 | 793 | 776 | 188.5 |
| D | 12 | 233 | 24418 | 125.44 | 793 | 776 | 188.5 |
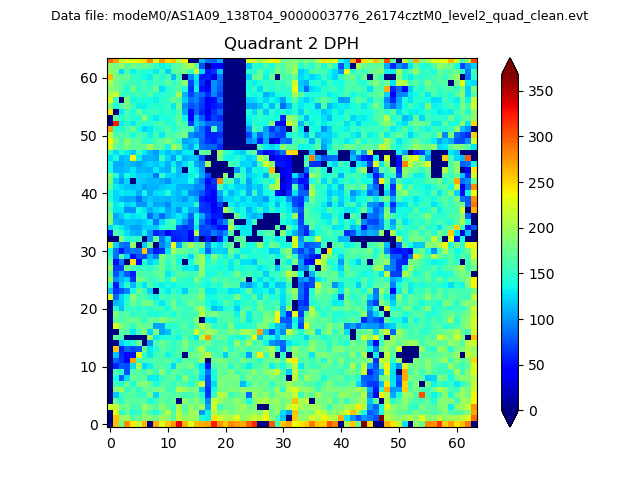
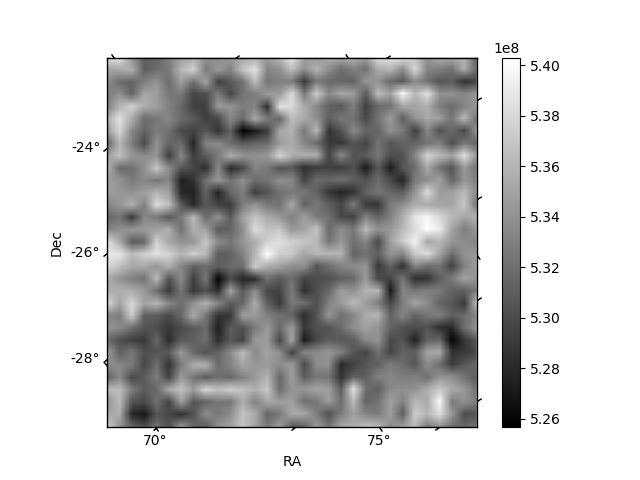
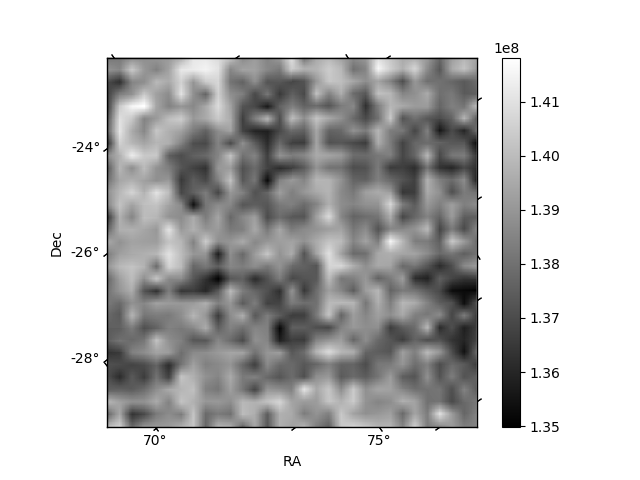
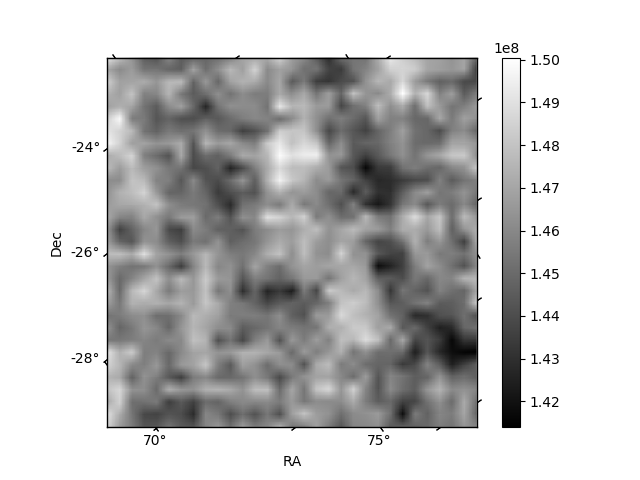
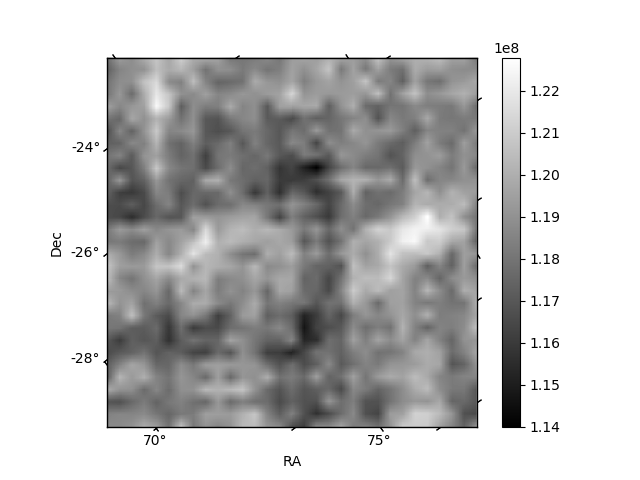
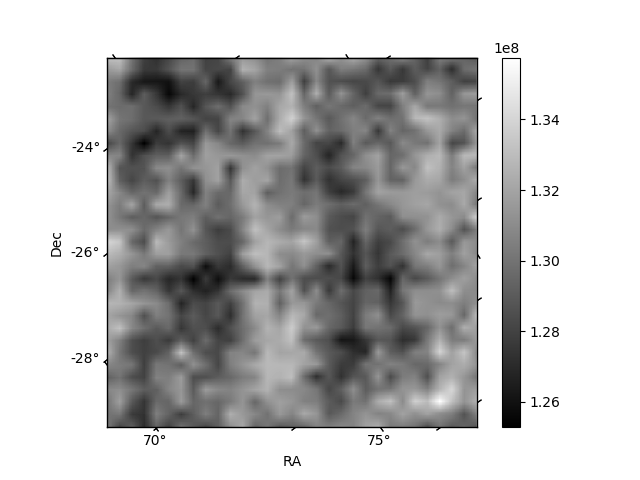
Histogram calculated using DETX and DETY for each event in the final _common_clean file
| Quadrant A | 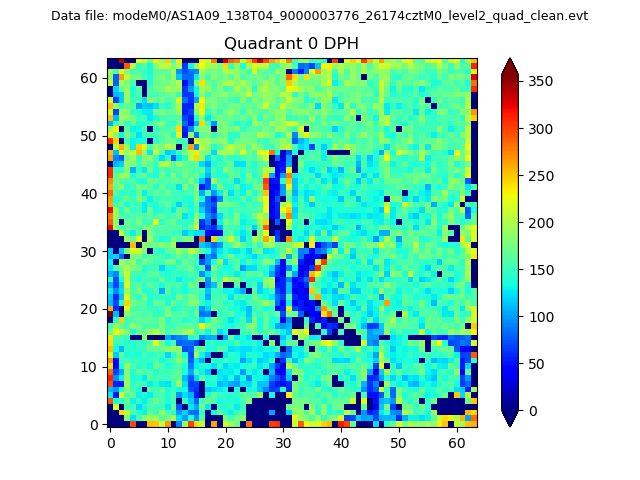 |
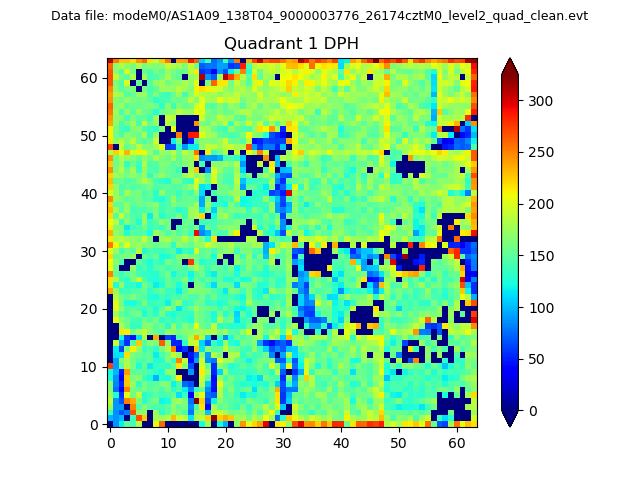 |
Quadrant B |
|---|---|---|---|
| Quadrant D | 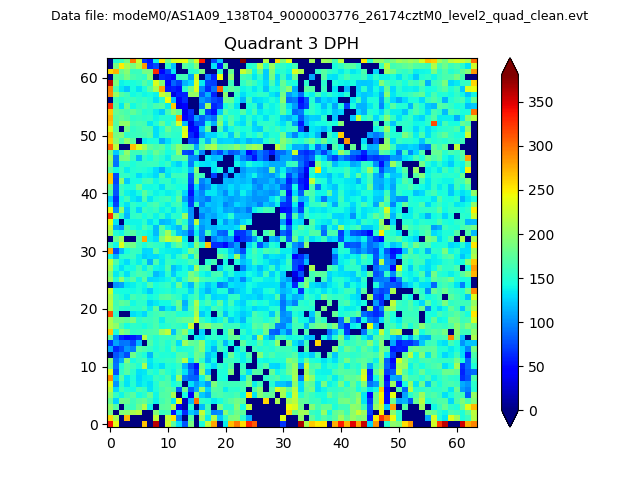 |
 |
Quadrant C |
| Plot type | Count rate plots | Images |
|---|---|---|
| Comparison with Poisson distribution Blue bars denote a histogram of data divided into 1 sec bins. Red curve is a Poisson curve with rate = median count rate of data. |
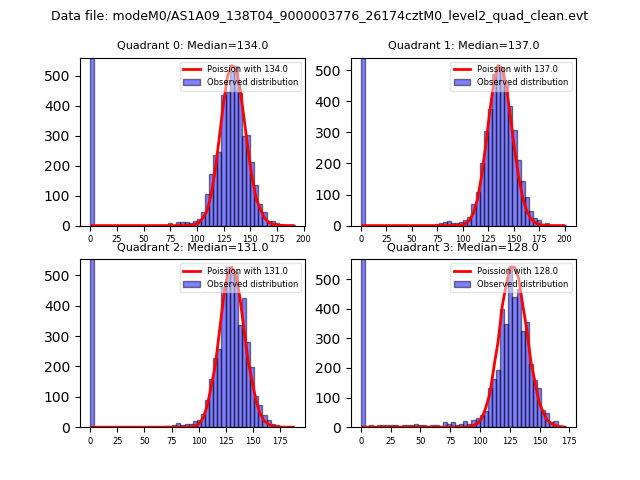 |
 |
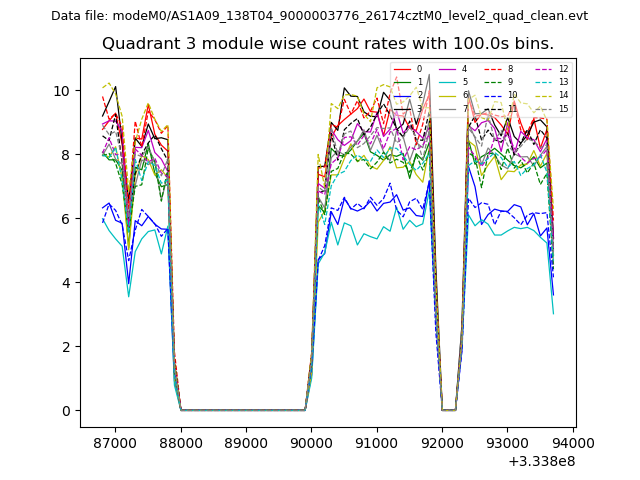
| Quadrant-wise count rates Data is divided into 100 sec bins |
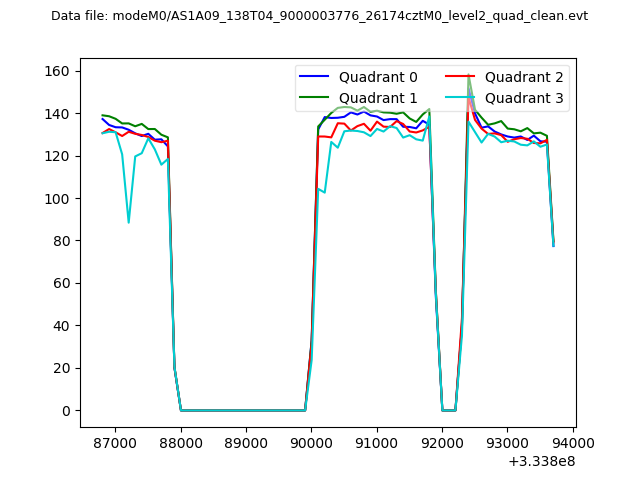 |
|
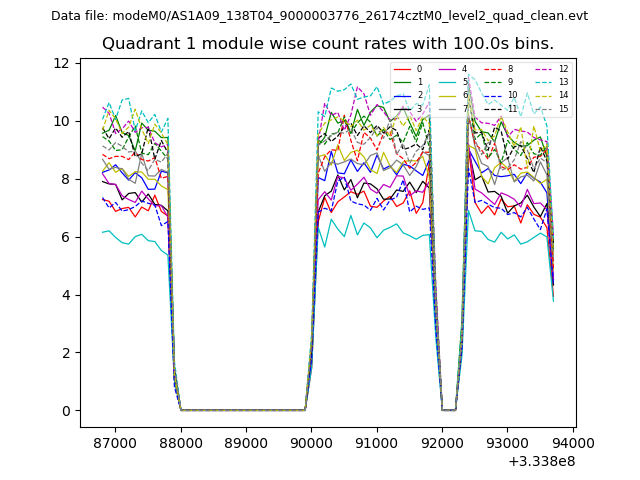
| Module-wise count rates for Quadrant A Data is divided into 100 sec bins |
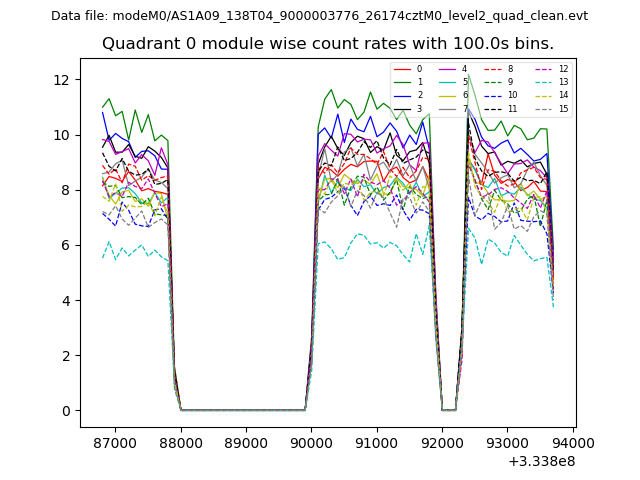 |
 |
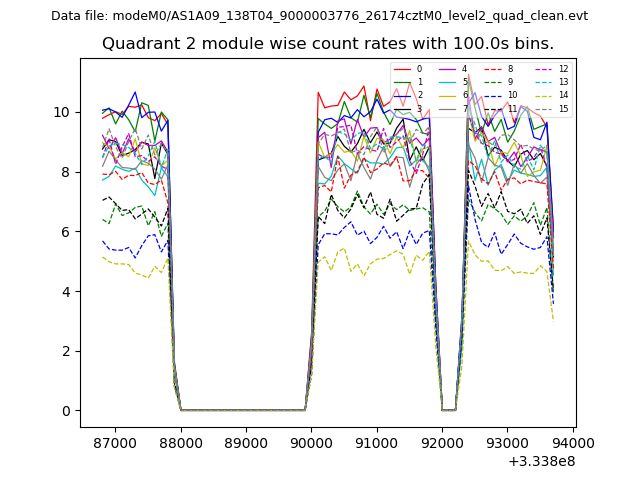
| Module-wise count rates for Quadrant B Data is divided into 100 sec bins |
 |
 |
| Module-wise count rates for Quadrant C Data is divided into 100 sec bins |
 |
 |
| Module-wise count rates for Quadrant D Data is divided into 100 sec bins |
 |
 |
| Parameter | Plot |
|---|---|
| CZT HV Monitor | 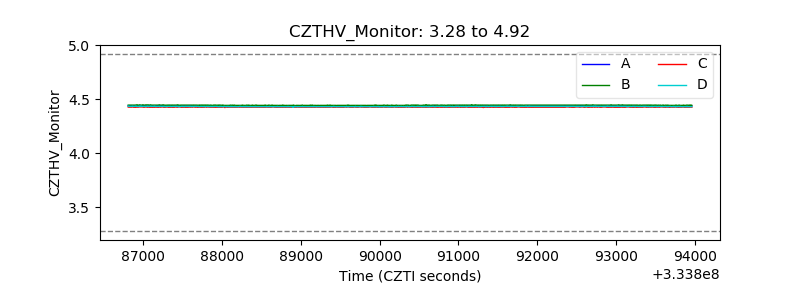 |
| D_VDD | 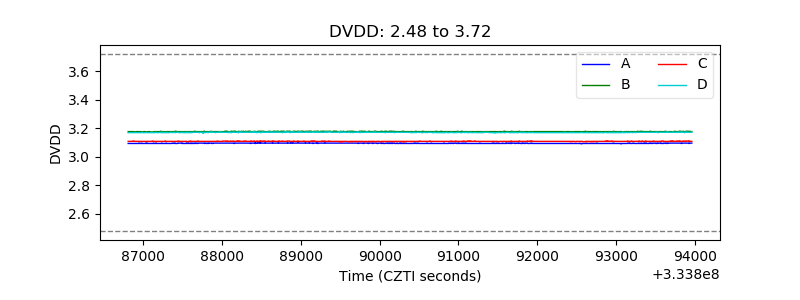 |
| Temperature 1 | 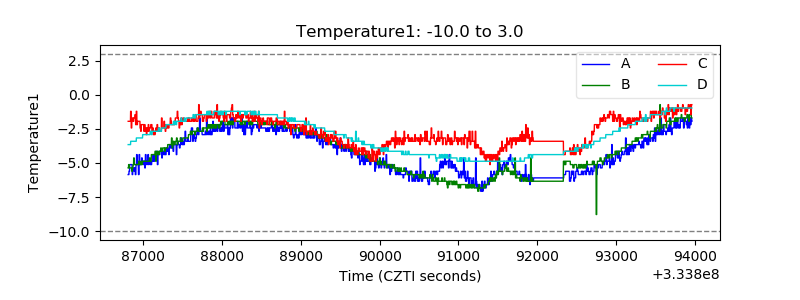 |
| Veto HV Monitor |  |
| Veto LLD | 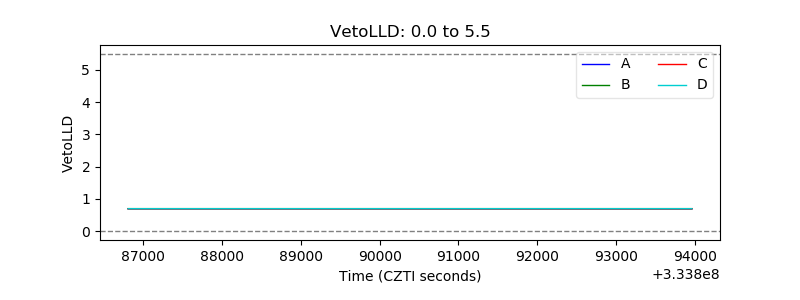 |
| Alpha Counter | 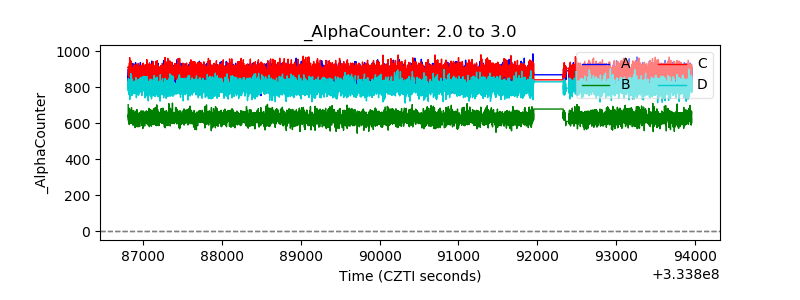 |
| _CPM_Rate |  |
| CZT Counter | 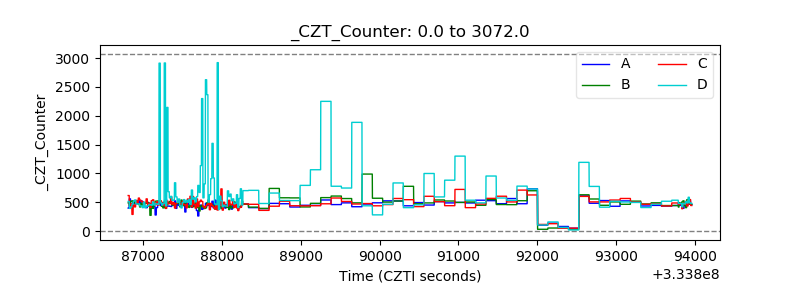 |
| +2.5 Volts monitor |  |
| +5 Volts monitor |  |
| _ROLL_ROT | 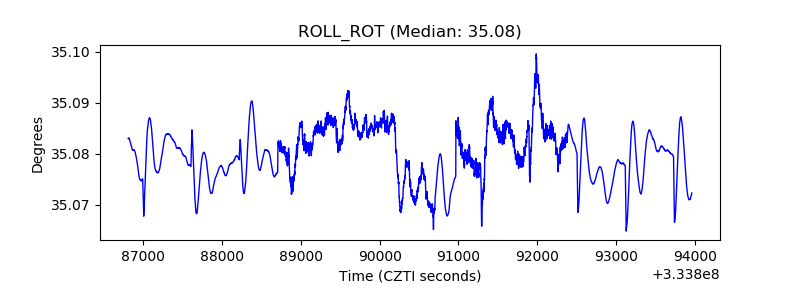 |
| _Roll_DEC | 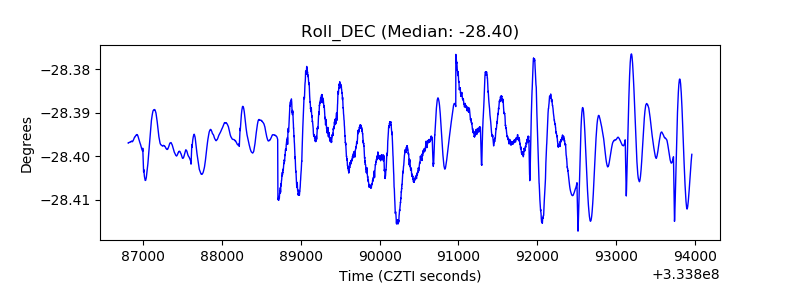 |
| _Roll_RA | 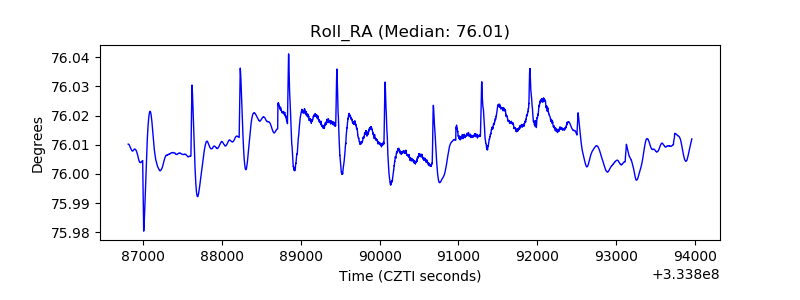 |
| Veto Counter | 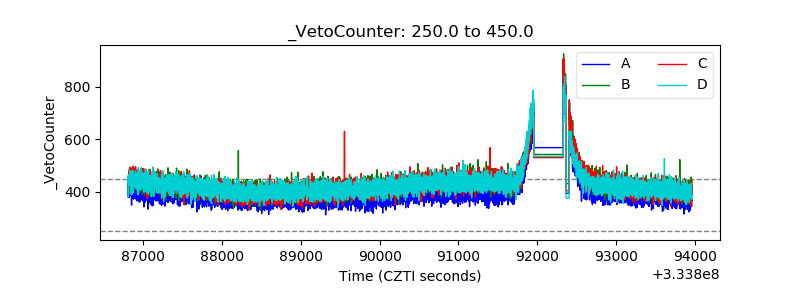 |