| Param | Original file | Final file |
|---|---|---|
| Filename | modeM0/AS1A09_012T02_9000003780_26182cztM0_level2.evt | modeM0/AS1A09_012T02_9000003780_26182cztM0_level2_quad_clean.evt |
| Size (bytes) | 408,133,440 | 101,926,080 |
| Size | 389.2 MB | 97.2 MB |
| Events in quadrant A | 2,386,321 | 695,129 |
| Events in quadrant B | 2,513,296 | 712,227 |
| Events in quadrant C | 2,551,059 | 690,076 |
| Events in quadrant D | 4,567,857 | 636,993 |
| Mode M0 | |||
|---|---|---|---|
| Quadrant | BADHDUFLAG | Total packets | Discarded packets |
| A | 0 | 10371 | 0 |
| B | 0 | 10782 | 0 |
| C | 0 | 10672 | 0 |
| D | 0 | 16980 | 0 |
| Mode M9 | |||
|---|---|---|---|
| Quadrant | BADHDUFLAG | Total packets | Discarded packets |
| A | 0 | 12 | 0 |
| B | 0 | 12 | 0 |
| C | 0 | 12 | 0 |
| D | 0 | 12 | 0 |
| Quadrant | Total seconds | Saturated seconds | Saturation percentage |
|---|---|---|---|
| A | 5027 | 22 | 0.437637% |
| B | 5027 | 31 | 0.616670% |
| C | 5027 | 47 | 0.934951% |
| D | 5027 | 498 | 9.906505% |
Noise dominated data is calculated using 1-second bins in cleaned event files. If a bin has >2000 counts, and if more than 50% of those come from <1% of pixels, then it is considered to be noise-dominated and hence unusable.
| Quadrant | # 1 sec bins | Bins with >0 counts | Bins with >2000 counts | High rate bins dominated by noise | Noise dominated (total time) | Noise dominated (detector-on time) | Marked lightcurve |
|---|---|---|---|---|---|---|---|
| A | 6172 | 5028 | 0 | 0 | 0.00% | 0.00% | 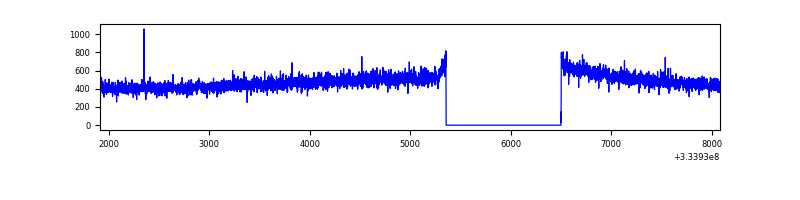 |
| B | 6172 | 5028 | 0 | 0 | 0.00% | 0.00% | 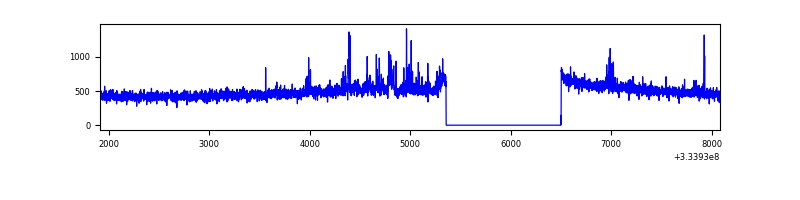 |
| C | 6172 | 5028 | 0 | 0 | 0.00% | 0.00% | 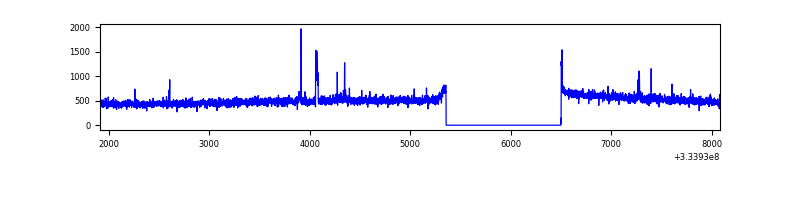 |
| D | 6172 | 5028 | 472 | 472 | 7.65% | 9.39% | 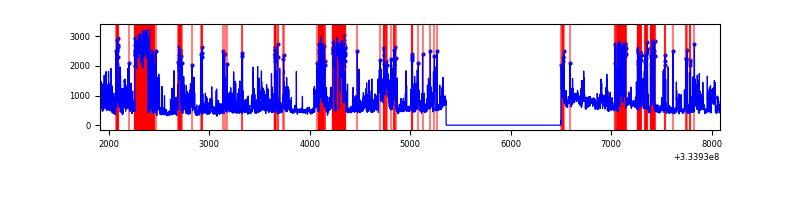 |
Top three noisy pixels from each quadrant. If the there are fewer than three noisy pixels in the level2.evt file, extra rows are filled as -1
| Pixel properties | Quadrant properties | ||||||
|---|---|---|---|---|---|---|---|
| Quadrant | DetID | PixID | Counts | Sigma | Mean | Median | Sigma |
| A | 13 | 254 | 8635 | 65.13 | 618 | 605 | 123.3 |
| A | 3 | 137 | 5405 | 38.93 | 618 | 605 | 123.3 |
| A | 0 | 226 | 5190 | 37.19 | 618 | 605 | 123.3 |
| B | 0 | 190 | 41302 | 352.01 | 617 | 599 | 115.6 |
| B | 3 | 112 | 34312 | 291.56 | 617 | 599 | 115.6 |
| B | 0 | 230 | 27171 | 229.8 | 617 | 599 | 115.6 |
| C | 14 | 238 | 98443 | 688.37 | 609 | 614 | 142.1 |
| C | 3 | 233 | 55296 | 384.77 | 609 | 614 | 142.1 |
| C | 2 | 16 | 12166 | 81.28 | 609 | 614 | 142.1 |
| D | 1 | 52 | 2313882 | 16879.44 | 581 | 569 | 137.0 |
| D | 12 | 233 | 24085 | 171.59 | 581 | 569 | 137.0 |
| D | 2 | 234 | 22205 | 157.87 | 581 | 569 | 137.0 |
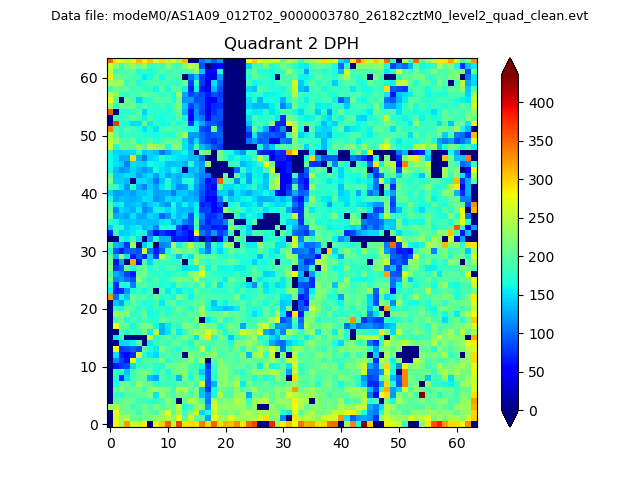
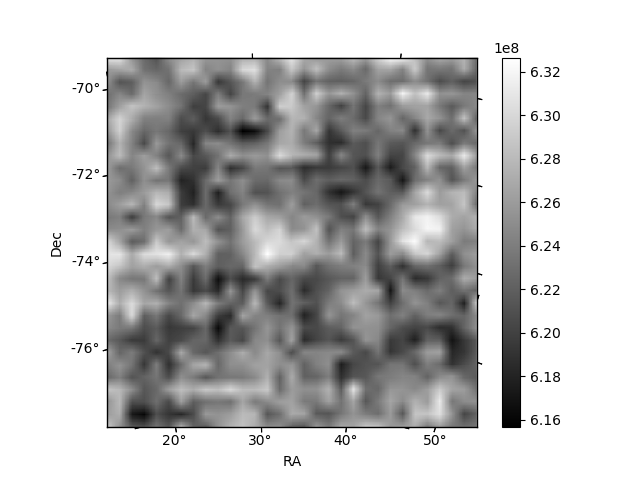
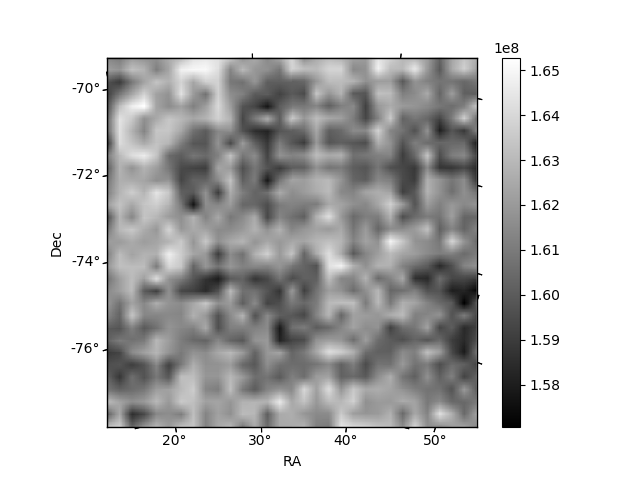
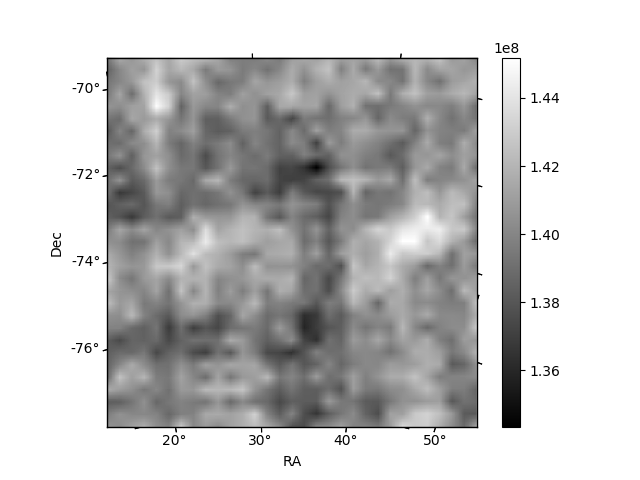
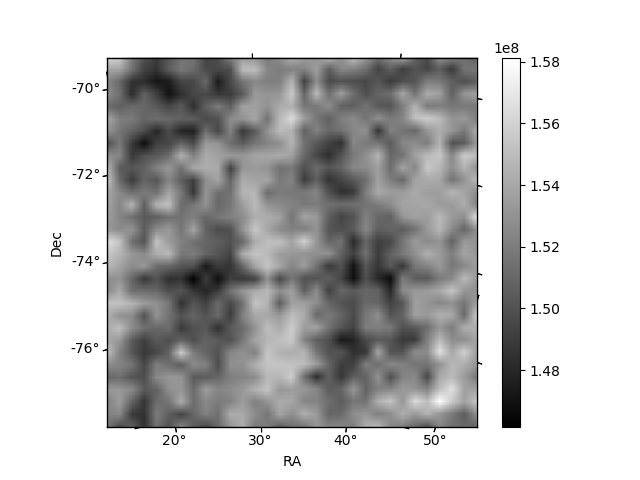
Histogram calculated using DETX and DETY for each event in the final _common_clean file
| Quadrant A | 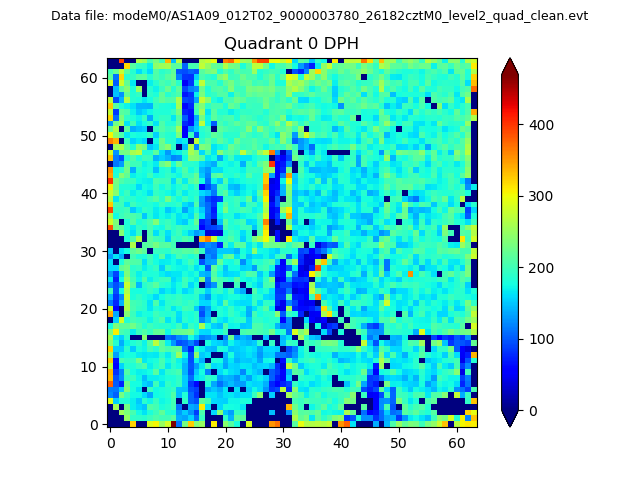 |
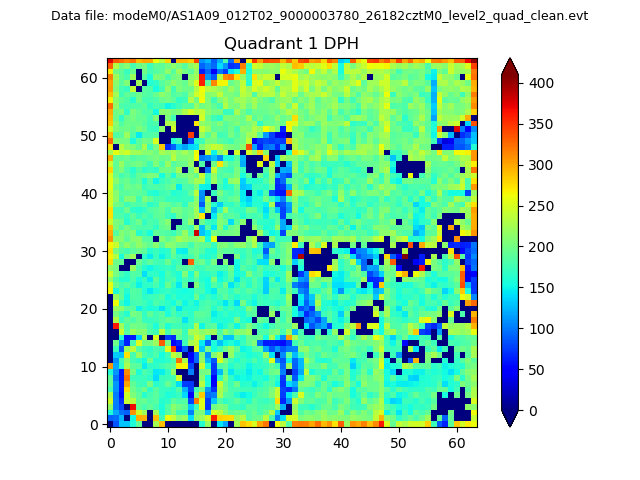 |
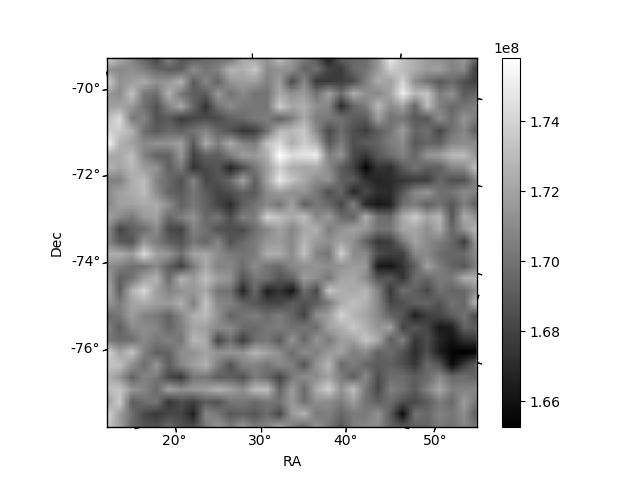
Quadrant B |
|---|---|---|---|
| Quadrant D | 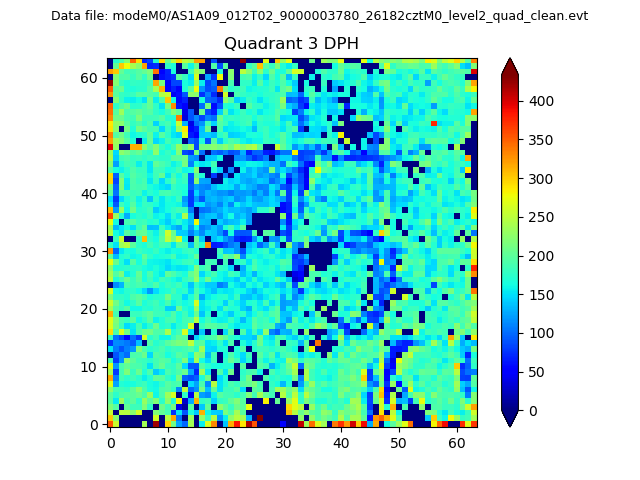 |
 |
Quadrant C |
| Plot type | Count rate plots | Images |
|---|---|---|
| Comparison with Poisson distribution Blue bars denote a histogram of data divided into 1 sec bins. Red curve is a Poisson curve with rate = median count rate of data. |
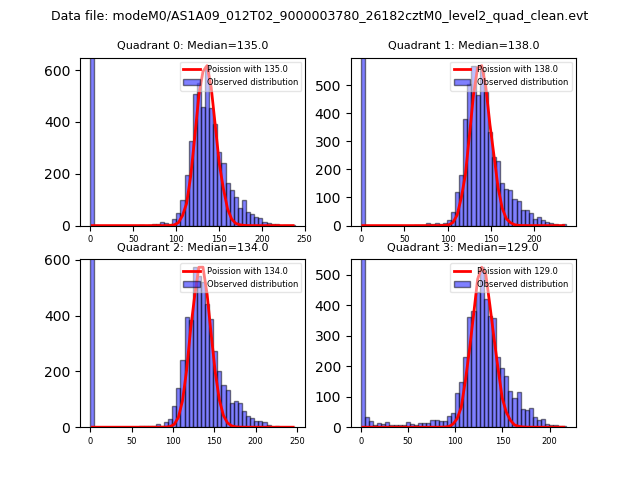 |
 |
| Quadrant-wise count rates Data is divided into 100 sec bins |
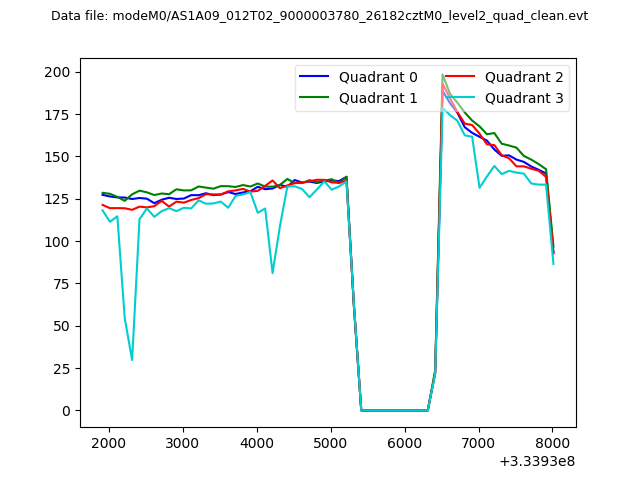 |
|
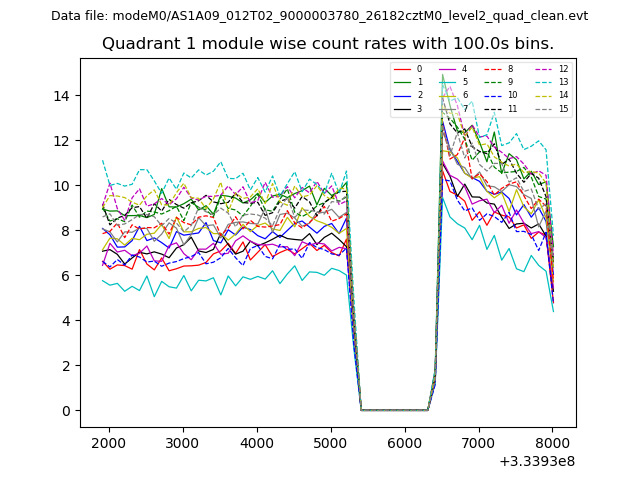
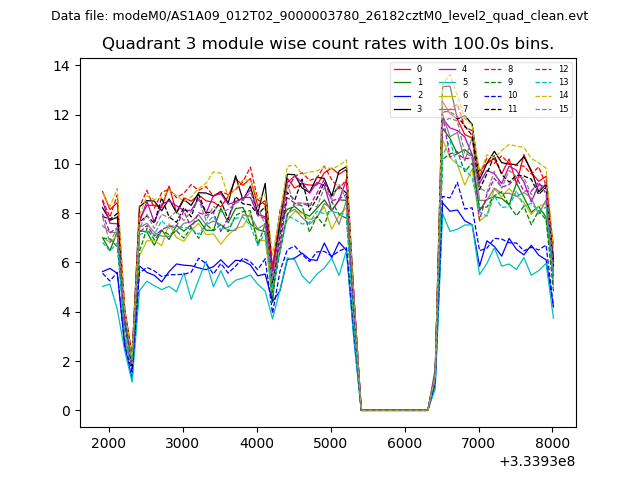
| Module-wise count rates for Quadrant A Data is divided into 100 sec bins |
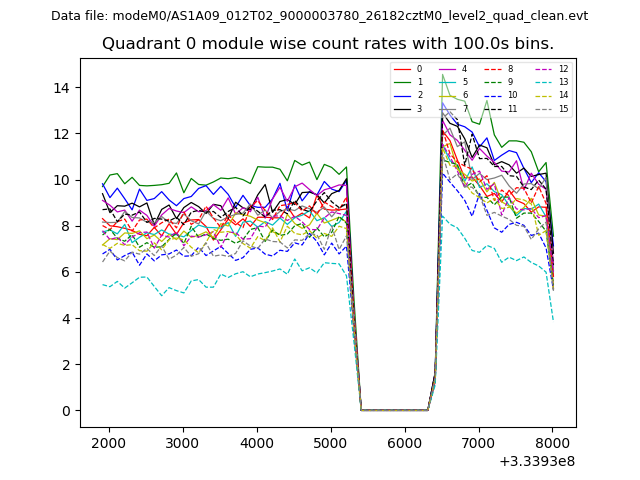 |
 |
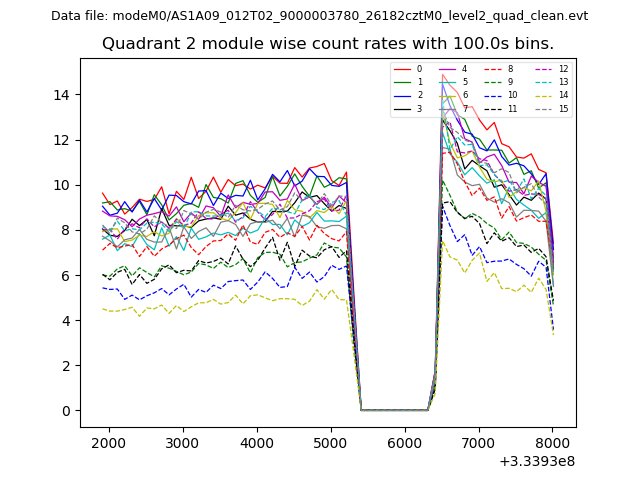
| Module-wise count rates for Quadrant B Data is divided into 100 sec bins |
 |
 |
| Module-wise count rates for Quadrant C Data is divided into 100 sec bins |
 |
 |
| Module-wise count rates for Quadrant D Data is divided into 100 sec bins |
 |
 |
| Parameter | Plot |
|---|---|
| CZT HV Monitor | 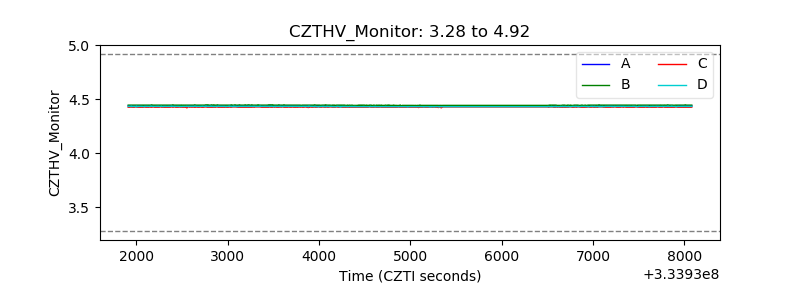 |
| D_VDD | 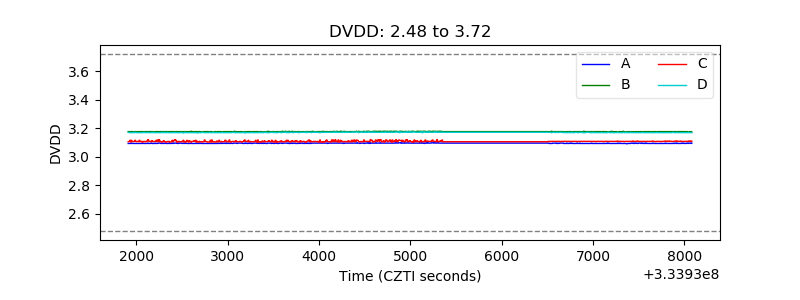 |
| Temperature 1 | 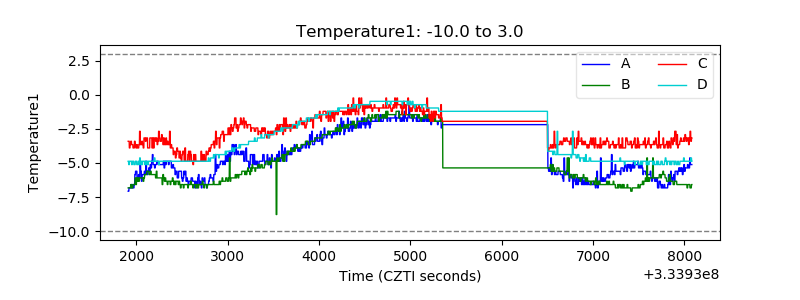 |
| Veto HV Monitor | 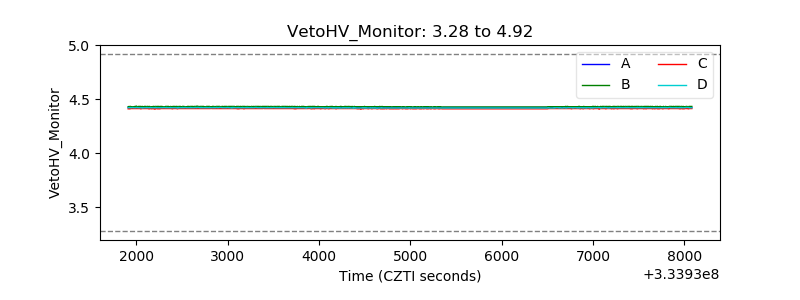 |
| Veto LLD | 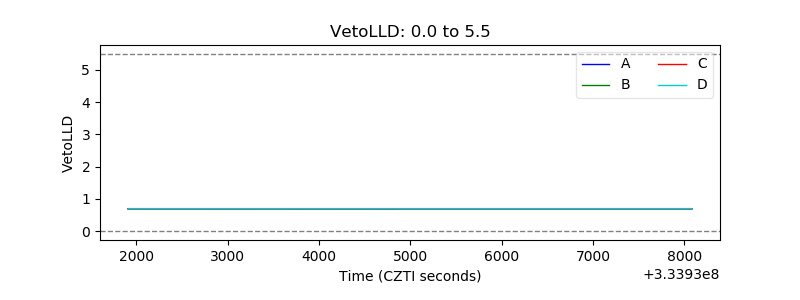 |
| Alpha Counter | 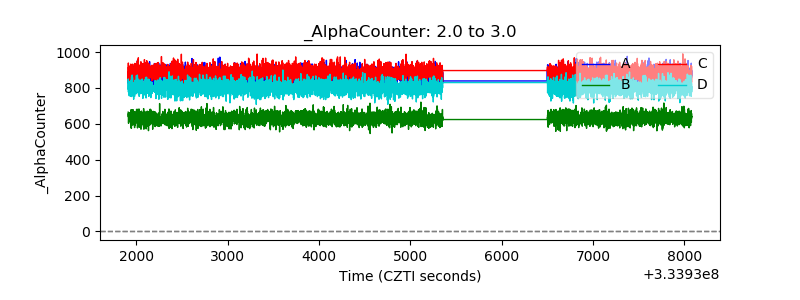 |
| _CPM_Rate | 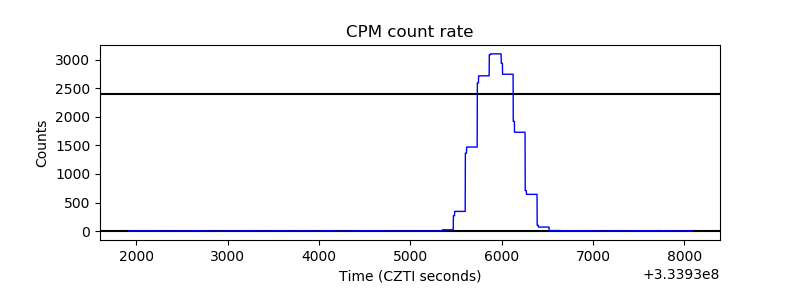 |
| CZT Counter | 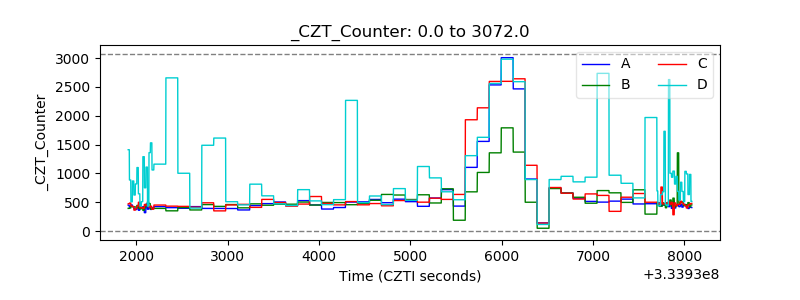 |
| +2.5 Volts monitor | 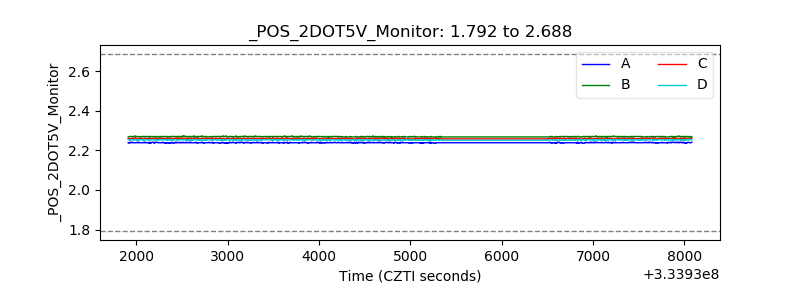 |
| +5 Volts monitor |  |
| _ROLL_ROT | 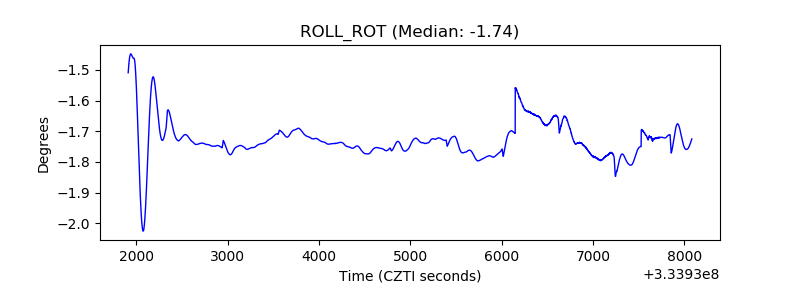 |
| _Roll_DEC |  |
| _Roll_RA | 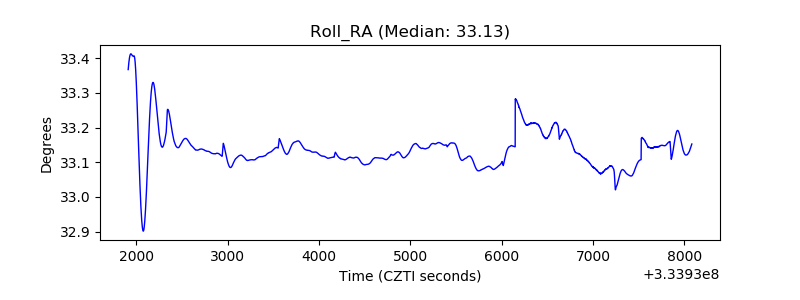 |
| Veto Counter | 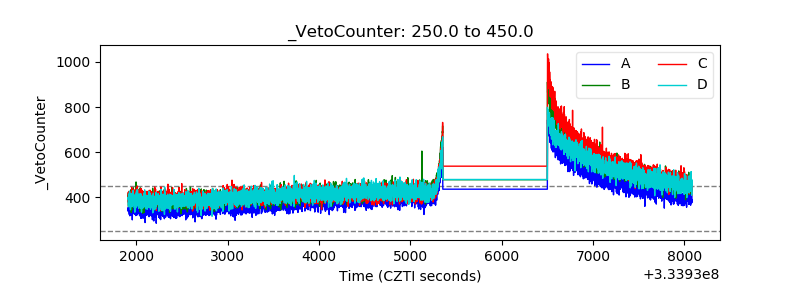 |