| Param | Original file | Final file |
|---|---|---|
| Filename | modeM0/AS1A09_079T03_9000003790_26232cztM0_level2.evt | modeM0/AS1A09_079T03_9000003790_26232cztM0_level2_quad_clean.evt |
| Size (bytes) | 441,455,040 | 87,491,520 |
| Size | 421.0 MB | 83.4 MB |
| Events in quadrant A | 3,019,532 | 548,551 |
| Events in quadrant B | 3,035,154 | 567,862 |
| Events in quadrant C | 3,232,950 | 551,578 |
| Events in quadrant D | 3,646,204 | 534,767 |
| Mode M0 | |||
|---|---|---|---|
| Quadrant | BADHDUFLAG | Total packets | Discarded packets |
| A | 0 | 13115 | 0 |
| B | 0 | 13137 | 0 |
| C | 0 | 13807 | 0 |
| D | 0 | 15203 | 0 |
| Mode M9 | |||
|---|---|---|---|
| Quadrant | BADHDUFLAG | Total packets | Discarded packets |
| A | 0 | 4 | 0 |
| B | 0 | 4 | 0 |
| C | 0 | 4 | 0 |
| D | 0 | 4 | 0 |
| Quadrant | Total seconds | Saturated seconds | Saturation percentage |
|---|---|---|---|
| A | 6403 | 130 | 2.030298% |
| B | 6404 | 127 | 1.983136% |
| C | 6404 | 135 | 2.108057% |
| D | 6404 | 215 | 3.357277% |
Noise dominated data is calculated using 1-second bins in cleaned event files. If a bin has >2000 counts, and if more than 50% of those come from <1% of pixels, then it is considered to be noise-dominated and hence unusable.
| Quadrant | # 1 sec bins | Bins with >0 counts | Bins with >2000 counts | High rate bins dominated by noise | Noise dominated (total time) | Noise dominated (detector-on time) | Marked lightcurve |
|---|---|---|---|---|---|---|---|
| A | 6798 | 6404 | 0 | 0 | 0.00% | 0.00% | 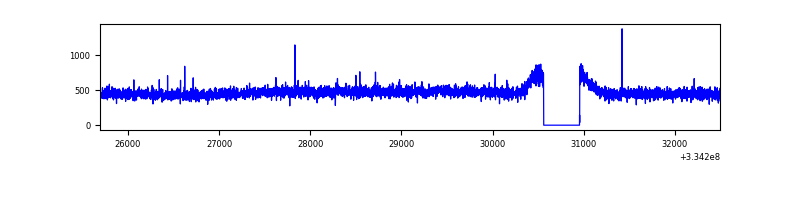 |
| B | 6799 | 6405 | 0 | 0 | 0.00% | 0.00% | 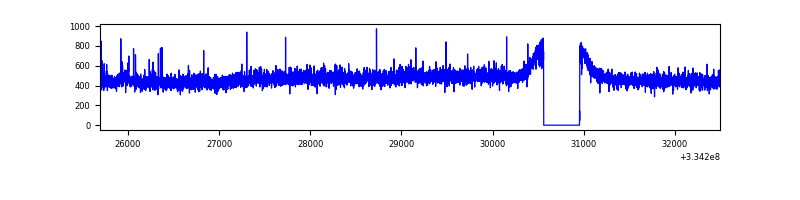 |
| C | 6799 | 6405 | 0 | 0 | 0.00% | 0.00% | 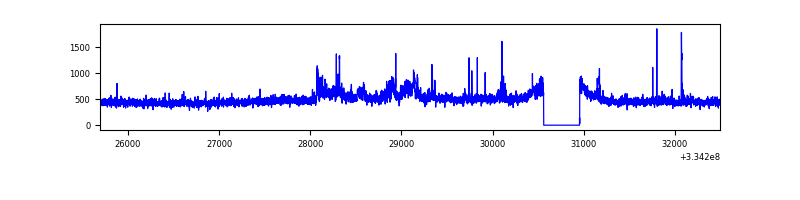 |
| D | 6799 | 6405 | 115 | 115 | 1.69% | 1.80% | 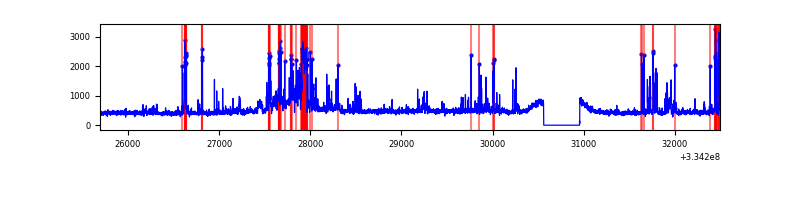 |
Top three noisy pixels from each quadrant. If the there are fewer than three noisy pixels in the level2.evt file, extra rows are filled as -1
| Pixel properties | Quadrant properties | ||||||
|---|---|---|---|---|---|---|---|
| Quadrant | DetID | PixID | Counts | Sigma | Mean | Median | Sigma |
| A | 0 | 13 | 24165 | 149.76 | 774 | 757 | 156.3 |
| A | 6 | 16 | 11266 | 67.23 | 774 | 757 | 156.3 |
| A | 13 | 254 | 9606 | 56.61 | 774 | 757 | 156.3 |
| B | 12 | 111 | 18214 | 116.68 | 770 | 749 | 149.7 |
| B | 11 | 111 | 15856 | 100.93 | 770 | 749 | 149.7 |
| B | 0 | 230 | 14701 | 93.21 | 770 | 749 | 149.7 |
| C | 2 | 16 | 141796 | 807.42 | 741 | 745 | 174.7 |
| C | 14 | 238 | 117744 | 669.74 | 741 | 745 | 174.7 |
| C | 3 | 233 | 85092 | 482.83 | 741 | 745 | 174.7 |
| D | 1 | 52 | 675204 | 3740.7 | 745 | 725 | 180.3 |
| D | 12 | 233 | 122171 | 673.55 | 745 | 725 | 180.3 |
| D | 2 | 234 | 25928 | 139.78 | 745 | 725 | 180.3 |
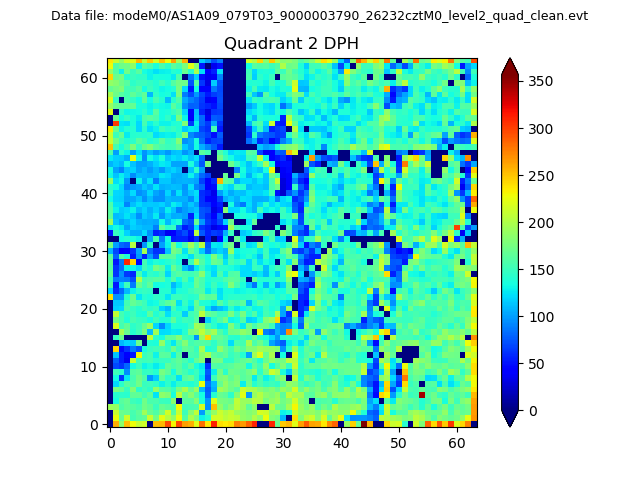
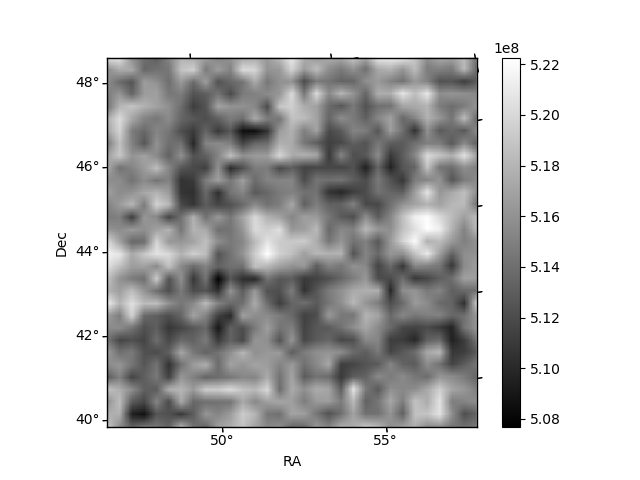
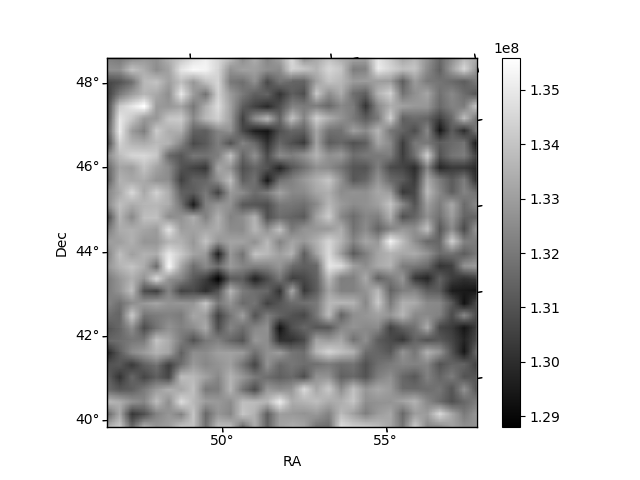
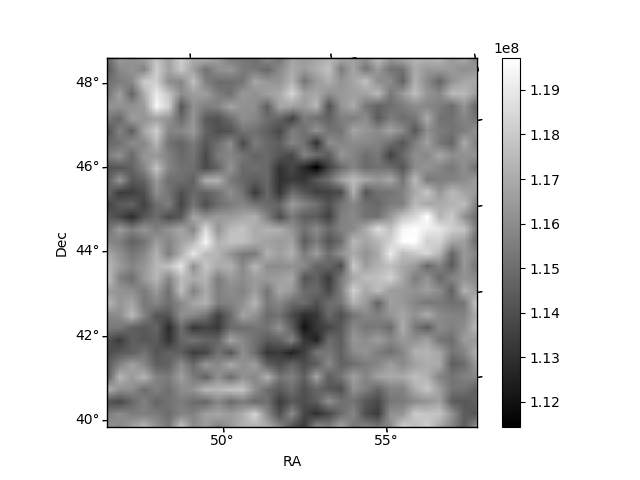
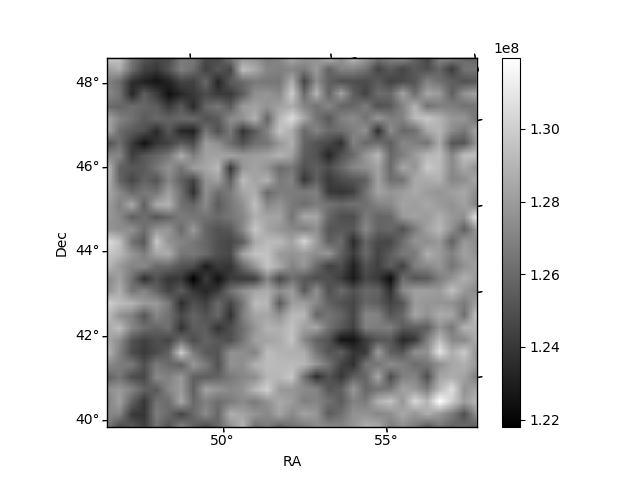
Histogram calculated using DETX and DETY for each event in the final _common_clean file
| Quadrant A | 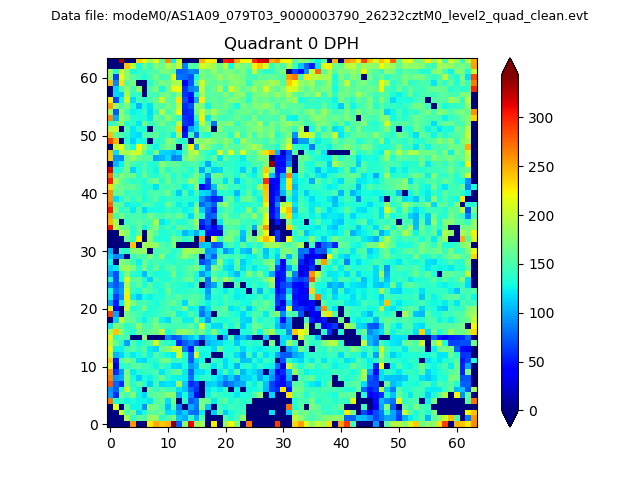 |
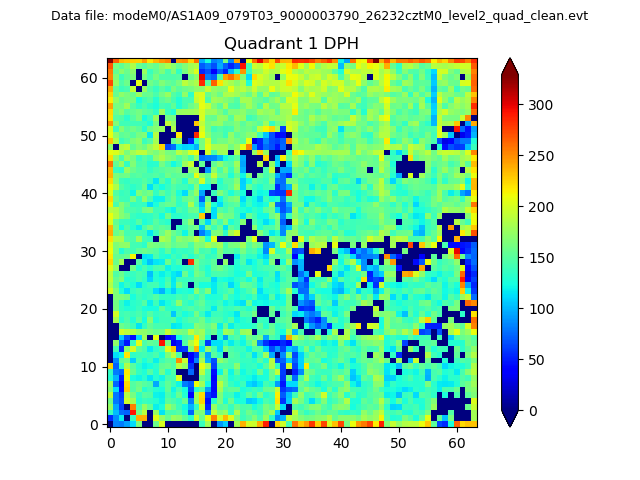 |
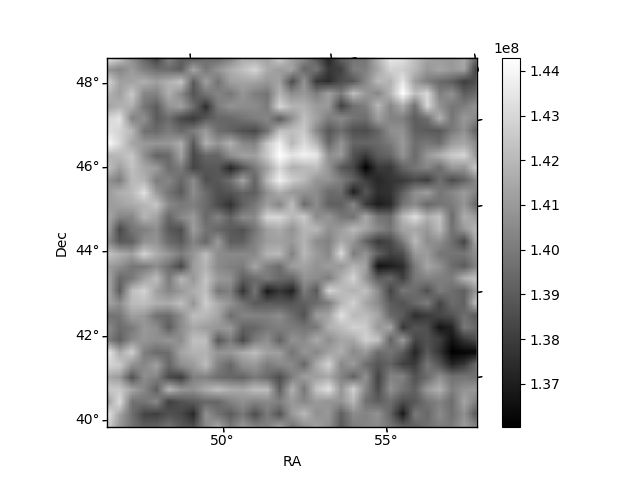
Quadrant B |
|---|---|---|---|
| Quadrant D | 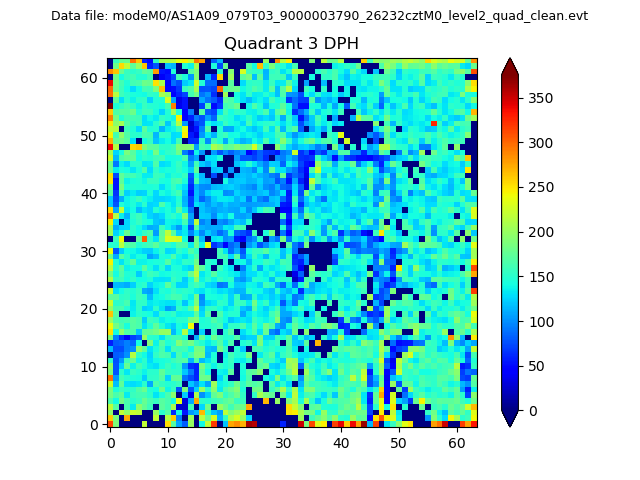 |
 |
Quadrant C |
| Plot type | Count rate plots | Images |
|---|---|---|
| Comparison with Poisson distribution Blue bars denote a histogram of data divided into 1 sec bins. Red curve is a Poisson curve with rate = median count rate of data. |
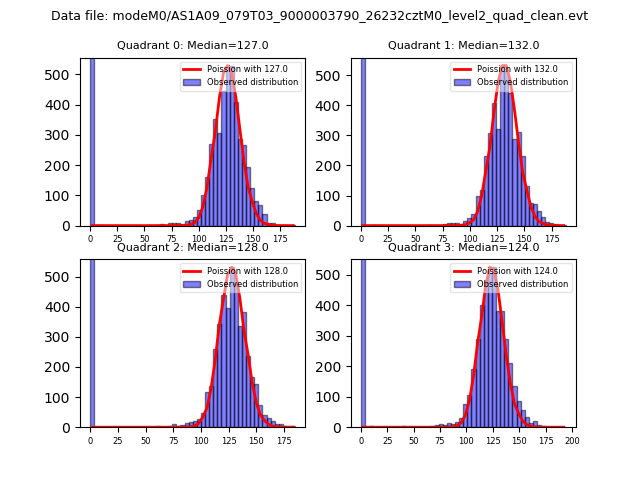 |
 |
| Quadrant-wise count rates Data is divided into 100 sec bins |
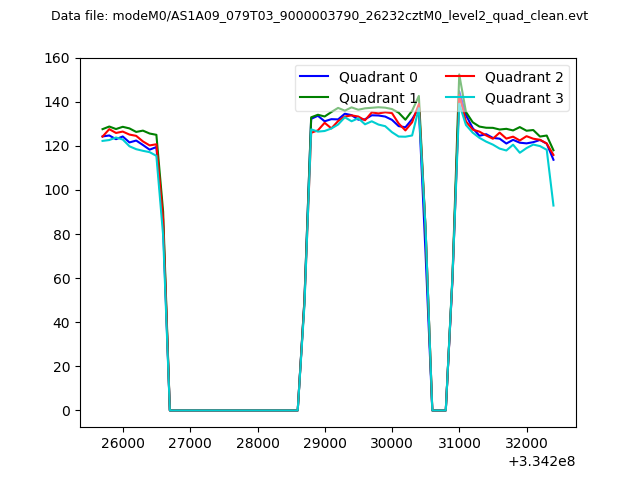 |
|
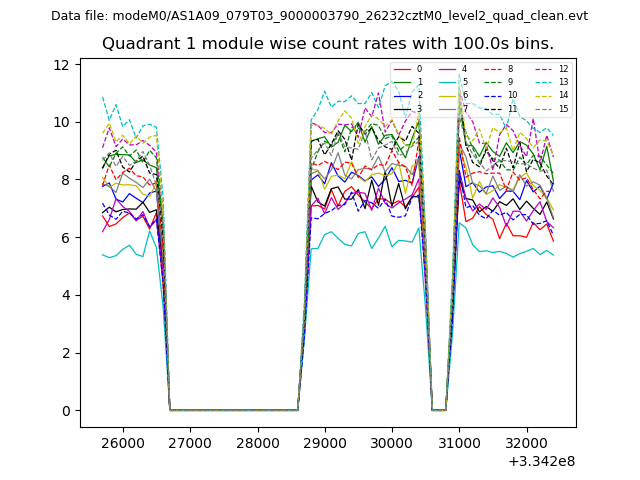
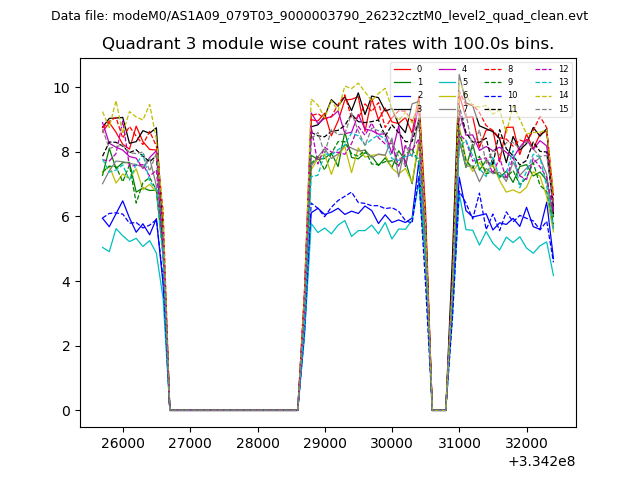
| Module-wise count rates for Quadrant A Data is divided into 100 sec bins |
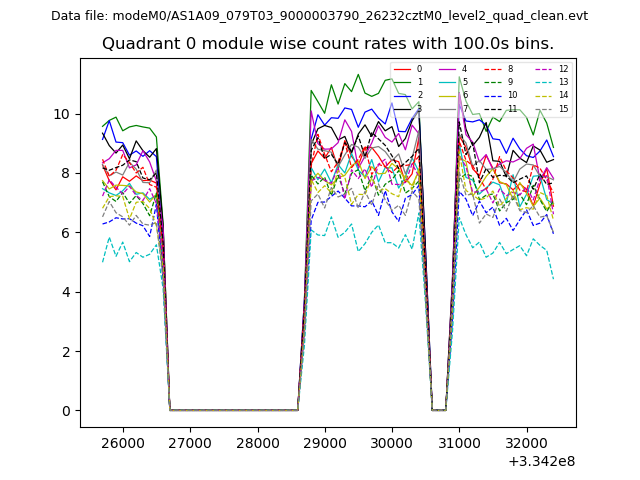 |
 |
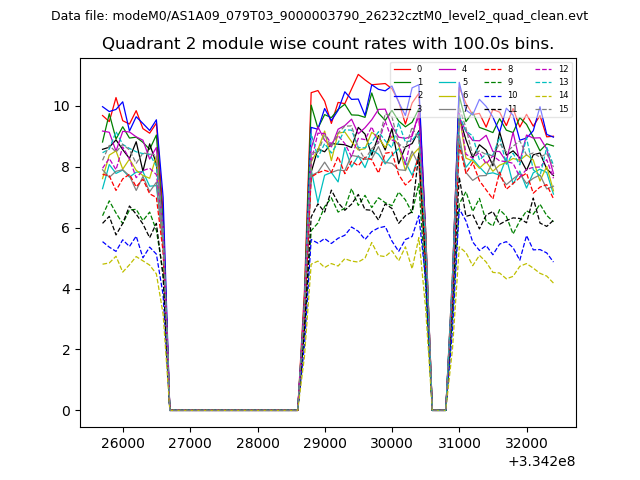
| Module-wise count rates for Quadrant B Data is divided into 100 sec bins |
 |
 |
| Module-wise count rates for Quadrant C Data is divided into 100 sec bins |
 |
 |
| Module-wise count rates for Quadrant D Data is divided into 100 sec bins |
 |
 |
| Parameter | Plot |
|---|---|
| CZT HV Monitor | 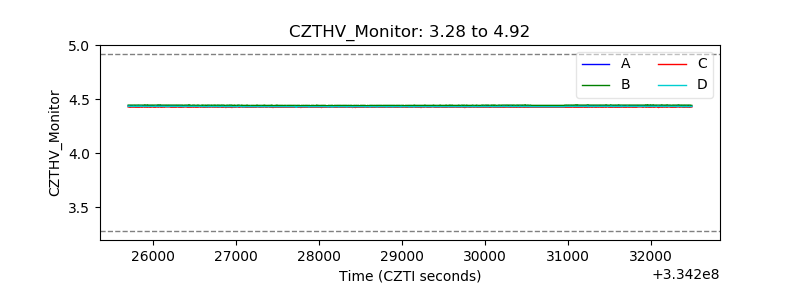 |
| D_VDD | 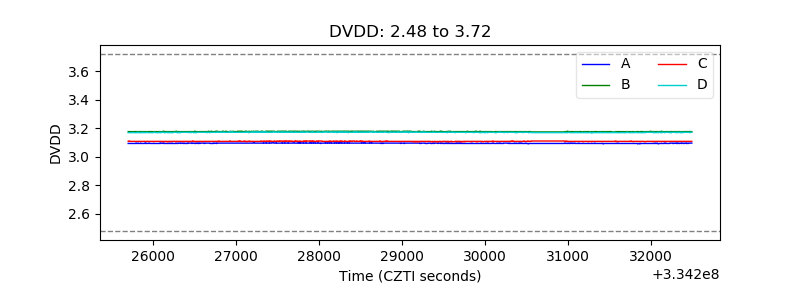 |
| Temperature 1 | 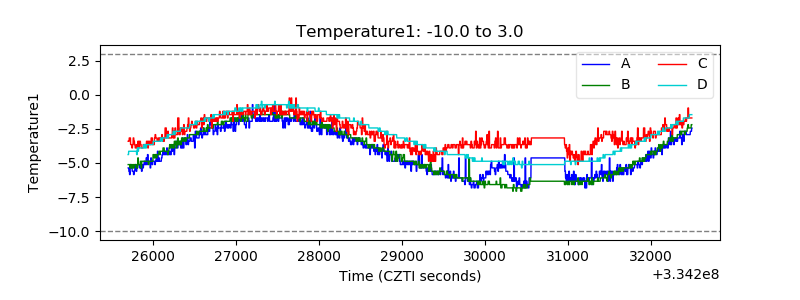 |
| Veto HV Monitor | 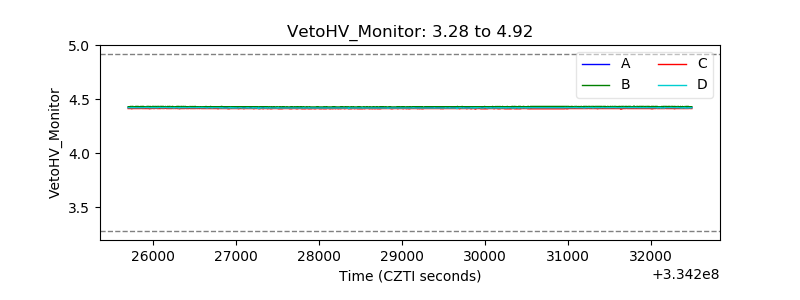 |
| Veto LLD | 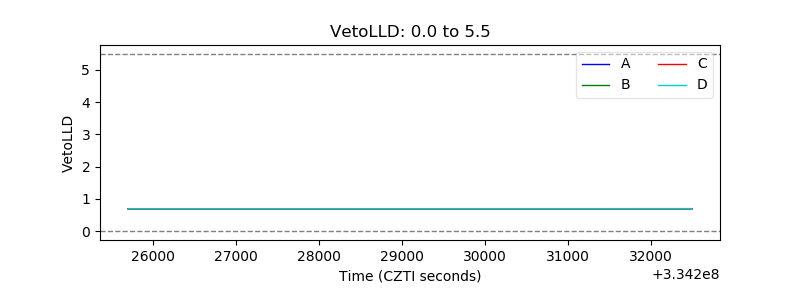 |
| Alpha Counter | 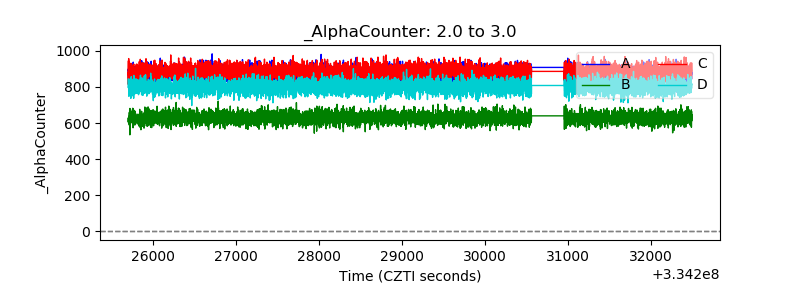 |
| _CPM_Rate | 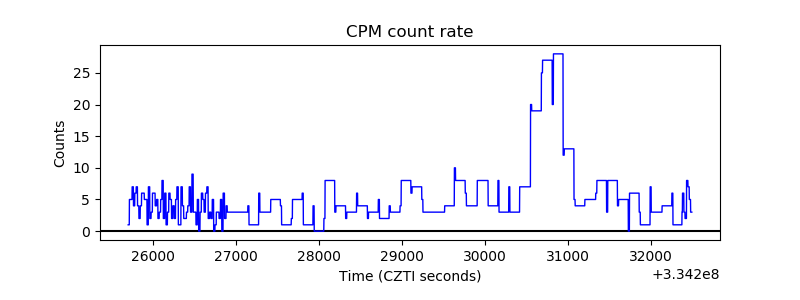 |
| CZT Counter | 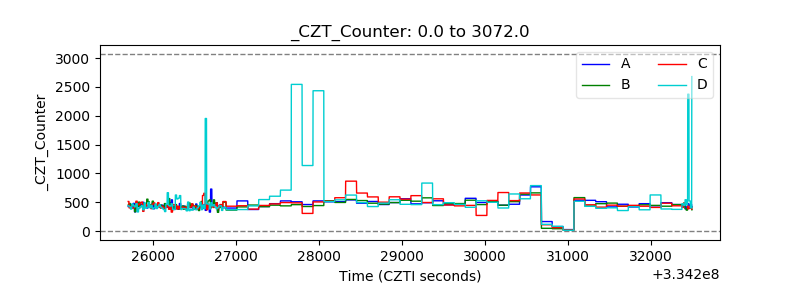 |
| +2.5 Volts monitor |  |
| +5 Volts monitor |  |
| _ROLL_ROT | 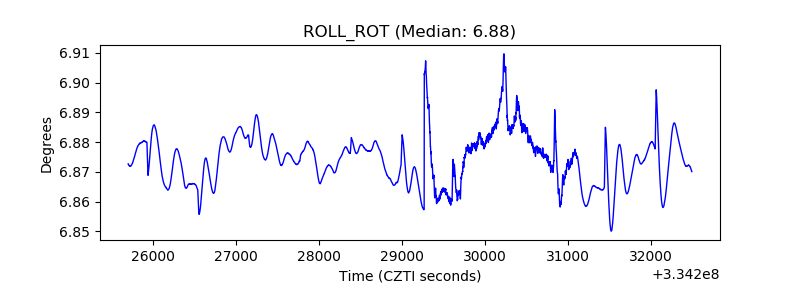 |
| _Roll_DEC | 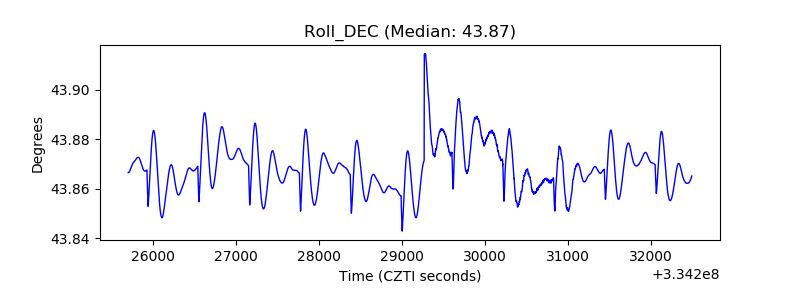 |
| _Roll_RA | 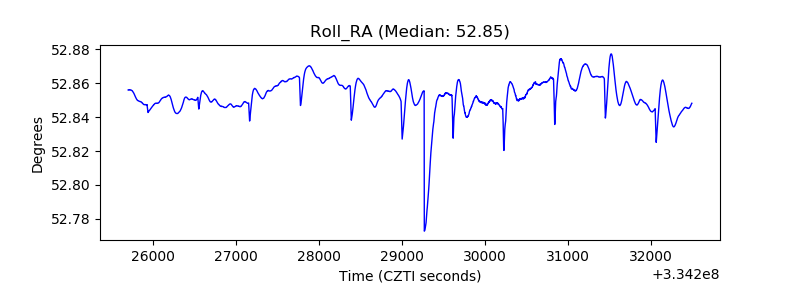 |
| Veto Counter | 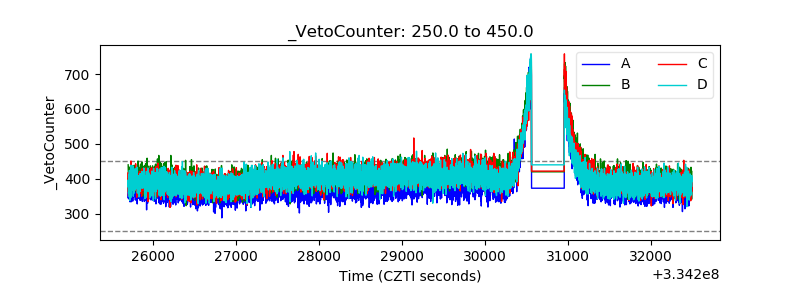 |