| Param | Original file | Final file |
|---|---|---|
| Filename | modeM0/AS1A09_095T02_9000003846_26567cztM0_level2.evt | modeM0/AS1A09_095T02_9000003846_26567cztM0_level2_quad_clean.evt |
| Size (bytes) | 33,027,840 | 6,301,440 |
| Size | 31.5 MB | 6.0 MB |
| Events in quadrant A | 151,507 | 41,540 |
| Events in quadrant B | 149,205 | 42,591 |
| Events in quadrant C | 393,112 | 35,428 |
| Events in quadrant D | 279,800 | 38,919 |
| Mode M0 | |||
|---|---|---|---|
| Quadrant | BADHDUFLAG | Total packets | Discarded packets |
| A | 0 | 684 | 0 |
| B | 0 | 685 | 0 |
| C | 0 | 1402 | 0 |
| D | 0 | 1085 | 0 |
| Quadrant | Total seconds | Saturated seconds | Saturation percentage |
|---|---|---|---|
| A | 342 | 0 | 0.000000% |
| B | 342 | 0 | 0.000000% |
| C | 341 | 92 | 26.979472% |
| D | 341 | 4 | 1.173021% |
Noise dominated data is calculated using 1-second bins in cleaned event files. If a bin has >2000 counts, and if more than 50% of those come from <1% of pixels, then it is considered to be noise-dominated and hence unusable.
| Quadrant | # 1 sec bins | Bins with >0 counts | Bins with >2000 counts | High rate bins dominated by noise | Noise dominated (total time) | Noise dominated (detector-on time) | Marked lightcurve |
|---|---|---|---|---|---|---|---|
| A | 342 | 342 | 0 | 0 | 0.00% | 0.00% | 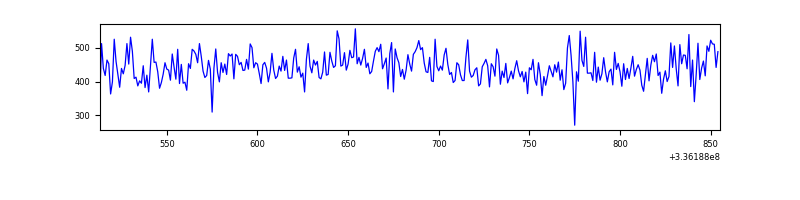 |
| B | 342 | 342 | 0 | 0 | 0.00% | 0.00% | 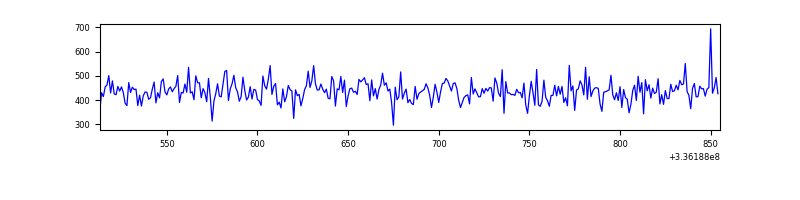 |
| C | 340 | 340 | 68 | 68 | 20.00% | 20.00% | 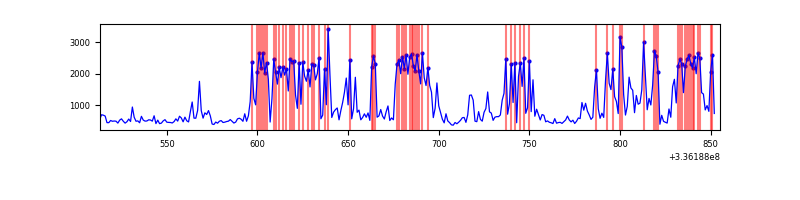 |
| D | 341 | 341 | 5 | 5 | 1.47% | 1.47% | 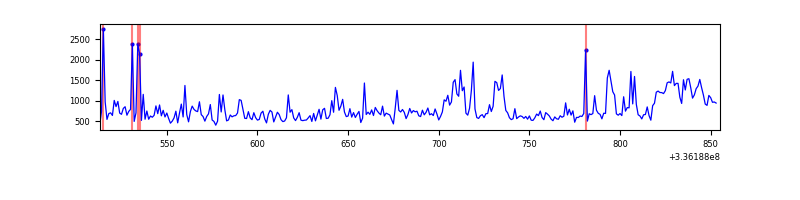 |
Top three noisy pixels from each quadrant. If the there are fewer than three noisy pixels in the level2.evt file, extra rows are filled as -1
| Pixel properties | Quadrant properties | ||||||
|---|---|---|---|---|---|---|---|
| Quadrant | DetID | PixID | Counts | Sigma | Mean | Median | Sigma |
| A | 5 | 168 | 3901 | 399.37 | 37 | 36 | 9.7 |
| A | 6 | 16 | 913 | 90.62 | 37 | 36 | 9.7 |
| A | 13 | 254 | 693 | 67.89 | 37 | 36 | 9.7 |
| B | 12 | 111 | 940 | 96.48 | 37 | 36 | 9.4 |
| B | 3 | 112 | 934 | 95.84 | 37 | 36 | 9.4 |
| B | 11 | 111 | 762 | 77.48 | 37 | 36 | 9.4 |
| C | 4 | 254 | 246687 | 24848.36 | 34 | 34 | 9.9 |
| C | 14 | 238 | 5249 | 525.37 | 34 | 34 | 9.9 |
| C | 3 | 233 | 4058 | 405.39 | 34 | 34 | 9.9 |
| D | 7 | 80 | 123917 | 11500.59 | 37 | 36 | 10.8 |
| D | 1 | 52 | 14975 | 1386.87 | 37 | 36 | 10.8 |
| D | 2 | 234 | 1416 | 128.11 | 37 | 36 | 10.8 |
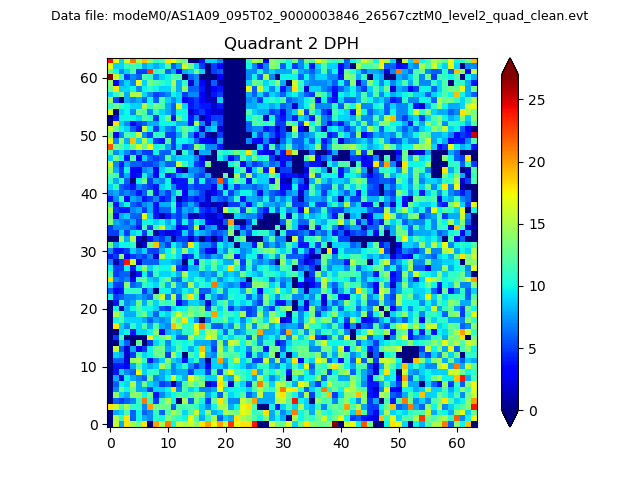
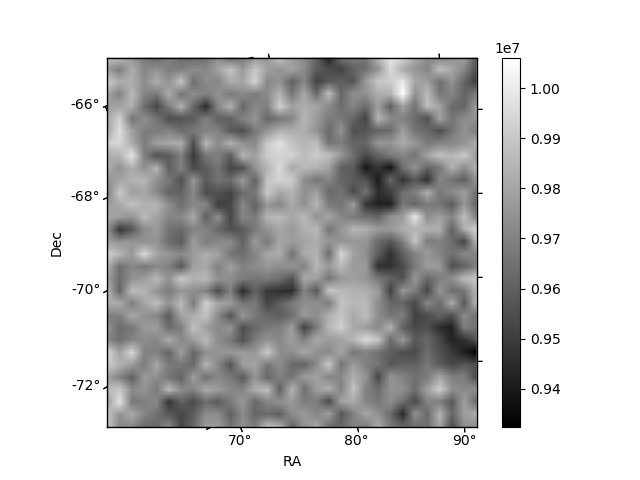
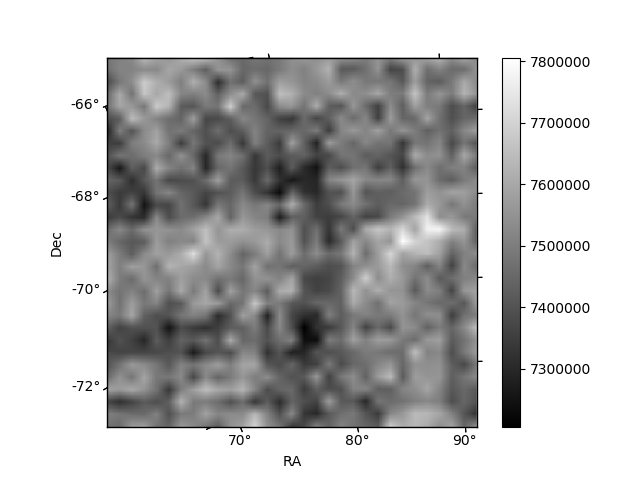
Histogram calculated using DETX and DETY for each event in the final _common_clean file
| Quadrant A | 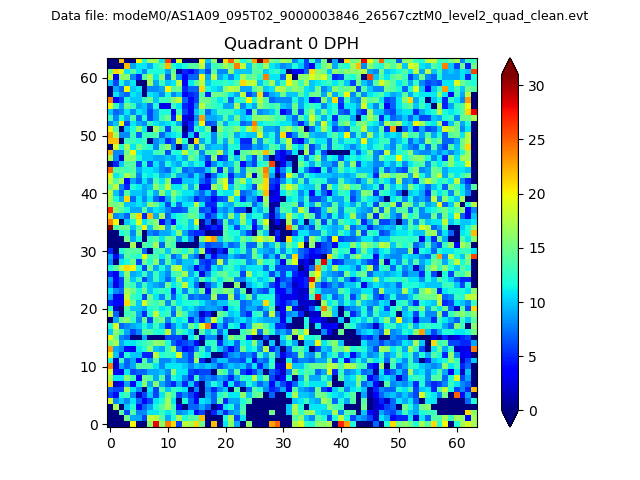 |
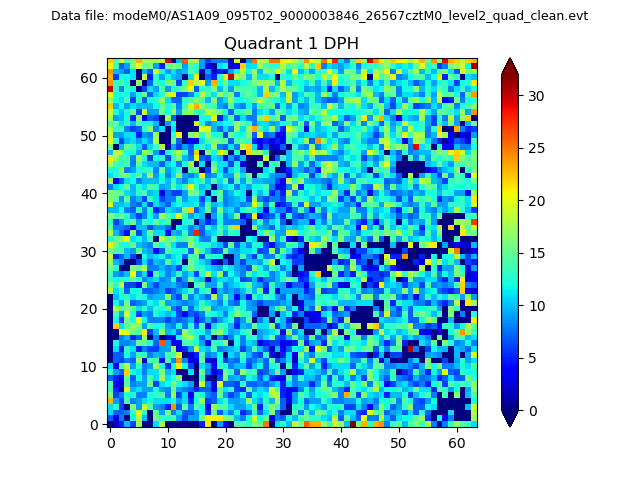 |
Quadrant B |
|---|---|---|---|
| Quadrant D | 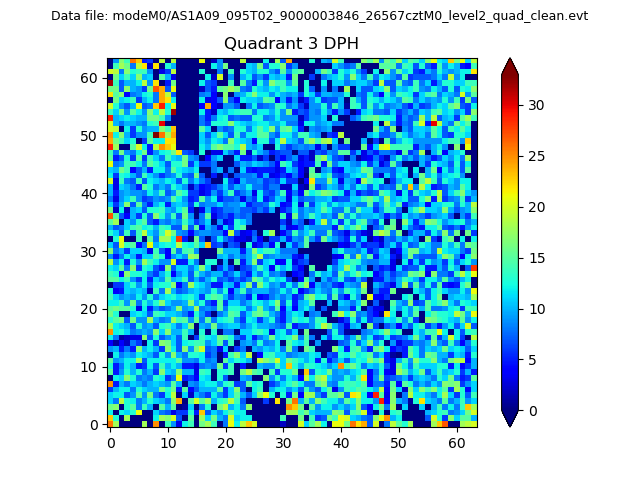 |
 |
Quadrant C |
| Plot type | Count rate plots | Images |
|---|---|---|
| Comparison with Poisson distribution Blue bars denote a histogram of data divided into 1 sec bins. Red curve is a Poisson curve with rate = median count rate of data. |
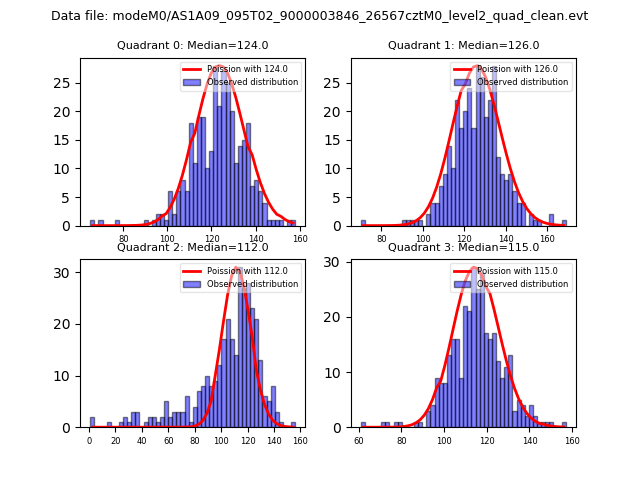 |
 |
| Quadrant-wise count rates Data is divided into 100 sec bins |
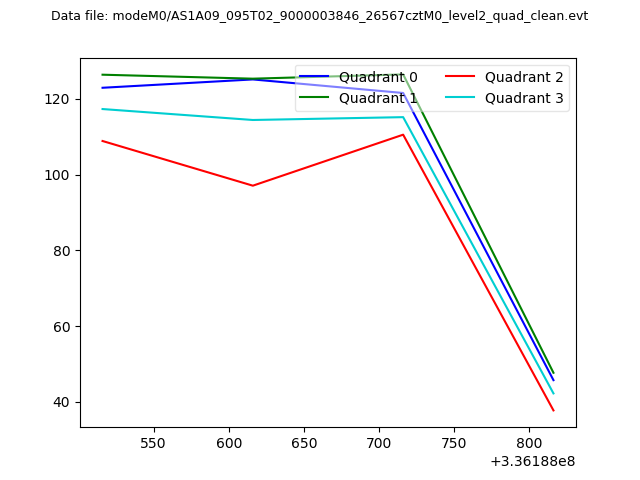 |
|
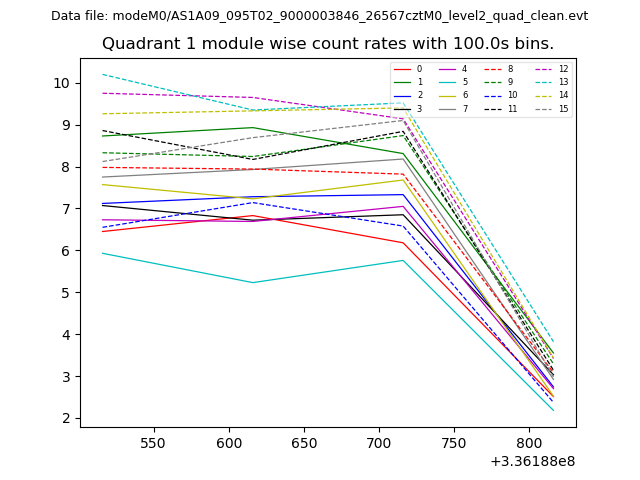
| Module-wise count rates for Quadrant A Data is divided into 100 sec bins |
 |
 |
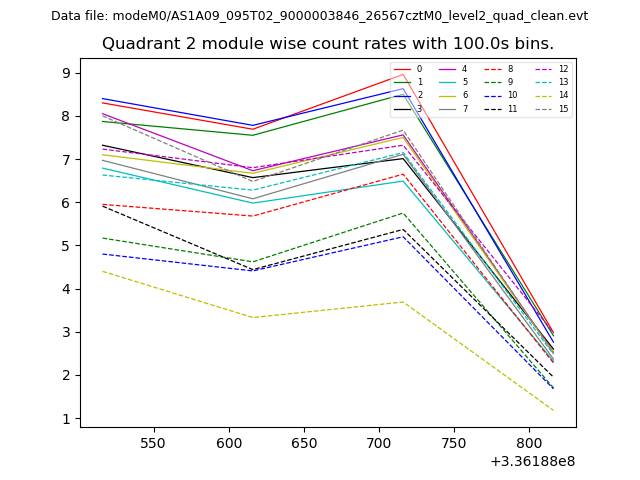
| Module-wise count rates for Quadrant B Data is divided into 100 sec bins |
 |
 |
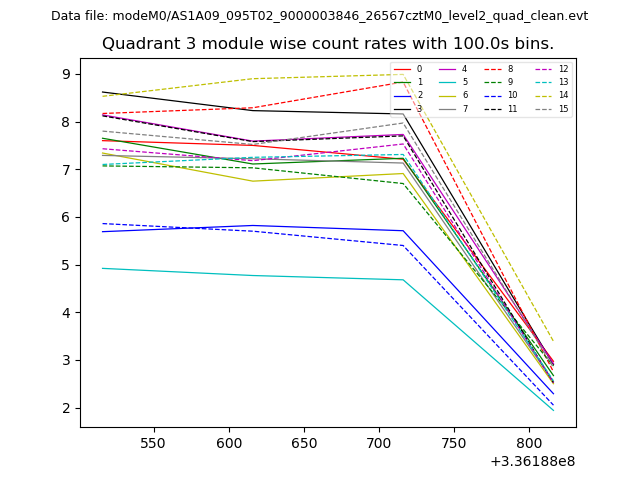
| Module-wise count rates for Quadrant C Data is divided into 100 sec bins |
 |
 |
| Module-wise count rates for Quadrant D Data is divided into 100 sec bins |
 |
 |
| Parameter | Plot |
|---|---|
| CZT HV Monitor | 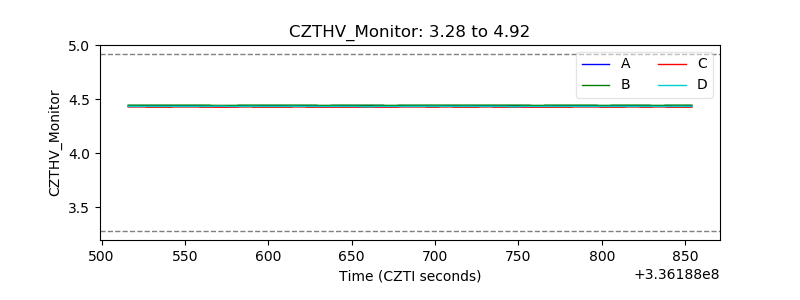 |
| D_VDD | 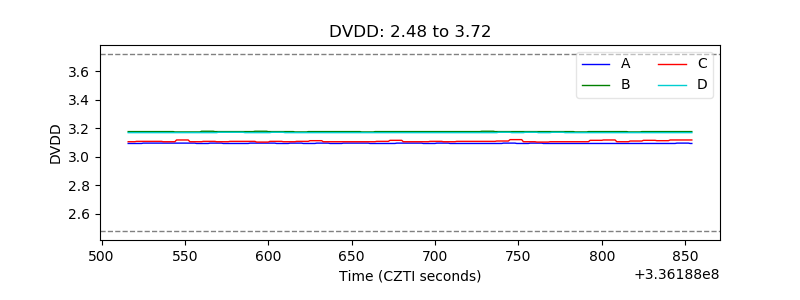 |
| Temperature 1 | 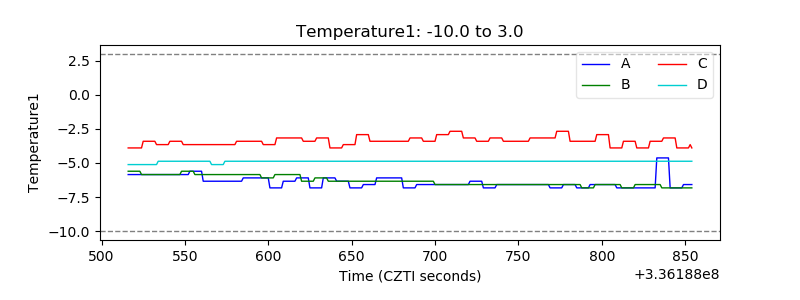 |
| Veto HV Monitor | 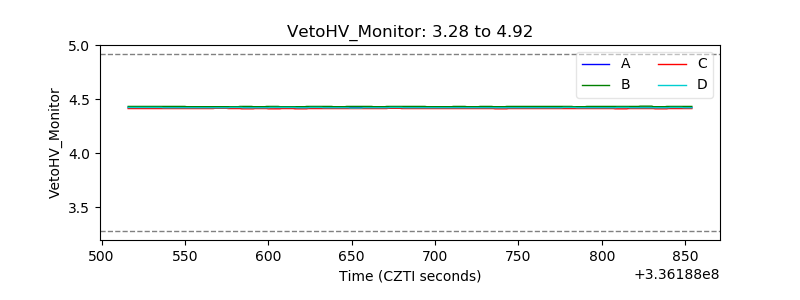 |
| Veto LLD | 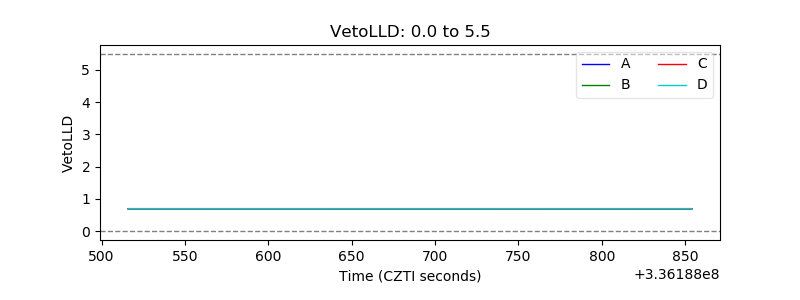 |
| Alpha Counter | 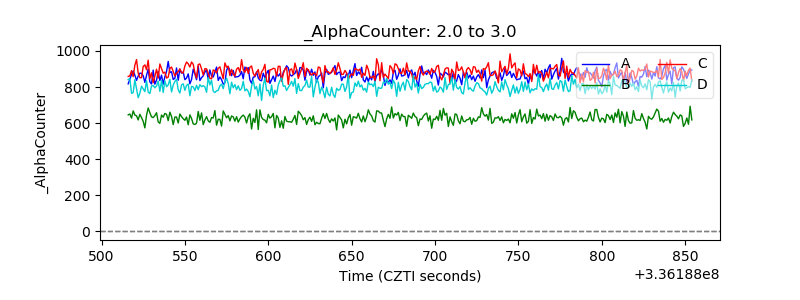 |
| _CPM_Rate |  |
| CZT Counter | 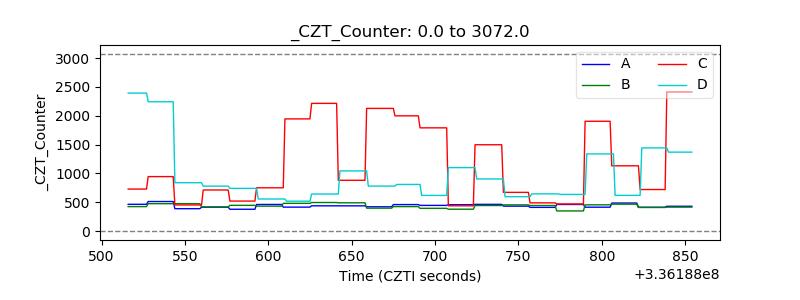 |
| +2.5 Volts monitor |  |
| +5 Volts monitor |  |
| _ROLL_ROT | 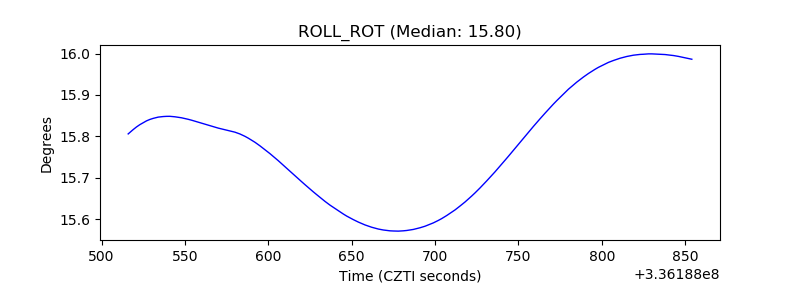 |
| _Roll_DEC | 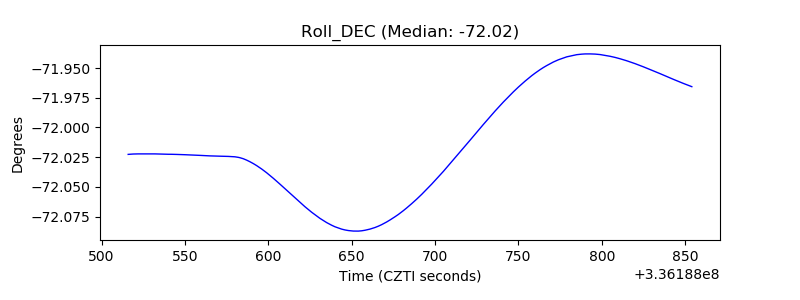 |
| _Roll_RA | 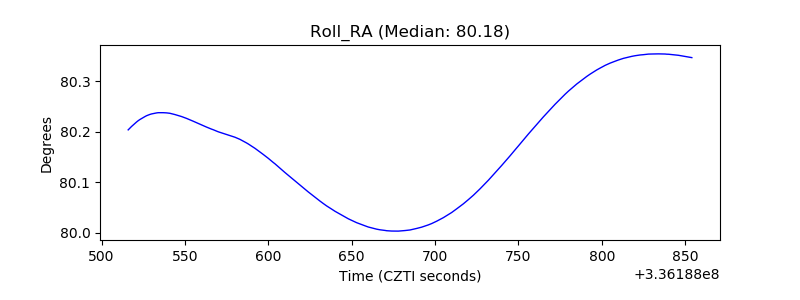 |
| Veto Counter | 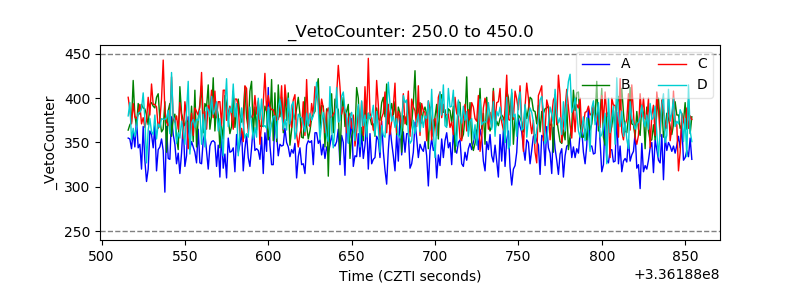 |