| Param | Original file | Final file |
|---|---|---|
| Filename | modeM0/AS1T03_224T01_9000003872_26885cztM0_level2.evt | modeM0/AS1T03_224T01_9000003872_26885cztM0_level2_quad_clean.evt |
| Size (bytes) | 196,896,960 | 43,917,120 |
| Size | 187.8 MB | 41.9 MB |
| Events in quadrant A | 1,356,995 | 288,260 |
| Events in quadrant B | 1,409,789 | 296,430 |
| Events in quadrant C | 1,201,754 | 287,753 |
| Events in quadrant D | 1,817,710 | 272,589 |
| Mode M0 | |||
|---|---|---|---|
| Quadrant | BADHDUFLAG | Total packets | Discarded packets |
| A | 0 | 5588 | 0 |
| B | 0 | 5742 | 0 |
| C | 0 | 5170 | 0 |
| D | 0 | 7008 | 0 |
| Quadrant | Total seconds | Saturated seconds | Saturation percentage |
|---|---|---|---|
| A | 2571 | 8 | 0.311163% |
| B | 2572 | 8 | 0.311042% |
| C | 2572 | 16 | 0.622084% |
| D | 2572 | 119 | 4.626750% |
Noise dominated data is calculated using 1-second bins in cleaned event files. If a bin has >2000 counts, and if more than 50% of those come from <1% of pixels, then it is considered to be noise-dominated and hence unusable.
| Quadrant | # 1 sec bins | Bins with >0 counts | Bins with >2000 counts | High rate bins dominated by noise | Noise dominated (total time) | Noise dominated (detector-on time) | Marked lightcurve |
|---|---|---|---|---|---|---|---|
| A | 2571 | 2571 | 0 | 0 | 0.00% | 0.00% |  |
| B | 2572 | 2572 | 6 | 6 | 0.23% | 0.23% |  |
| C | 2572 | 2572 | 0 | 0 | 0.00% | 0.00% |  |
| D | 2572 | 2572 | 117 | 117 | 4.55% | 4.55% |  |
Top three noisy pixels from each quadrant. If the there are fewer than three noisy pixels in the level2.evt file, extra rows are filled as -1
| Pixel properties | Quadrant properties | ||||||
|---|---|---|---|---|---|---|---|
| Quadrant | DetID | PixID | Counts | Sigma | Mean | Median | Sigma |
| A | 0 | 13 | 100789 | 1568.12 | 309 | 302 | 64.1 |
| A | 6 | 16 | 63027 | 978.84 | 309 | 302 | 64.1 |
| A | 13 | 254 | 4267 | 61.87 | 309 | 302 | 64.1 |
| B | 0 | 190 | 98487 | 1613.56 | 304 | 297 | 60.9 |
| B | 15 | 33 | 82564 | 1351.89 | 304 | 297 | 60.9 |
| B | 3 | 64 | 25897 | 420.68 | 304 | 297 | 60.9 |
| C | 14 | 238 | 48666 | 678.57 | 294 | 295 | 71.3 |
| C | 14 | 176 | 2256 | 27.51 | 294 | 295 | 71.3 |
| C | 3 | 233 | 2085 | 25.11 | 294 | 295 | 71.3 |
| D | 7 | 80 | 465996 | 6613.38 | 292 | 286 | 70.4 |
| D | 2 | 250 | 107936 | 1528.7 | 292 | 286 | 70.4 |
| D | 1 | 52 | 64149 | 906.9 | 292 | 286 | 70.4 |
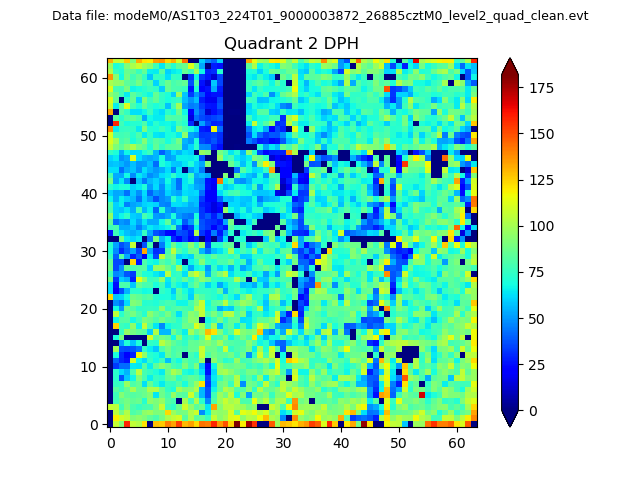
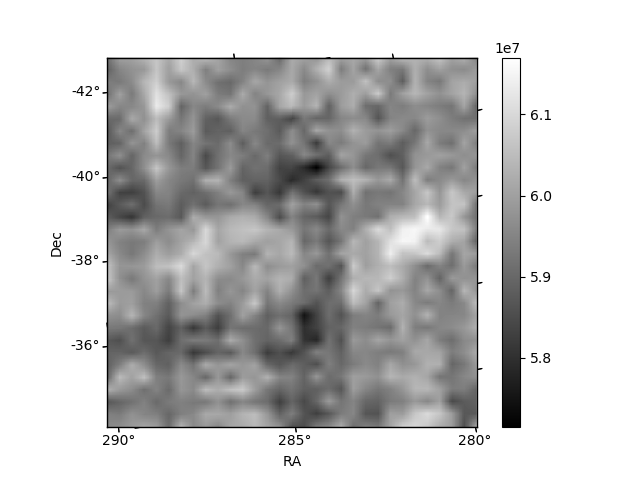
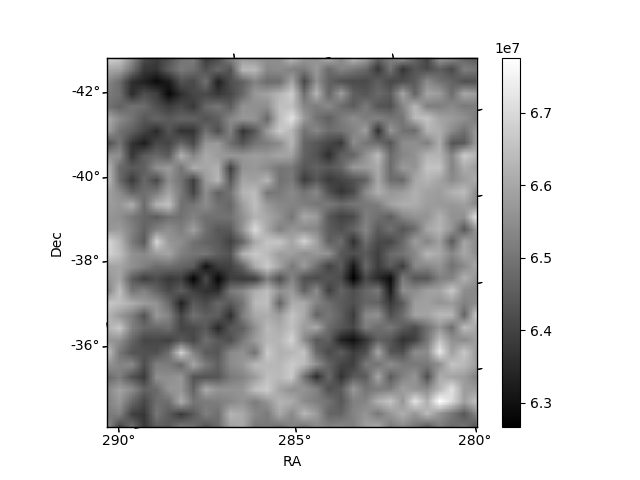
Histogram calculated using DETX and DETY for each event in the final _common_clean file
| Quadrant A | 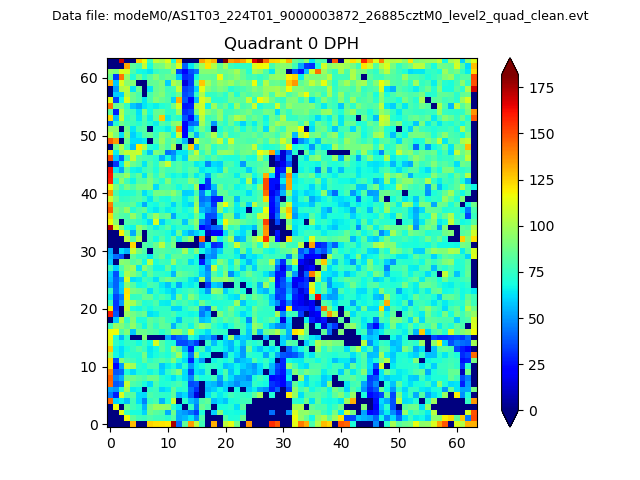 |
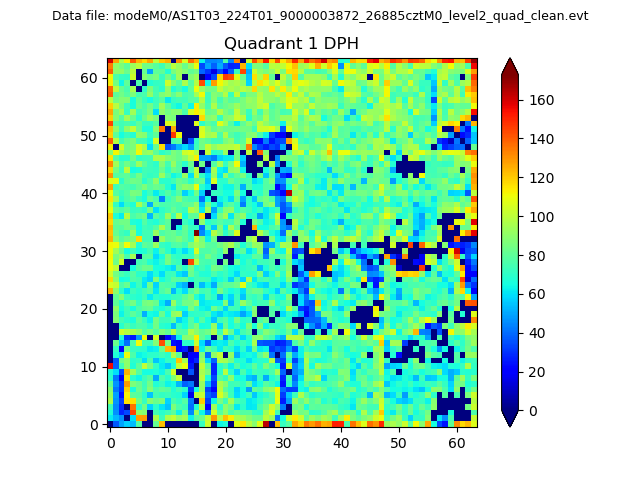 |
Quadrant B |
|---|---|---|---|
| Quadrant D | 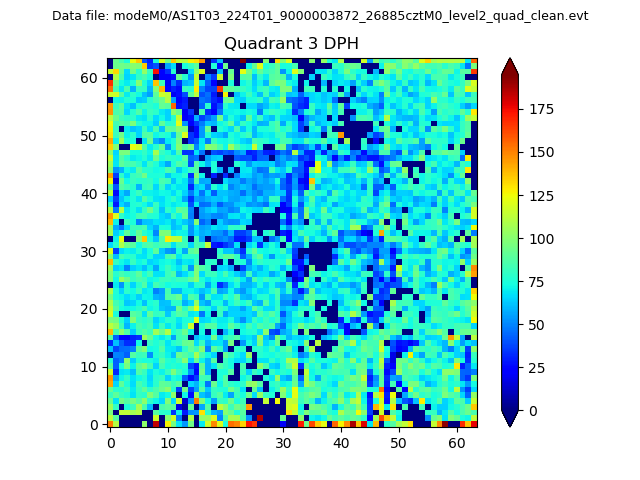 |
 |
Quadrant C |
| Plot type | Count rate plots | Images |
|---|---|---|
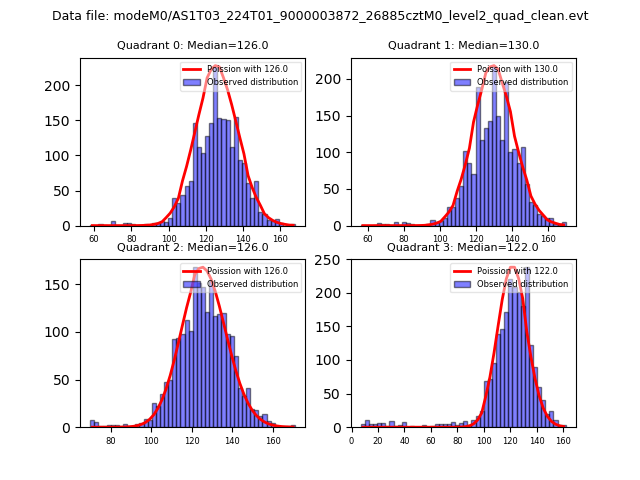
| Comparison with Poisson distribution Blue bars denote a histogram of data divided into 1 sec bins. Red curve is a Poisson curve with rate = median count rate of data. |
 |
 |
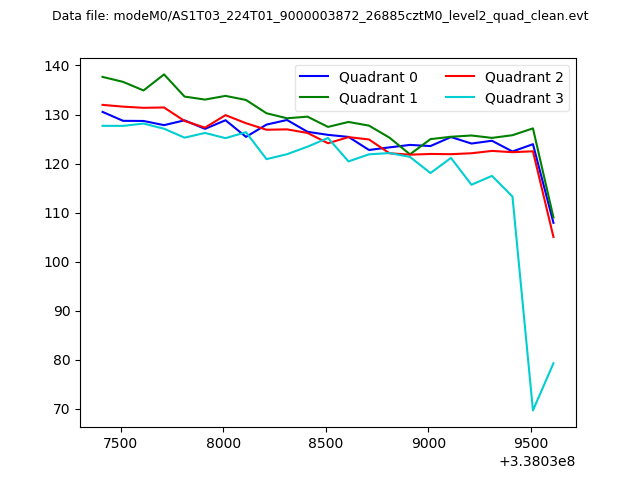
| Quadrant-wise count rates Data is divided into 100 sec bins |
 |
|
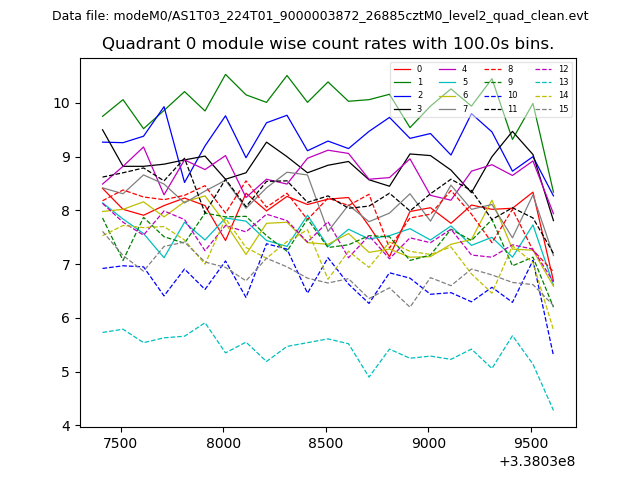
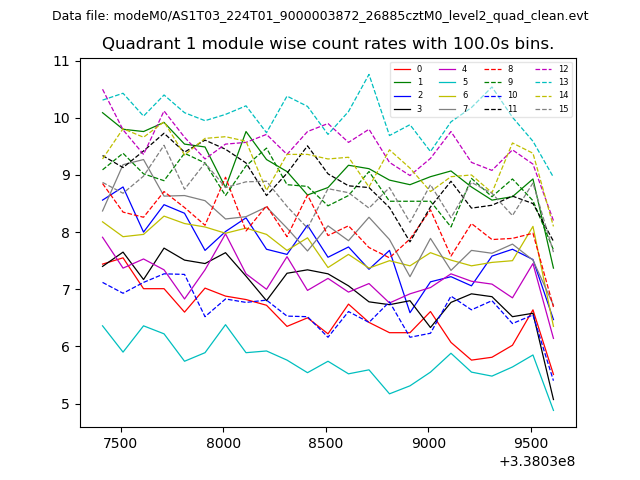
| Module-wise count rates for Quadrant A Data is divided into 100 sec bins |
 |
 |
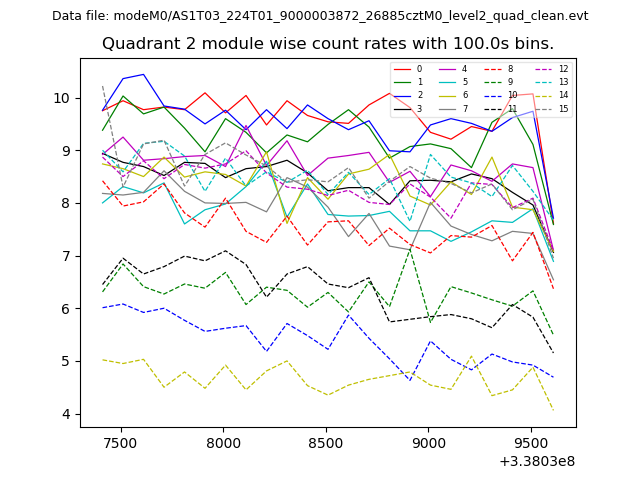
| Module-wise count rates for Quadrant B Data is divided into 100 sec bins |
 |
 |
| Module-wise count rates for Quadrant C Data is divided into 100 sec bins |
 |
 |
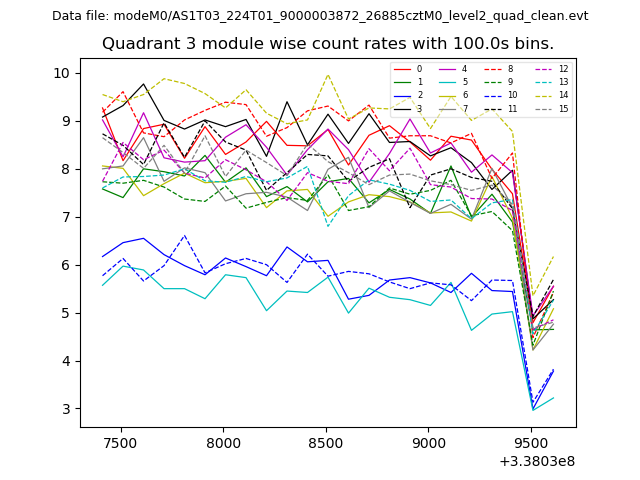
| Module-wise count rates for Quadrant D Data is divided into 100 sec bins |
 |
 |
| Parameter | Plot |
|---|---|
| CZT HV Monitor | 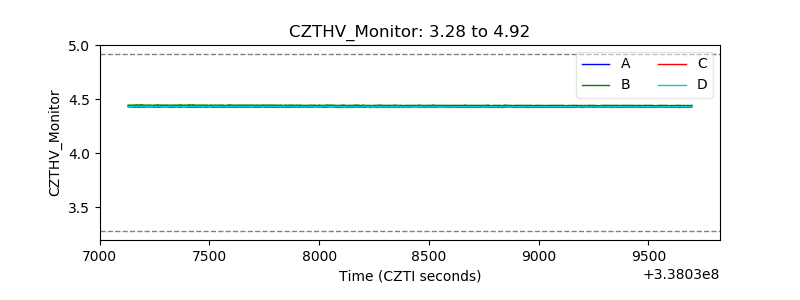 |
| D_VDD | 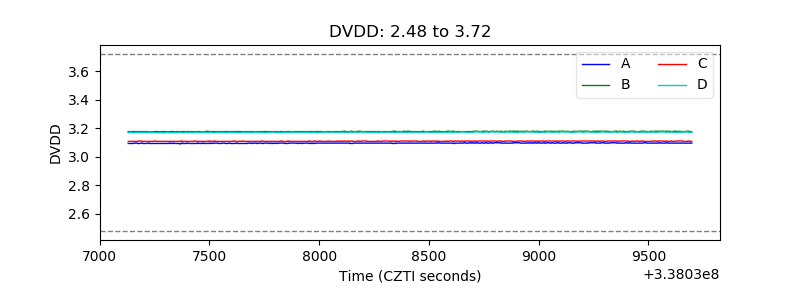 |
| Temperature 1 | 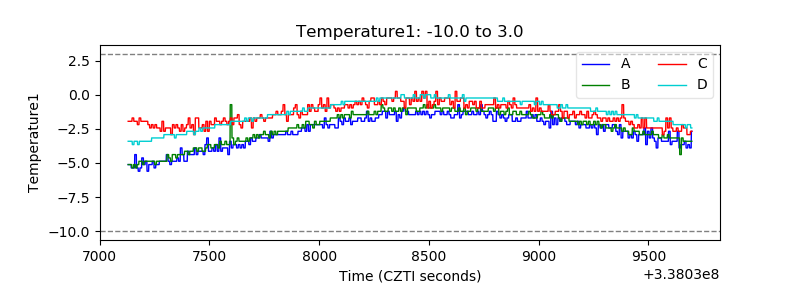 |
| Veto HV Monitor | 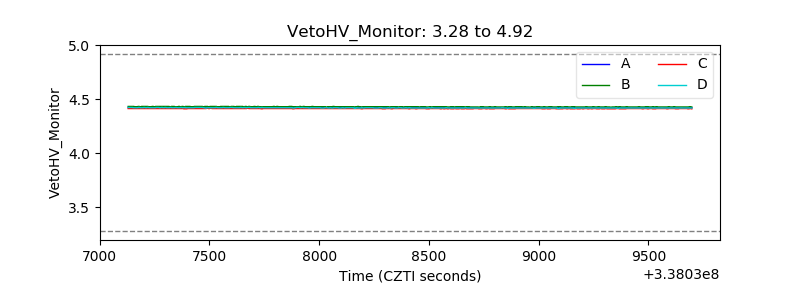 |
| Veto LLD | 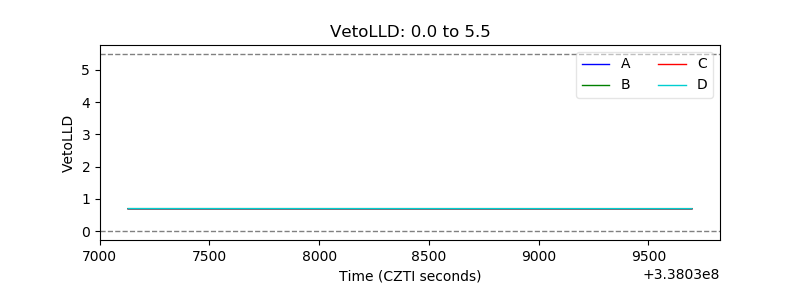 |
| Alpha Counter | 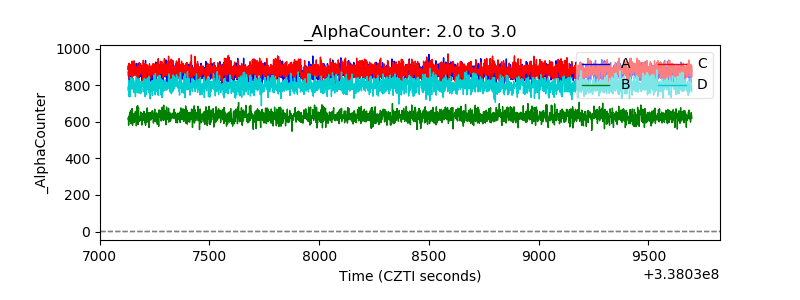 |
| _CPM_Rate | 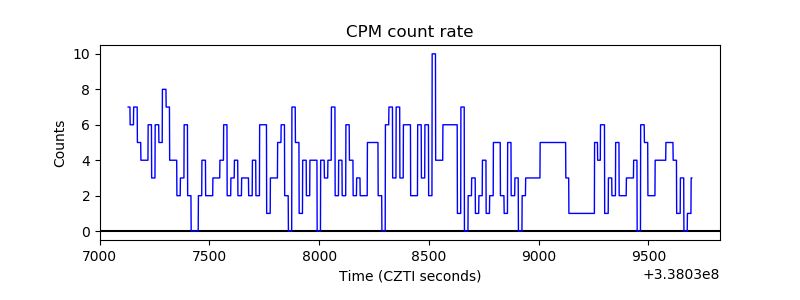 |
| CZT Counter | 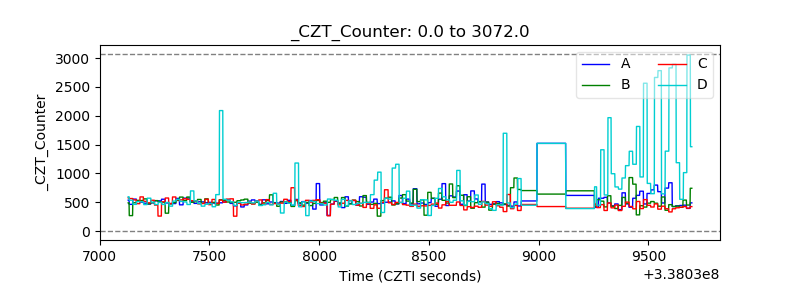 |
| +2.5 Volts monitor |  |
| +5 Volts monitor |  |
| _ROLL_ROT | 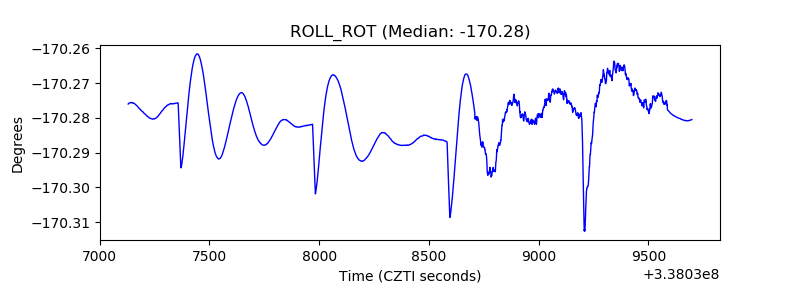 |
| _Roll_DEC | 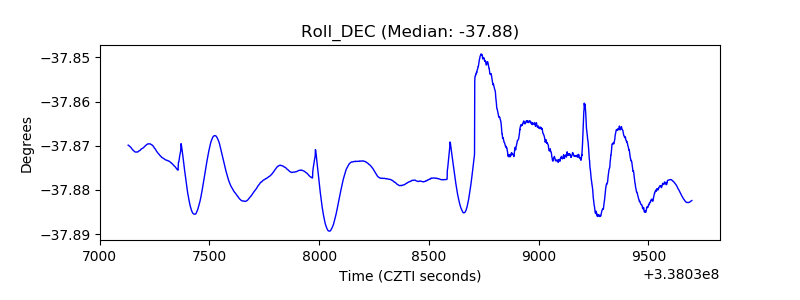 |
| _Roll_RA | 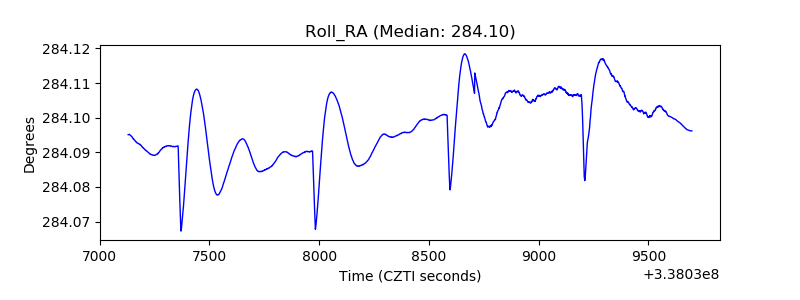 |
| Veto Counter | 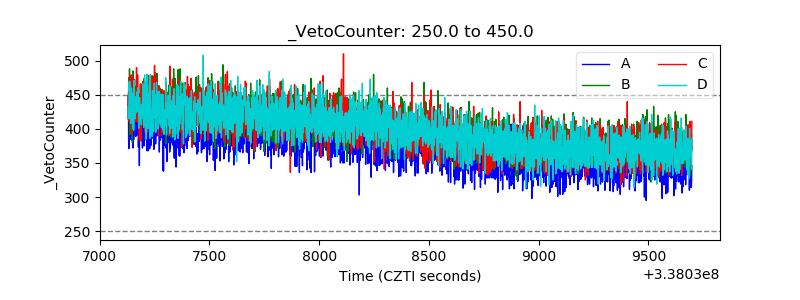 |