| Param | Original file | Final file |
|---|---|---|
| Filename | modeM0/AS1T03_240T01_9000003906cztM0_level2.fits | modeM0/AS1T03_240T01_9000003906cztM0_level2_quad_clean.evt |
| Size (bytes) | 57,885,120 | 68,520,960 |
| Size | 55.2 MB | 65.3 MB |
| Events in quadrant A | 347,318 | 428,351 |
| Events in quadrant B | 338,414 | 435,018 |
| Events in quadrant C | 343,878 | 417,814 |
| Events in quadrant D | 287,266 | 357,039 |
| Mode M9 | |||
|---|---|---|---|
| Quadrant | BADHDUFLAG | Total packets | Discarded packets |
| A | 0 | 5 | 0 |
| B | 0 | 5 | 0 |
| C | 0 | 5 | 0 |
| D | 0 | 5 | 0 |
| Mode M0 | |||
|---|---|---|---|
| Quadrant | BADHDUFLAG | Total packets | Discarded packets |
| A | 0 | 14142 | 0 |
| B | 0 | 13269 | 0 |
| C | 0 | 12672 | 0 |
| D | 0 | 22656 | 0 |
| Mode SS | |||
|---|---|---|---|
| Quadrant | BADHDUFLAG | Total packets | Discarded packets |
| A | 0 | 126 | 0 |
| B | 0 | 126 | 0 |
| C | 0 | 126 | 0 |
| D | 0 | 126 | 0 |
| Quadrant | Total seconds | Saturated seconds | Saturation percentage |
|---|---|---|---|
| A | 6252 | 119 | 1.903391% |
| B | 6252 | 100 | 1.599488% |
| C | 6252 | 48 | 0.767754% |
| D | 6252 | 498 | 7.965451% |
Noise dominated data is calculated using 1-second bins in cleaned event files. If a bin has >2000 counts, and if more than 50% of those come from <1% of pixels, then it is considered to be noise-dominated and hence unusable.
| Quadrant | # 1 sec bins | Bins with >0 counts | Bins with >2000 counts | High rate bins dominated by noise | Noise dominated (total time) | Noise dominated (detector-on time) | Marked lightcurve |
|---|---|---|---|---|---|---|---|
| A | 6702 | 6252 | 0 | 0 | 0.00% | 0.00% | 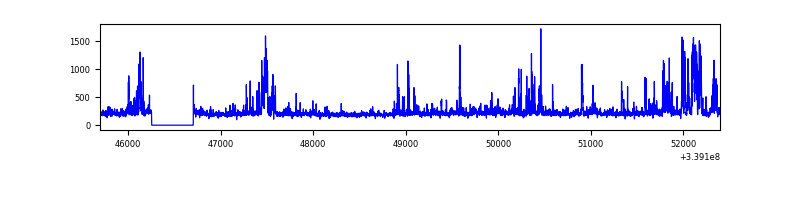 |
| B | 6701 | 6251 | 0 | 0 | 0.00% | 0.00% | 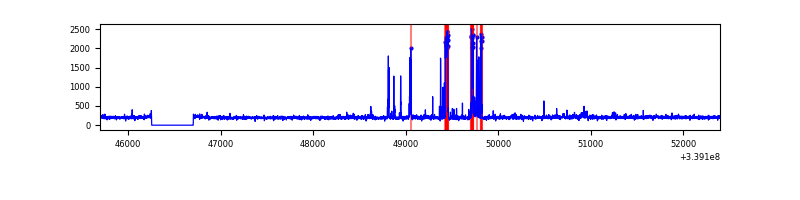 |
| C | 6702 | 6252 | 0 | 0 | 0.00% | 0.00% | 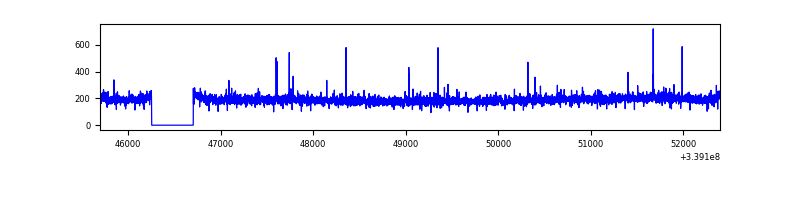 |
| D | 6701 | 6251 | 0 | 0 | 0.00% | 0.00% | 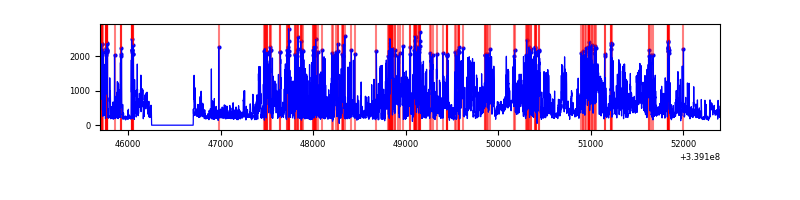 |
Top three noisy pixels from each quadrant. If the there are fewer than three noisy pixels in the level2.evt file, extra rows are filled as -1
| Pixel properties | Quadrant properties | ||||||
|---|---|---|---|---|---|---|---|
| Quadrant | DetID | PixID | Counts | Sigma | Mean | Median | Sigma |
| A | 0 | 29 | 328 | 9.93 | 90 | 85 | 24.5 |
| A | 7 | 110 | 289 | 8.34 | 90 | 85 | 24.5 |
| A | 0 | 30 | 259 | 7.11 | 90 | 85 | 24.5 |
| B | 2 | 9 | 249 | 8.1 | 89 | 85 | 20.3 |
| B | 5 | 255 | 235 | 7.41 | 89 | 85 | 20.3 |
| B | 10 | 128 | 226 | 6.96 | 89 | 85 | 20.3 |
| C | 2 | 191 | 247 | 6.55 | 91 | 85 | 24.7 |
| C | 12 | 241 | 241 | 6.31 | 91 | 85 | 24.7 |
| C | 12 | 250 | 231 | 5.9 | 91 | 85 | 24.7 |
| D | 4 | 246 | 234 | 6.76 | 81 | 74 | 23.7 |
| D | 6 | 231 | 224 | 6.34 | 81 | 74 | 23.7 |
| D | 1 | 19 | 218 | 6.09 | 81 | 74 | 23.7 |
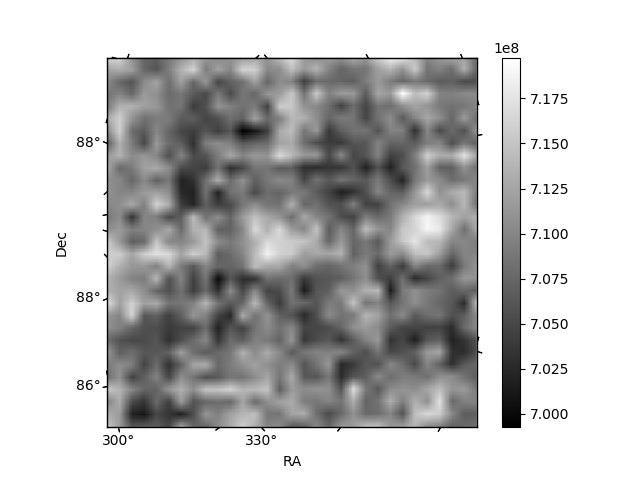
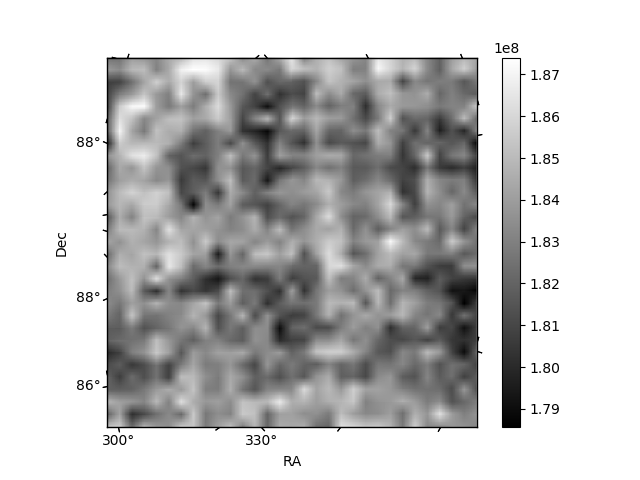
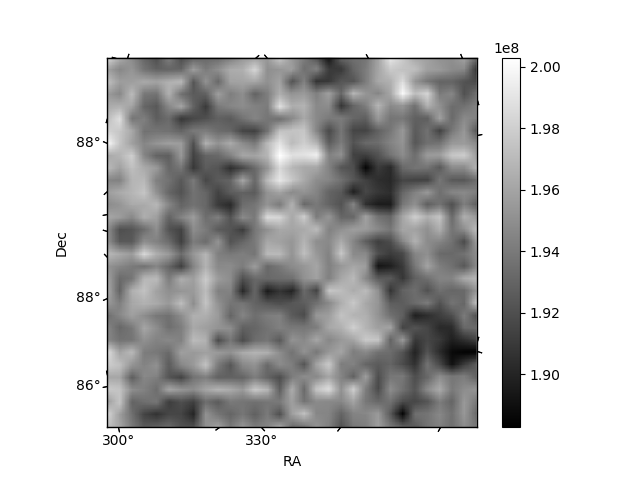
Histogram calculated using DETX and DETY for each event in the final _common_clean file
| Quadrant A | 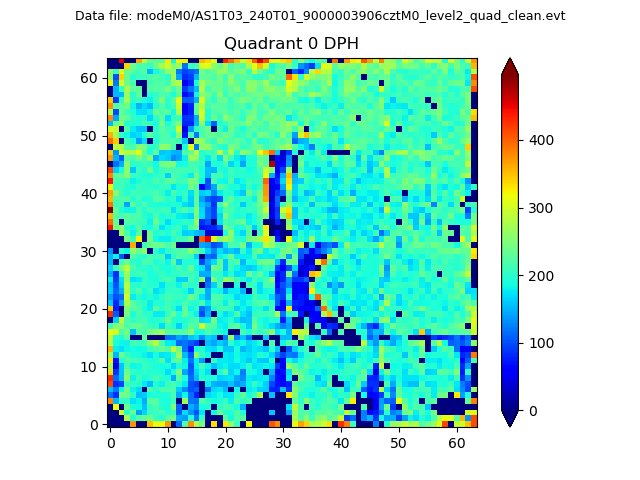 |
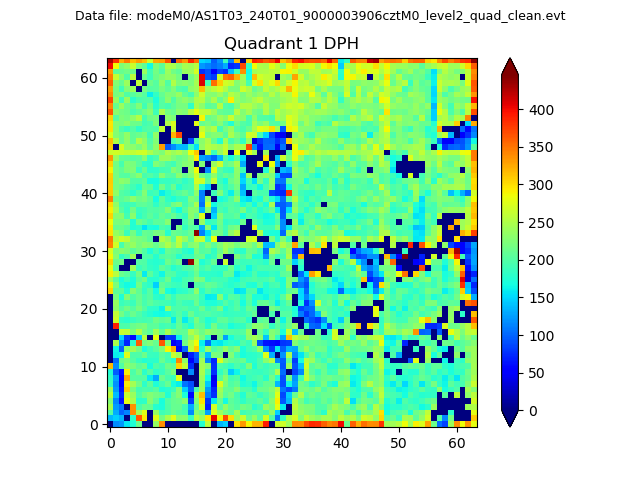 |
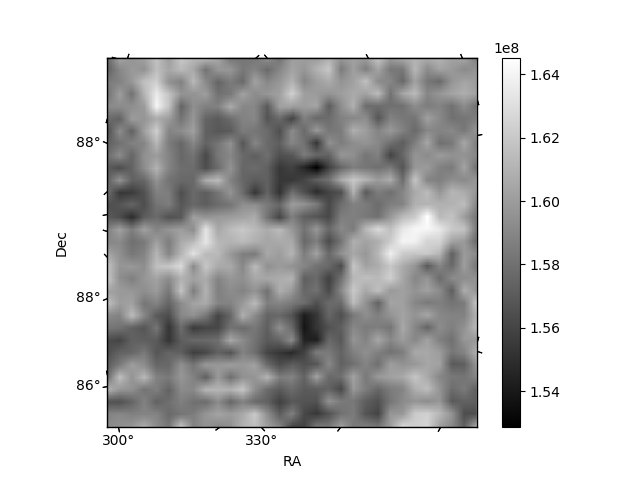
Quadrant B |
|---|---|---|---|
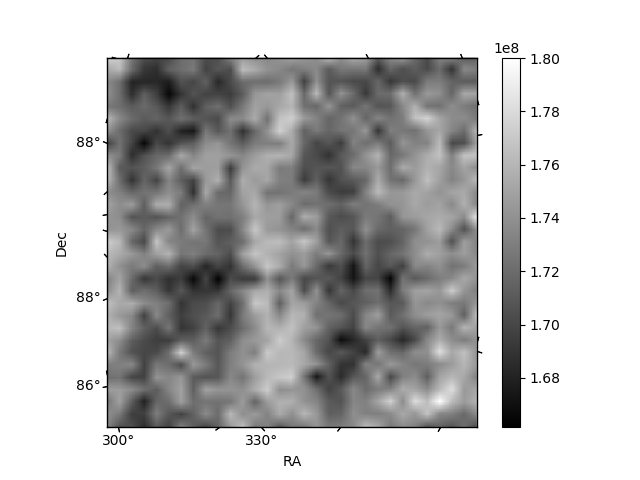
| Quadrant D | 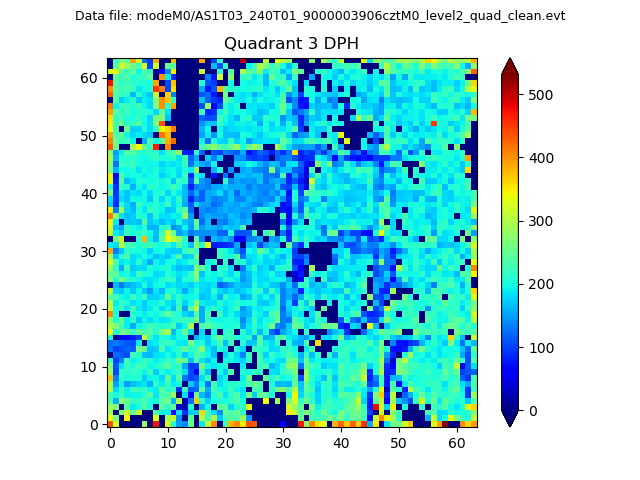 |
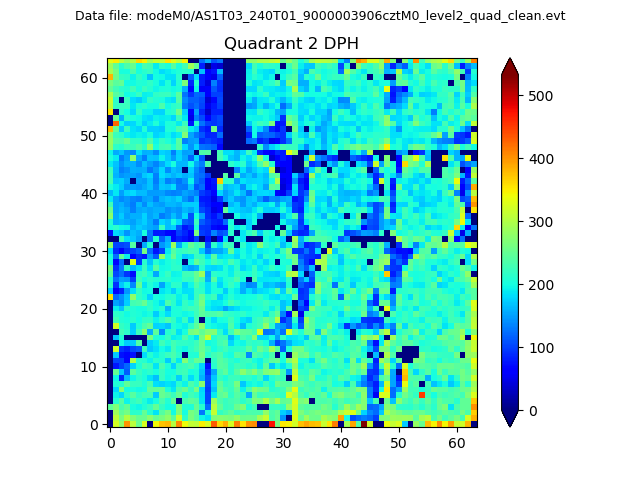 |
Quadrant C |
| Plot type | Count rate plots | Images |
|---|---|---|
| Comparison with Poisson distribution Blue bars denote a histogram of data divided into 1 sec bins. Red curve is a Poisson curve with rate = median count rate of data. |
 |
 |
| Quadrant-wise count rates Data is divided into 100 sec bins |
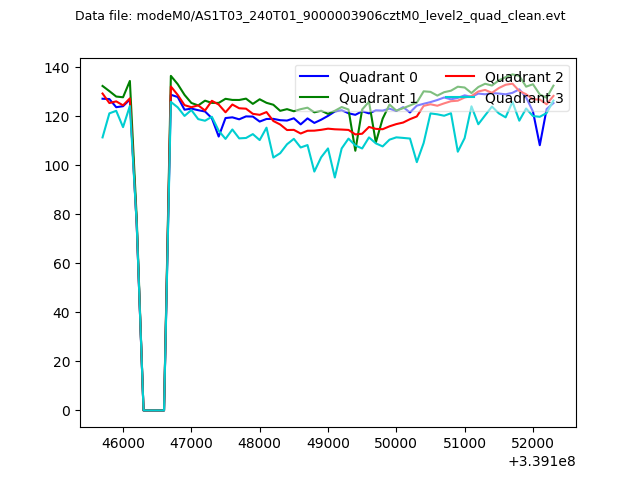 |
|
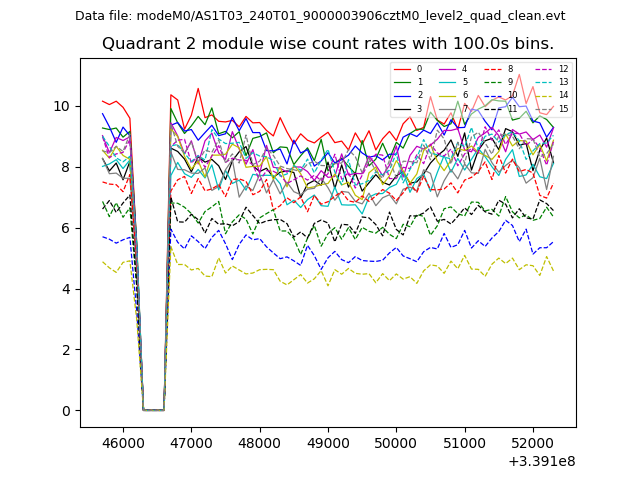
| Module-wise count rates for Quadrant A Data is divided into 100 sec bins |
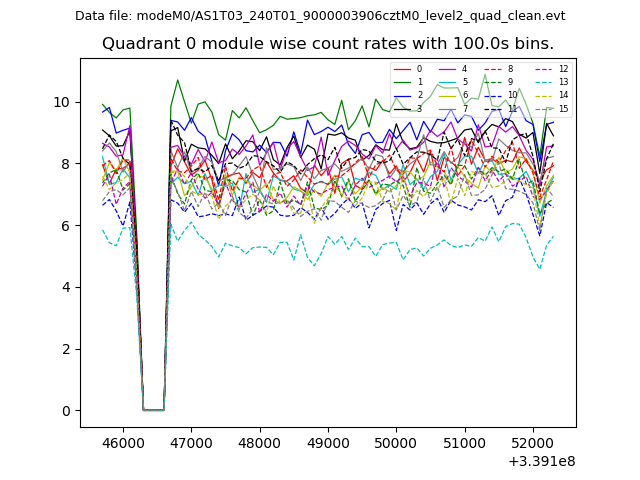 |
 |
| Module-wise count rates for Quadrant B Data is divided into 100 sec bins |
 |
 |
| Module-wise count rates for Quadrant C Data is divided into 100 sec bins |
 |
 |
| Module-wise count rates for Quadrant D Data is divided into 100 sec bins |
 |
 |
| Parameter | Plot |
|---|---|
| CZT HV Monitor | 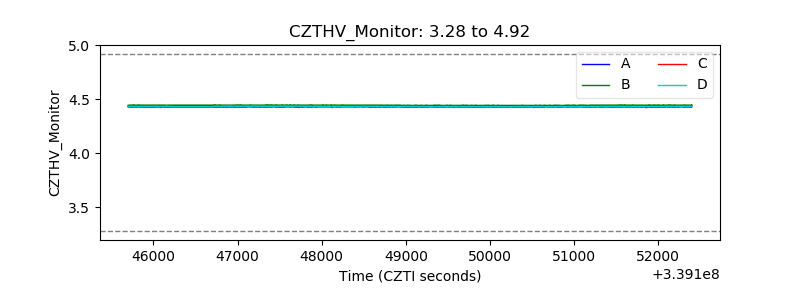 |
| D_VDD | 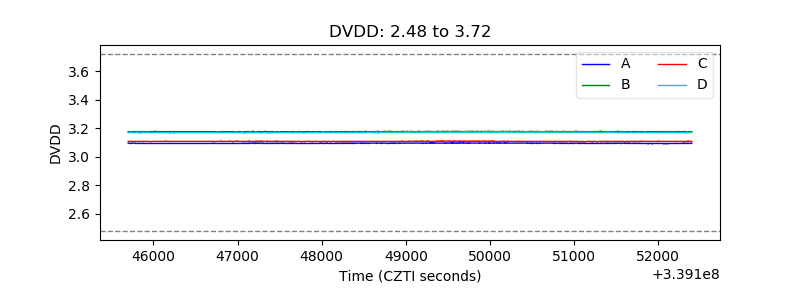 |
| Temperature 1 |  |
| Veto HV Monitor | 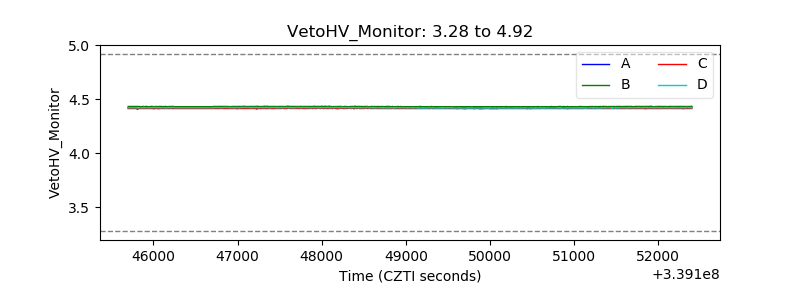 |
| Veto LLD | 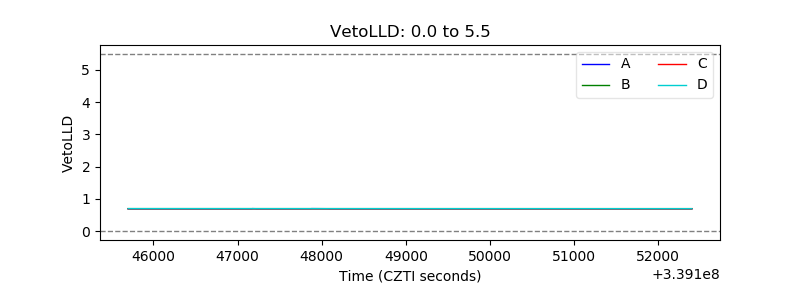 |
| Alpha Counter | 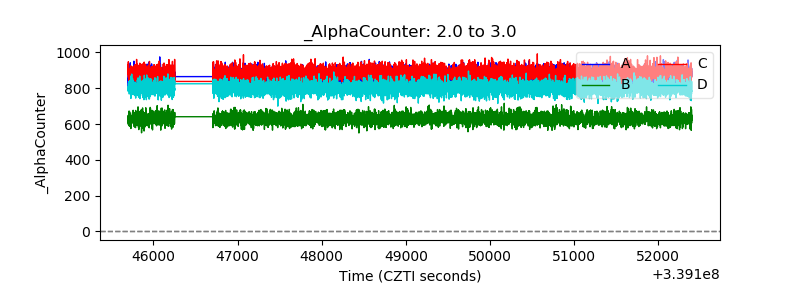 |
| _CPM_Rate | 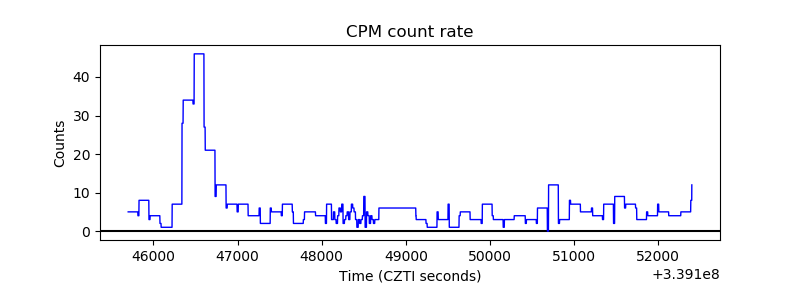 |
| CZT Counter | 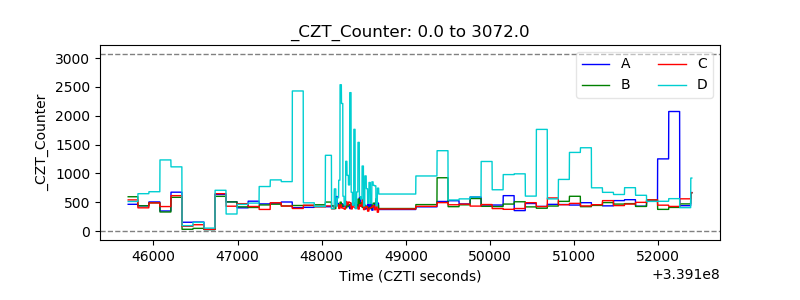 |
| +2.5 Volts monitor |  |
| +5 Volts monitor |  |
| _ROLL_ROT | 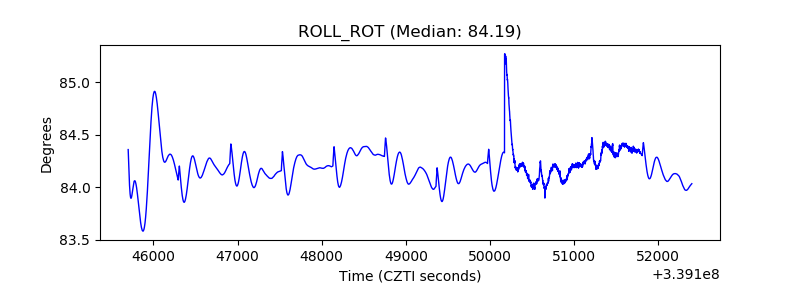 |
| _Roll_DEC | 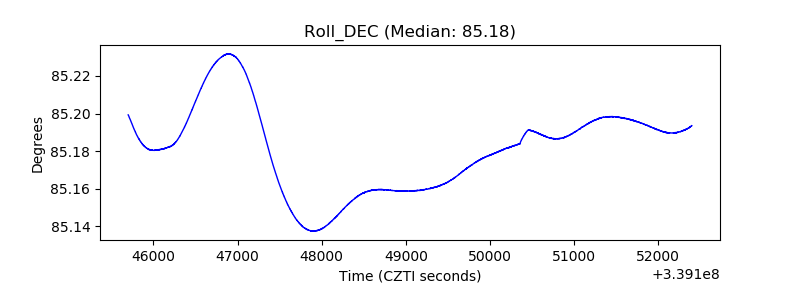 |
| _Roll_RA | 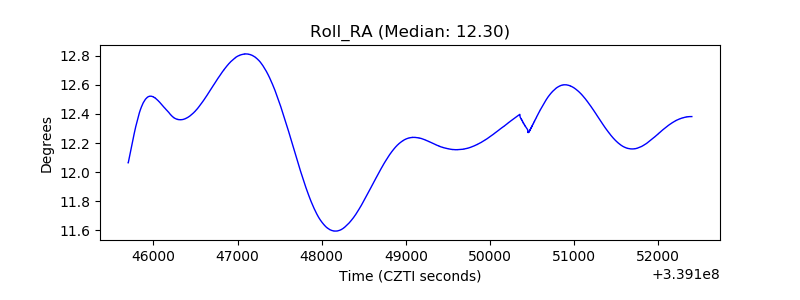 |
| Veto Counter | 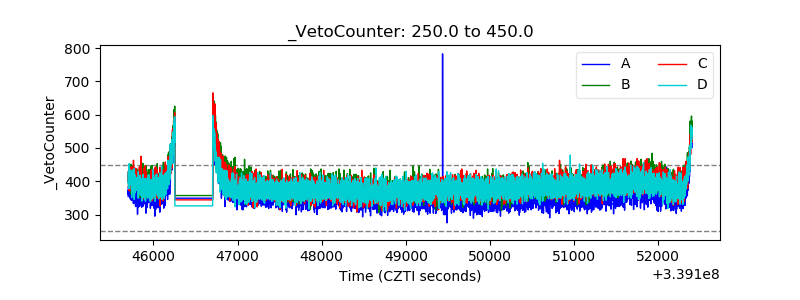 |