| Param | Original file | Final file |
|---|---|---|
| Filename | modeM0/AS1T03_249T01_9000003934_27517cztM0_level2.evt | modeM0/AS1T03_249T01_9000003934_27517cztM0_level2_quad_clean.evt |
| Size (bytes) | 468,809,280 | 101,010,240 |
| Size | 447.1 MB | 96.3 MB |
| Events in quadrant A | 3,270,801 | 671,370 |
| Events in quadrant B | 3,351,414 | 688,372 |
| Events in quadrant C | 3,273,399 | 641,770 |
| Events in quadrant D | 3,870,415 | 613,817 |
| Mode M0 | |||
|---|---|---|---|
| Quadrant | BADHDUFLAG | Total packets | Discarded packets |
| A | 0 | 13414 | 0 |
| B | 0 | 13742 | 0 |
| C | 0 | 13438 | 0 |
| D | 0 | 15538 | 0 |
| Mode M9 | |||
|---|---|---|---|
| Quadrant | BADHDUFLAG | Total packets | Discarded packets |
| A | 0 | 13 | 0 |
| B | 0 | 13 | 0 |
| C | 0 | 13 | 0 |
| D | 0 | 13 | 0 |
| Quadrant | Total seconds | Saturated seconds | Saturation percentage |
|---|---|---|---|
| A | 6357 | 34 | 0.534843% |
| B | 6358 | 57 | 0.896508% |
| C | 6358 | 94 | 1.478452% |
| D | 6358 | 143 | 2.249135% |
Noise dominated data is calculated using 1-second bins in cleaned event files. If a bin has >2000 counts, and if more than 50% of those come from <1% of pixels, then it is considered to be noise-dominated and hence unusable.
| Quadrant | # 1 sec bins | Bins with >0 counts | Bins with >2000 counts | High rate bins dominated by noise | Noise dominated (total time) | Noise dominated (detector-on time) | Marked lightcurve |
|---|---|---|---|---|---|---|---|
| A | 7677 | 6358 | 0 | 0 | 0.00% | 0.00% | 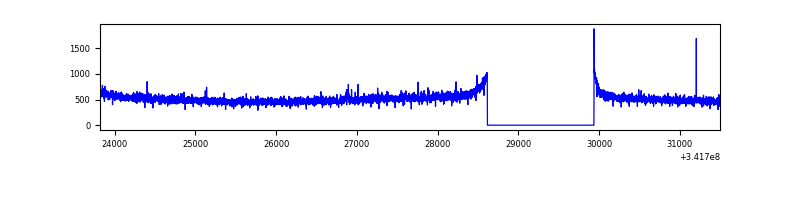 |
| B | 7678 | 6359 | 1 | 1 | 0.01% | 0.02% | 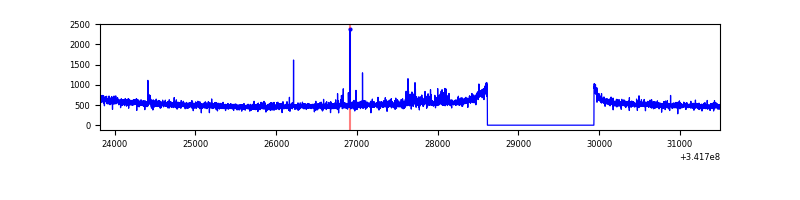 |
| C | 7678 | 6359 | 0 | 0 | 0.00% | 0.00% |  |
| D | 7678 | 6359 | 139 | 139 | 1.81% | 2.19% | 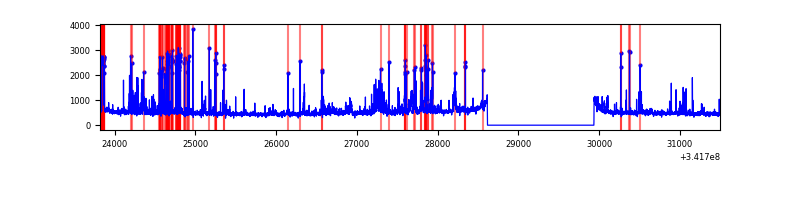 |
Top three noisy pixels from each quadrant. If the there are fewer than three noisy pixels in the level2.evt file, extra rows are filled as -1
| Pixel properties | Quadrant properties | ||||||
|---|---|---|---|---|---|---|---|
| Quadrant | DetID | PixID | Counts | Sigma | Mean | Median | Sigma |
| A | 15 | 174 | 11394 | 63.0 | 844 | 829 | 167.7 |
| A | 13 | 254 | 9305 | 50.55 | 844 | 829 | 167.7 |
| A | 3 | 137 | 7444 | 39.45 | 844 | 829 | 167.7 |
| B | 15 | 32 | 34547 | 212.99 | 842 | 822 | 158.3 |
| B | 12 | 111 | 19071 | 115.25 | 842 | 822 | 158.3 |
| B | 11 | 111 | 16639 | 99.89 | 842 | 822 | 158.3 |
| C | 14 | 238 | 131852 | 695.56 | 806 | 813 | 188.4 |
| C | 13 | 61 | 5367 | 24.17 | 806 | 813 | 188.4 |
| C | 3 | 233 | 3603 | 14.81 | 806 | 813 | 188.4 |
| D | 7 | 80 | 381594 | 2020.15 | 797 | 779 | 188.5 |
| D | 1 | 52 | 296095 | 1566.6 | 797 | 779 | 188.5 |
| D | 11 | 176 | 85991 | 452.03 | 797 | 779 | 188.5 |
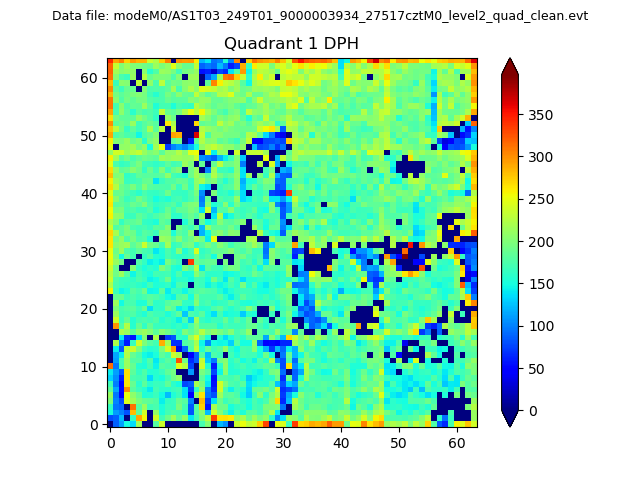
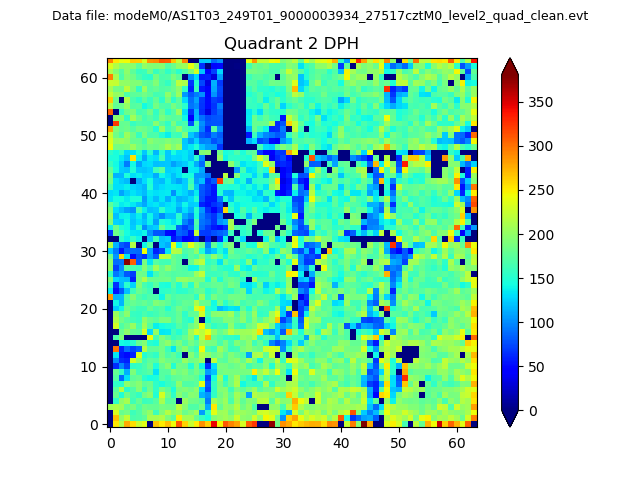
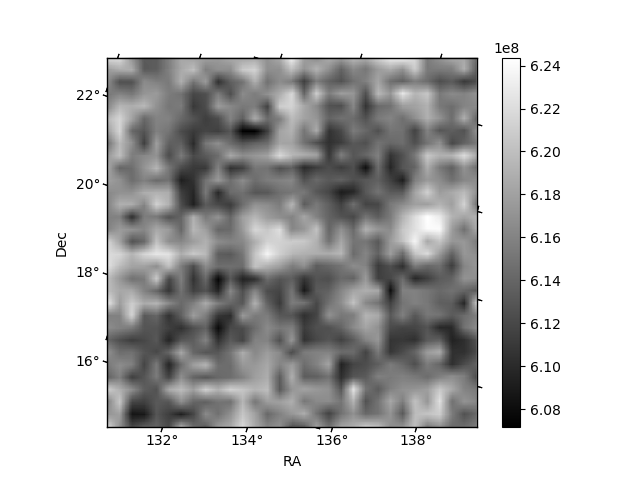
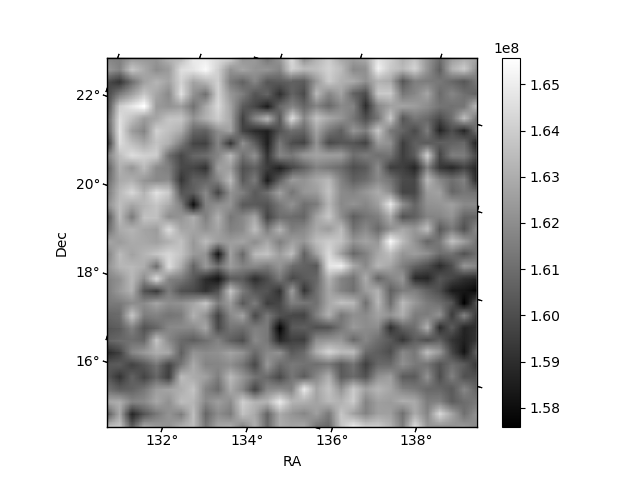
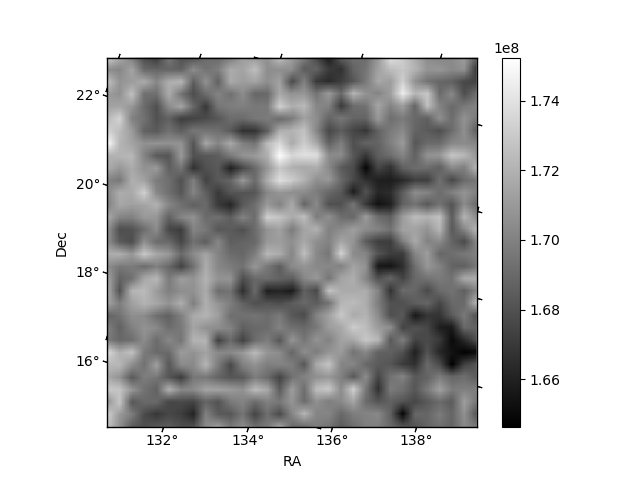
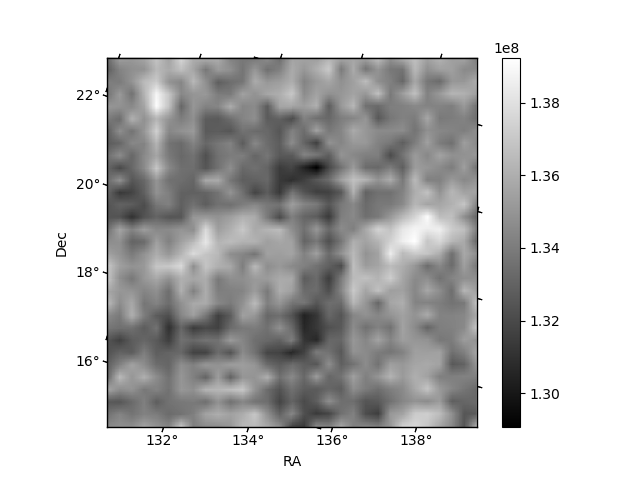
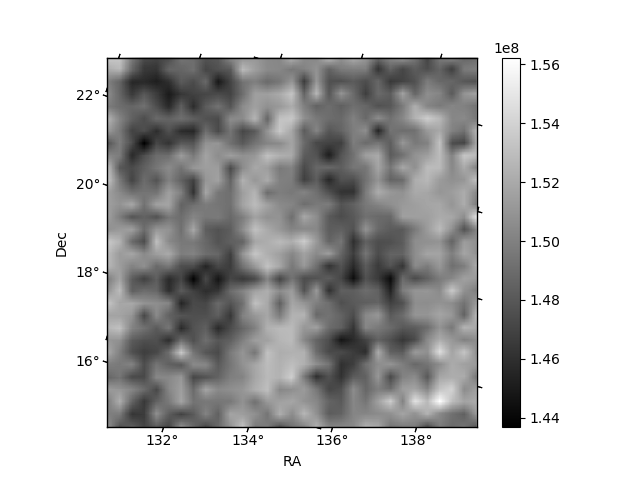
Histogram calculated using DETX and DETY for each event in the final _common_clean file
| Quadrant A | 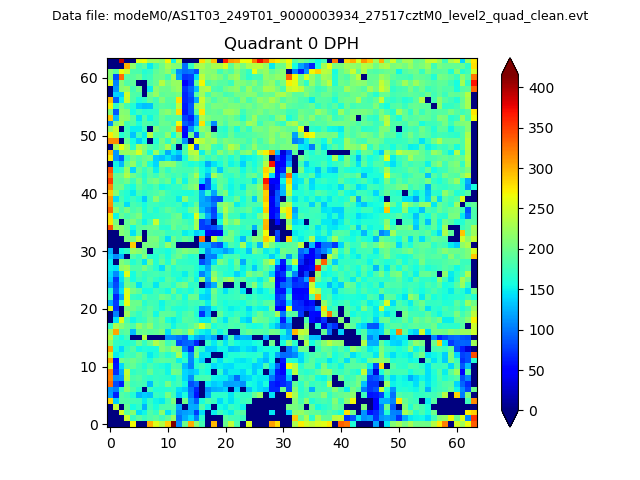 |
 |
Quadrant B |
|---|---|---|---|
| Quadrant D | 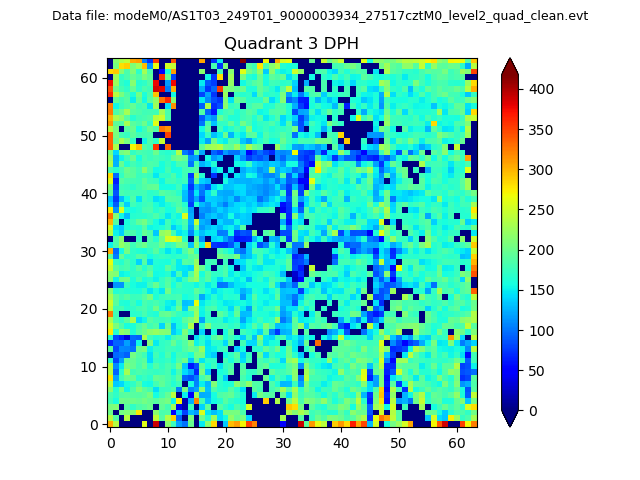 |
 |
Quadrant C |
| Plot type | Count rate plots | Images |
|---|---|---|
| Comparison with Poisson distribution Blue bars denote a histogram of data divided into 1 sec bins. Red curve is a Poisson curve with rate = median count rate of data. |
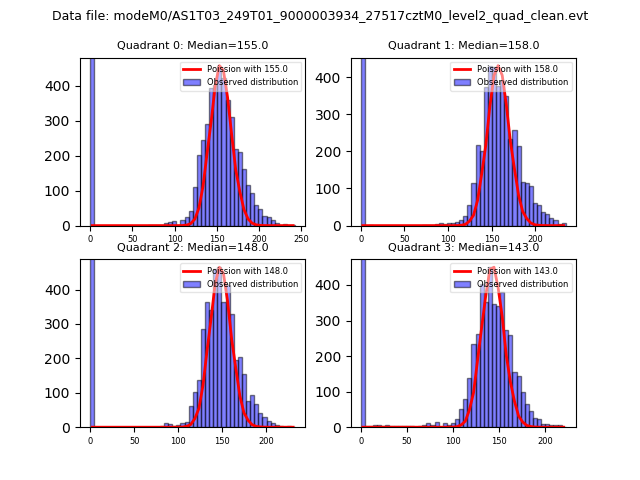 |
 |
| Quadrant-wise count rates Data is divided into 100 sec bins |
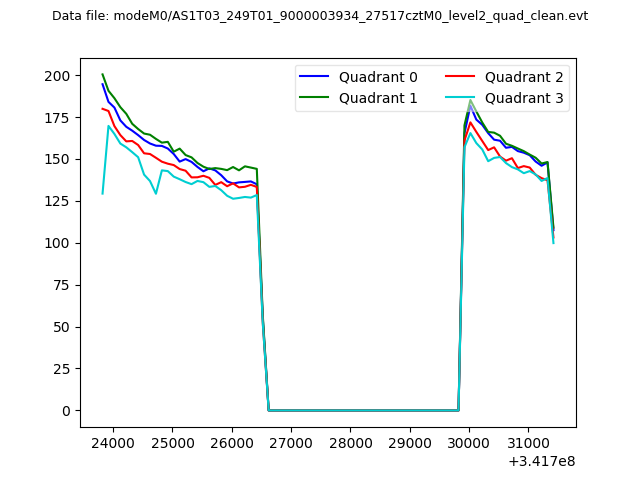 |
|
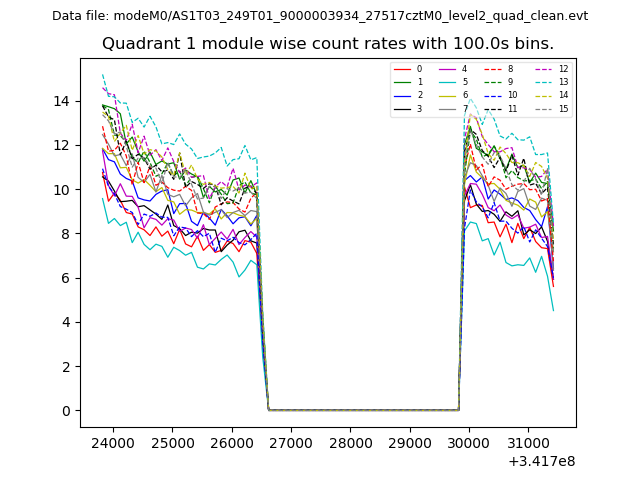
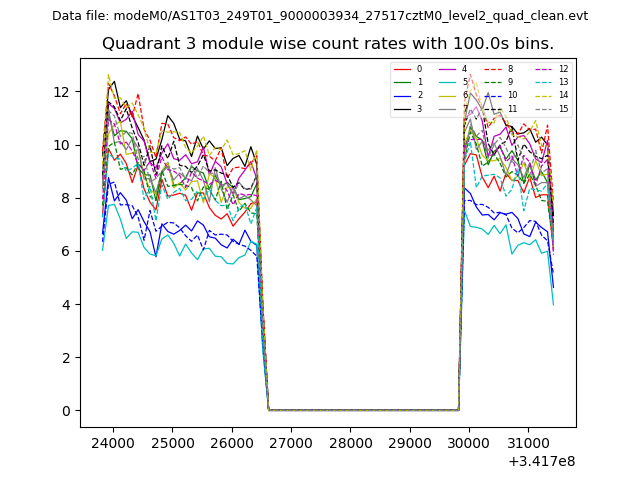
| Module-wise count rates for Quadrant A Data is divided into 100 sec bins |
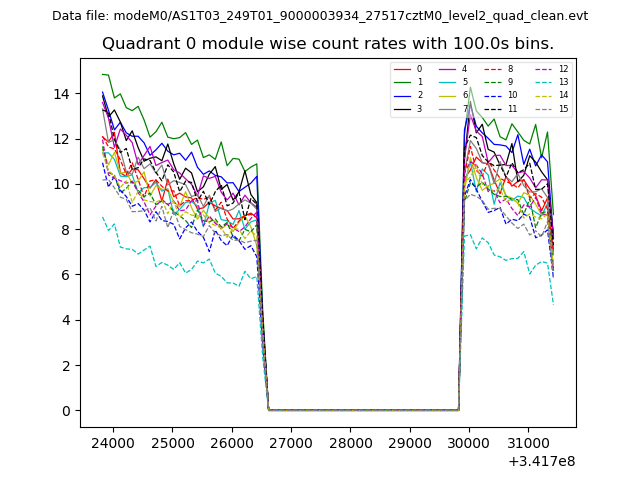 |
 |
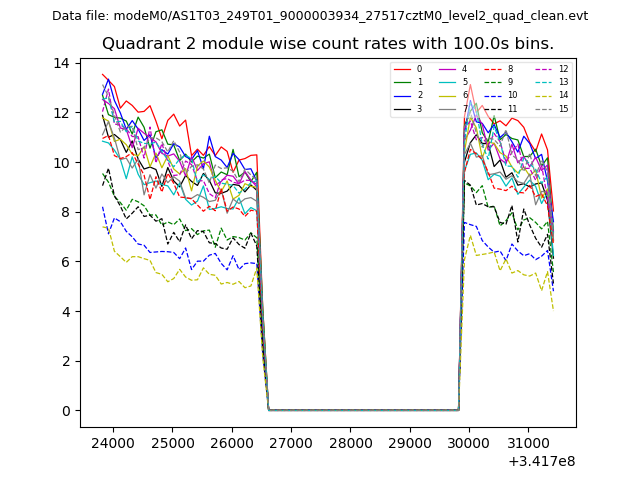
| Module-wise count rates for Quadrant B Data is divided into 100 sec bins |
 |
 |
| Module-wise count rates for Quadrant C Data is divided into 100 sec bins |
 |
 |
| Module-wise count rates for Quadrant D Data is divided into 100 sec bins |
 |
 |
| Parameter | Plot |
|---|---|
| CZT HV Monitor | 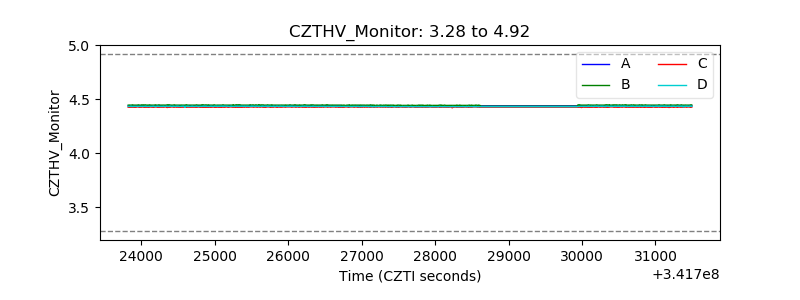 |
| D_VDD | 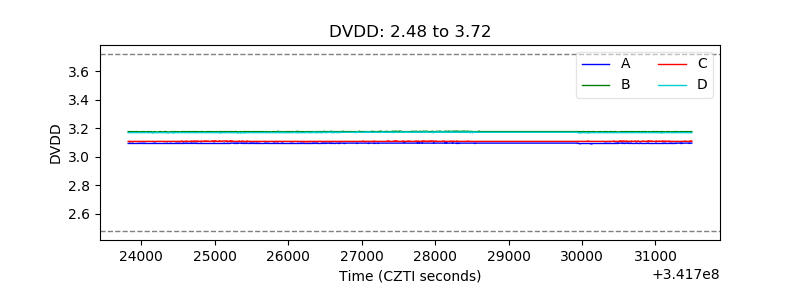 |
| Temperature 1 | 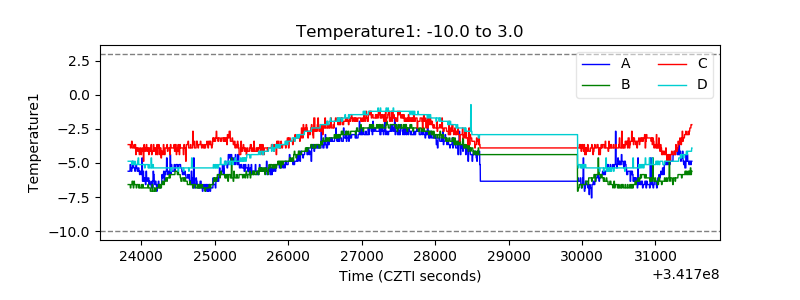 |
| Veto HV Monitor | 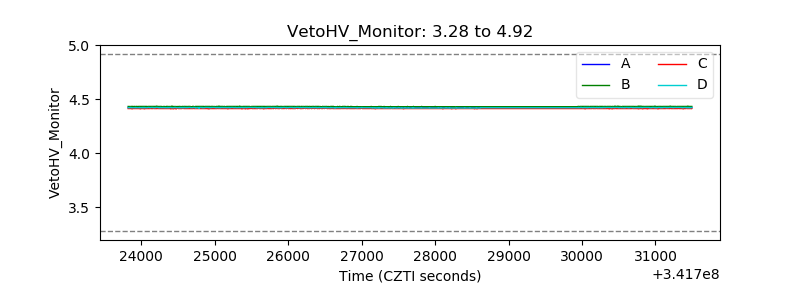 |
| Veto LLD | 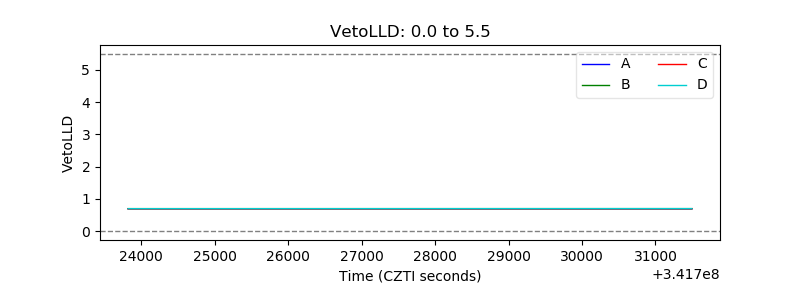 |
| Alpha Counter | 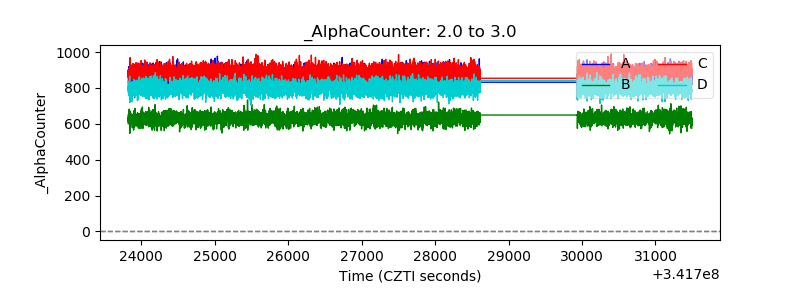 |
| _CPM_Rate | 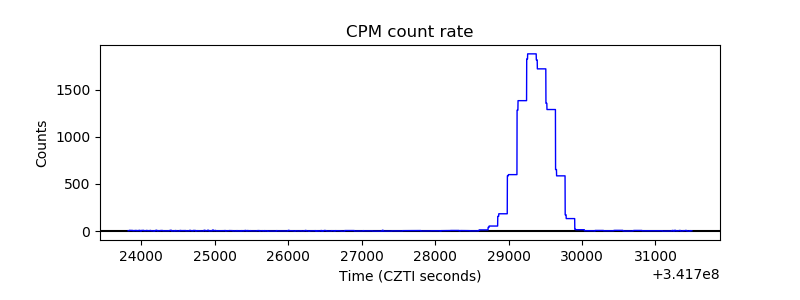 |
| CZT Counter | 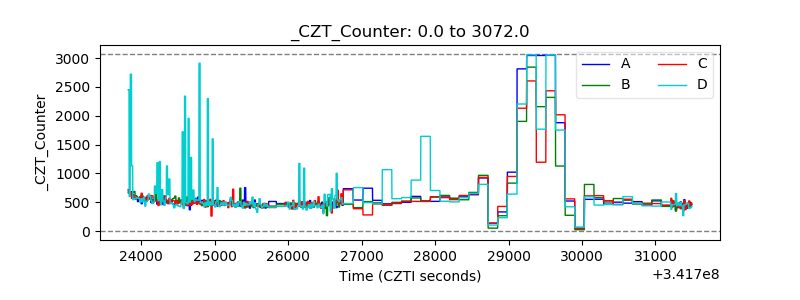 |
| +2.5 Volts monitor |  |
| +5 Volts monitor |  |
| _ROLL_ROT | 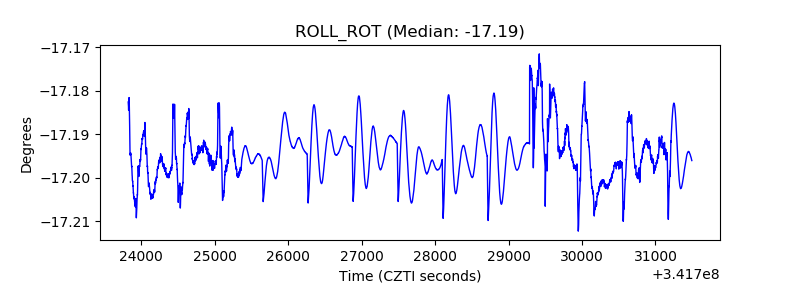 |
| _Roll_DEC | 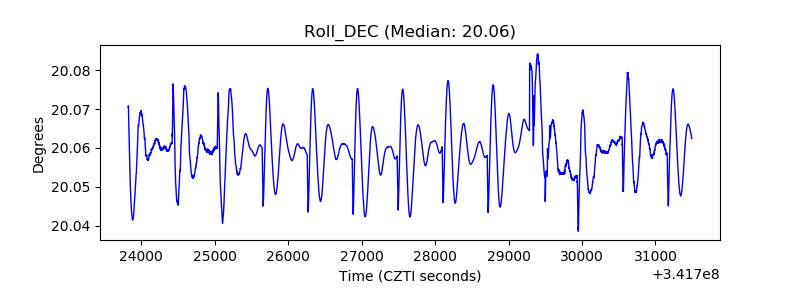 |
| _Roll_RA | 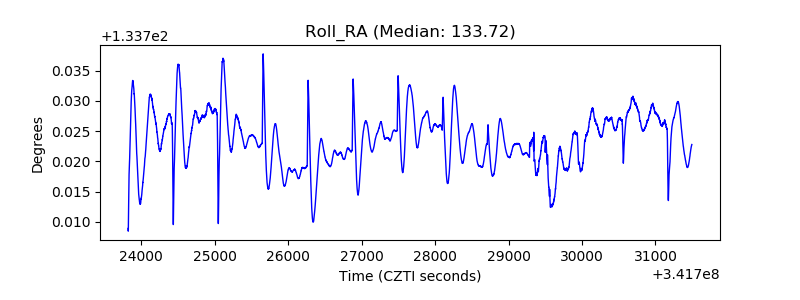 |
| Veto Counter | 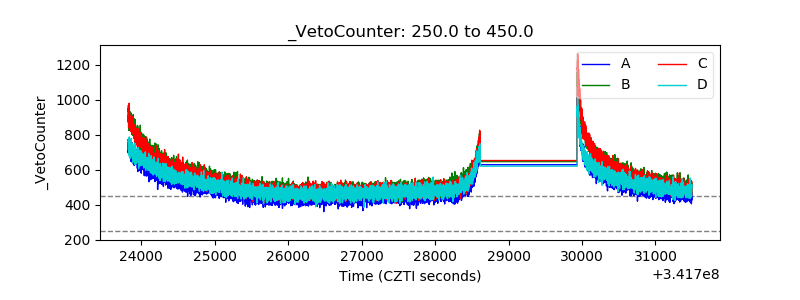 |