| Param | Original file | Final file |
|---|---|---|
| Filename | modeM0/AS1A09_038T27_9000003950_27541cztM0_level2.evt | modeM0/AS1A09_038T27_9000003950_27541cztM0_level2_quad_clean.evt |
| Size (bytes) | 317,148,480 | 71,265,600 |
| Size | 302.5 MB | 68.0 MB |
| Events in quadrant A | 2,142,383 | 468,263 |
| Events in quadrant B | 2,400,739 | 478,047 |
| Events in quadrant C | 2,205,394 | 453,783 |
| Events in quadrant D | 2,545,254 | 437,433 |
| Mode M9 | |||
|---|---|---|---|
| Quadrant | BADHDUFLAG | Total packets | Discarded packets |
| A | 0 | 10 | 0 |
| B | 0 | 10 | 0 |
| C | 0 | 10 | 0 |
| D | 0 | 10 | 0 |
| Mode M0 | |||
|---|---|---|---|
| Quadrant | BADHDUFLAG | Total packets | Discarded packets |
| A | 0 | 9348 | 0 |
| B | 0 | 10099 | 0 |
| C | 0 | 9418 | 0 |
| D | 0 | 10601 | 0 |
| Quadrant | Total seconds | Saturated seconds | Saturation percentage |
|---|---|---|---|
| A | 4557 | 27 | 0.592495% |
| B | 4556 | 81 | 1.777875% |
| C | 4556 | 41 | 0.899912% |
| D | 4556 | 74 | 1.624232% |
Noise dominated data is calculated using 1-second bins in cleaned event files. If a bin has >2000 counts, and if more than 50% of those come from <1% of pixels, then it is considered to be noise-dominated and hence unusable.
| Quadrant | # 1 sec bins | Bins with >0 counts | Bins with >2000 counts | High rate bins dominated by noise | Noise dominated (total time) | Noise dominated (detector-on time) | Marked lightcurve |
|---|---|---|---|---|---|---|---|
| A | 5622 | 4557 | 0 | 0 | 0.00% | 0.00% | 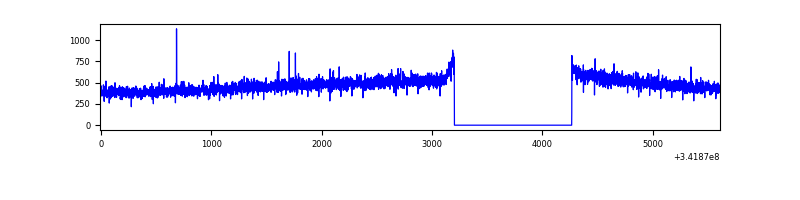 |
| B | 5621 | 4556 | 35 | 35 | 0.62% | 0.77% | 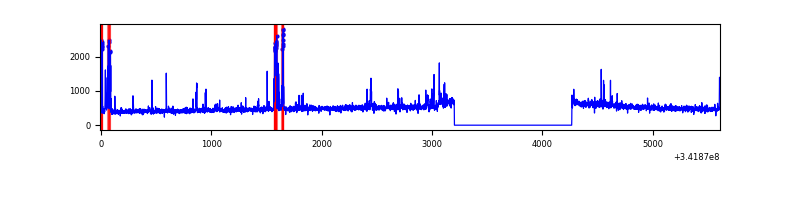 |
| C | 5621 | 4556 | 0 | 0 | 0.00% | 0.00% | 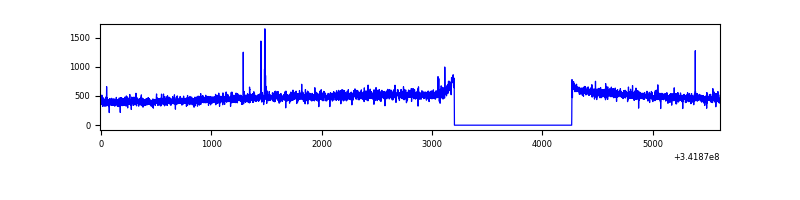 |
| D | 5621 | 4556 | 64 | 64 | 1.14% | 1.40% | 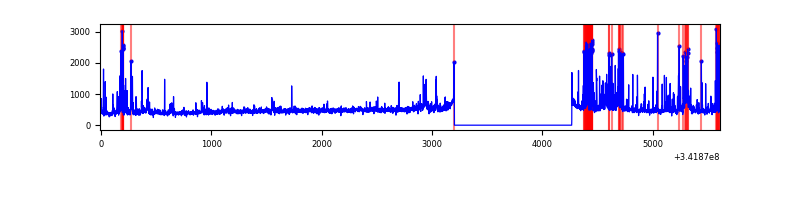 |
Top three noisy pixels from each quadrant. If the there are fewer than three noisy pixels in the level2.evt file, extra rows are filled as -1
| Pixel properties | Quadrant properties | ||||||
|---|---|---|---|---|---|---|---|
| Quadrant | DetID | PixID | Counts | Sigma | Mean | Median | Sigma |
| A | 13 | 254 | 7663 | 63.34 | 554 | 542 | 112.4 |
| A | 3 | 137 | 5428 | 43.46 | 554 | 542 | 112.4 |
| A | 0 | 226 | 4588 | 35.99 | 554 | 542 | 112.4 |
| B | 10 | 245 | 196357 | 1862.63 | 551 | 536 | 105.1 |
| B | 15 | 32 | 14742 | 135.13 | 551 | 536 | 105.1 |
| B | 4 | 200 | 13379 | 122.16 | 551 | 536 | 105.1 |
| C | 14 | 238 | 87366 | 687.91 | 537 | 540 | 126.2 |
| C | 2 | 16 | 14609 | 111.47 | 537 | 540 | 126.2 |
| C | 8 | 128 | 4309 | 29.86 | 537 | 540 | 126.2 |
| D | 1 | 52 | 441825 | 3464.18 | 533 | 517 | 127.4 |
| D | 2 | 250 | 64992 | 506.12 | 533 | 517 | 127.4 |
| D | 2 | 234 | 18417 | 140.51 | 533 | 517 | 127.4 |
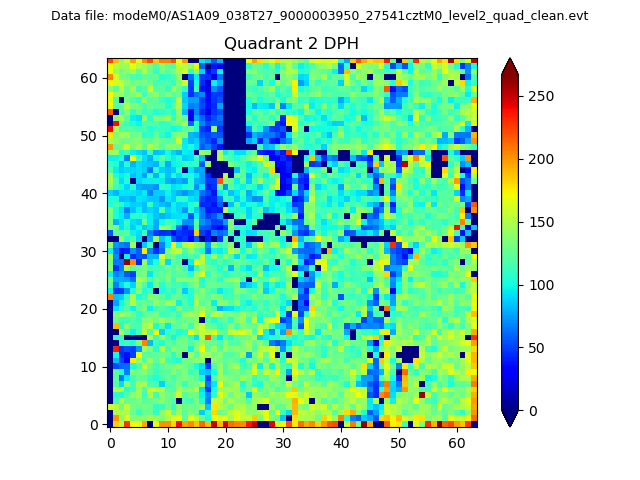
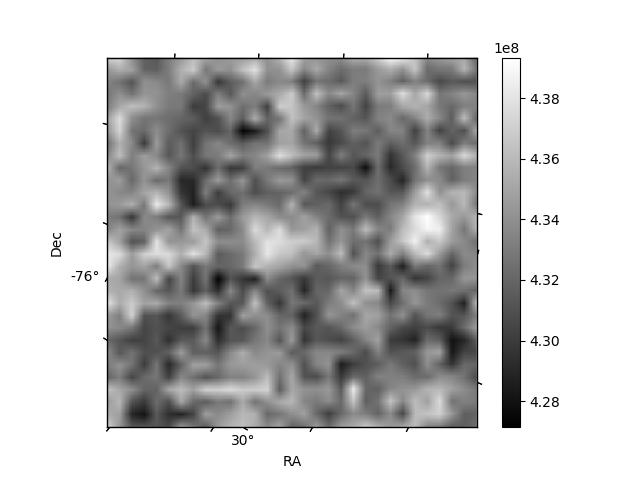
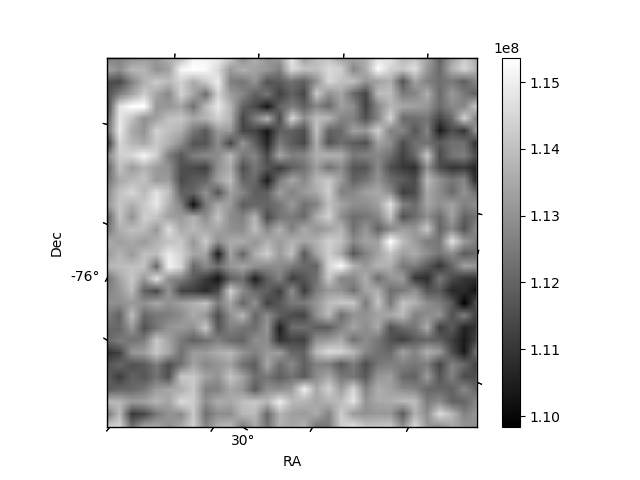
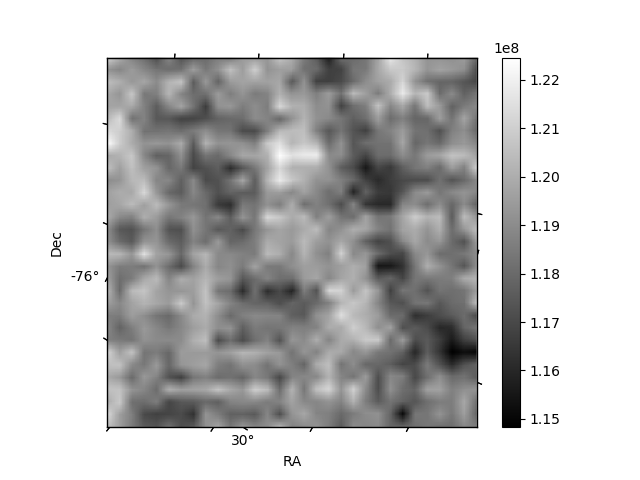
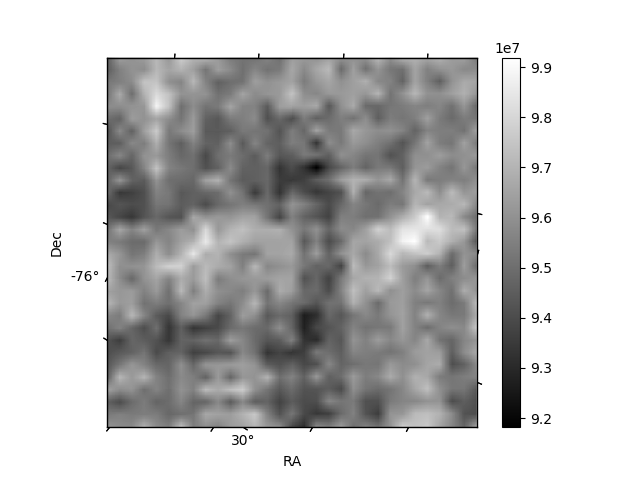
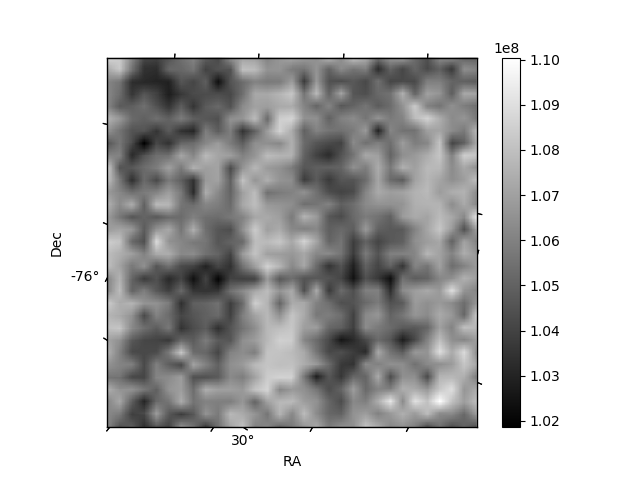
Histogram calculated using DETX and DETY for each event in the final _common_clean file
| Quadrant A | 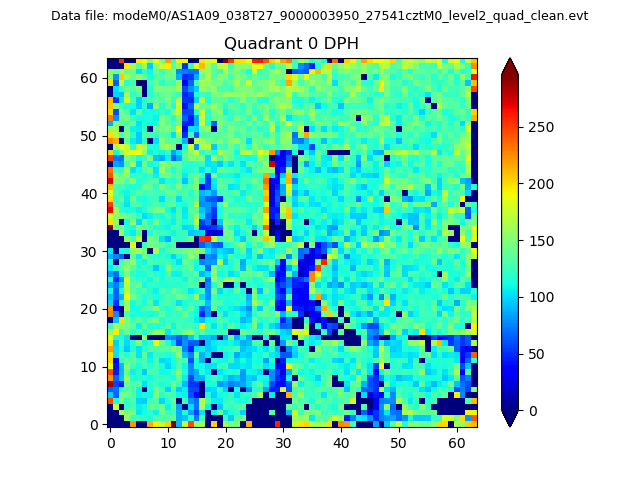 |
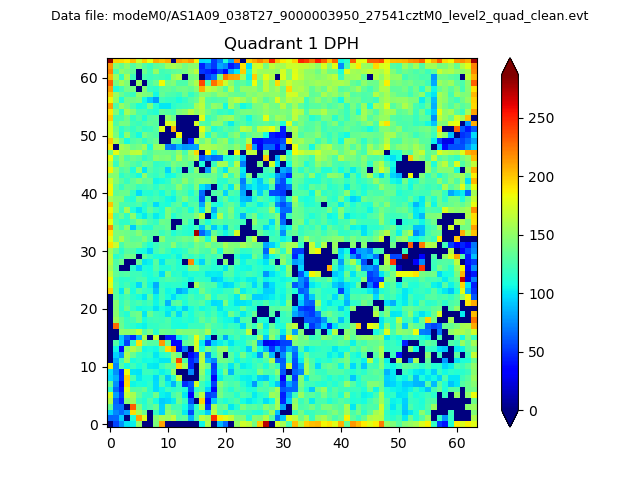 |
Quadrant B |
|---|---|---|---|
| Quadrant D | 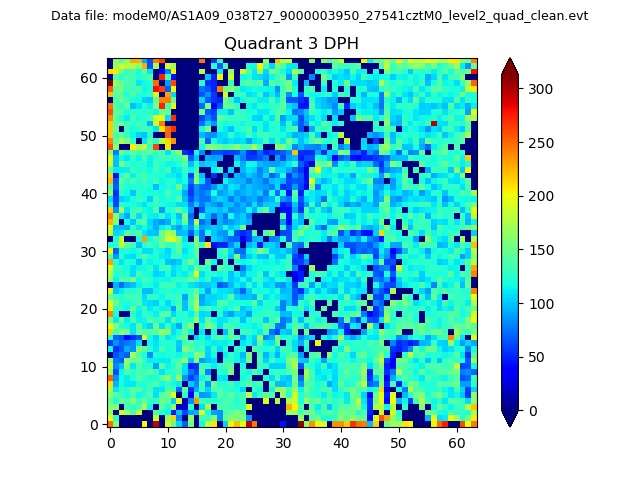 |
 |
Quadrant C |
| Plot type | Count rate plots | Images |
|---|---|---|
| Comparison with Poisson distribution Blue bars denote a histogram of data divided into 1 sec bins. Red curve is a Poisson curve with rate = median count rate of data. |
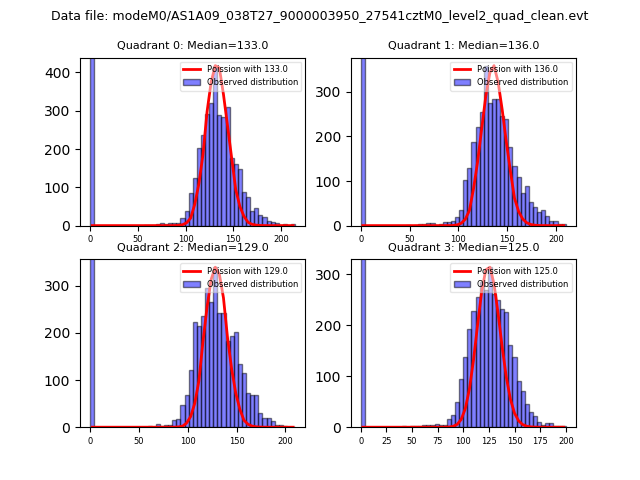 |
 |
| Quadrant-wise count rates Data is divided into 100 sec bins |
 |
|
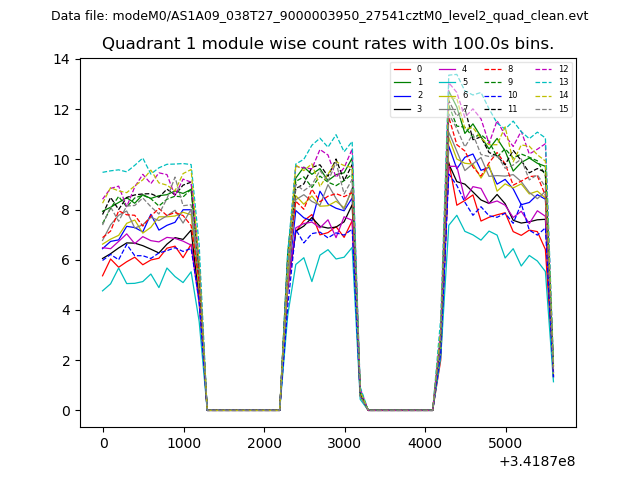
| Module-wise count rates for Quadrant A Data is divided into 100 sec bins |
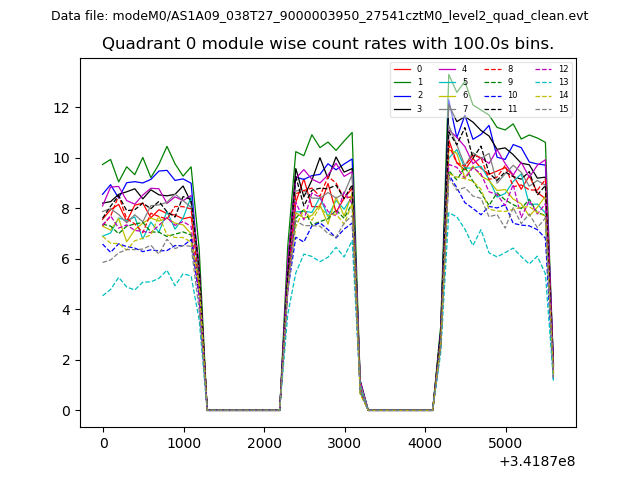 |
 |
| Module-wise count rates for Quadrant B Data is divided into 100 sec bins |
 |
 |
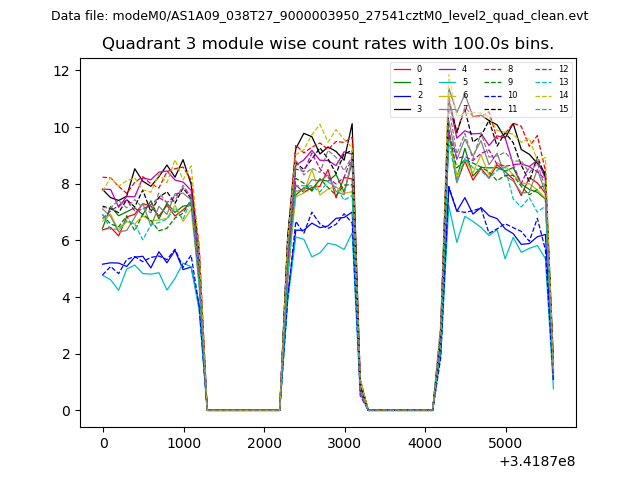
| Module-wise count rates for Quadrant C Data is divided into 100 sec bins |
 |
 |
| Module-wise count rates for Quadrant D Data is divided into 100 sec bins |
 |
 |
| Parameter | Plot |
|---|---|
| CZT HV Monitor | 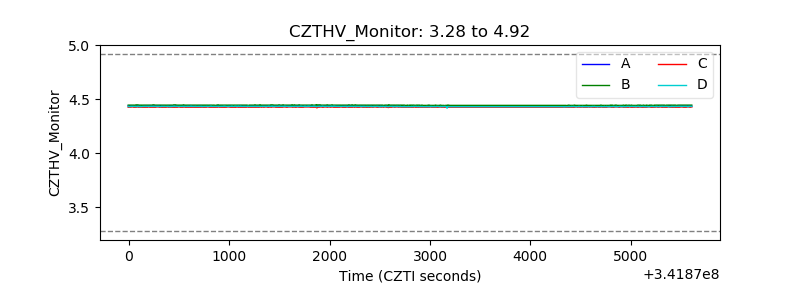 |
| D_VDD | 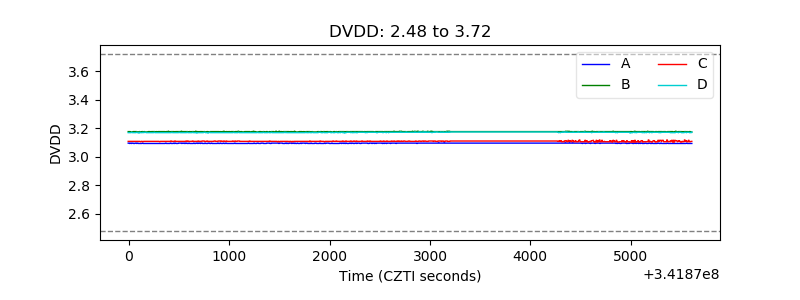 |
| Temperature 1 | 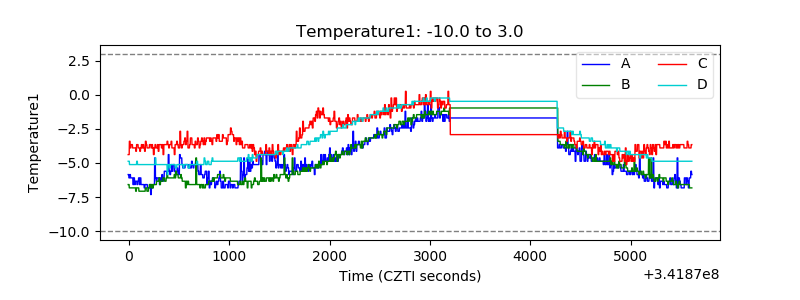 |
| Veto HV Monitor | 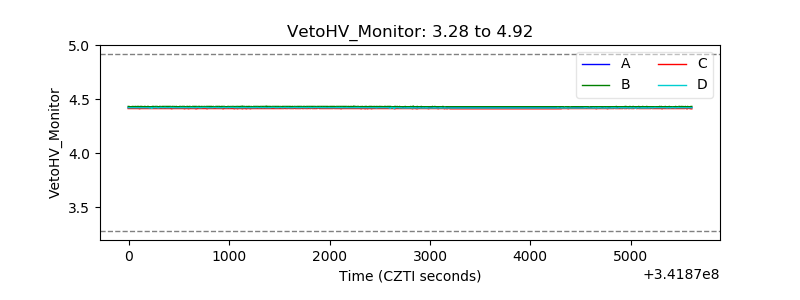 |
| Veto LLD | 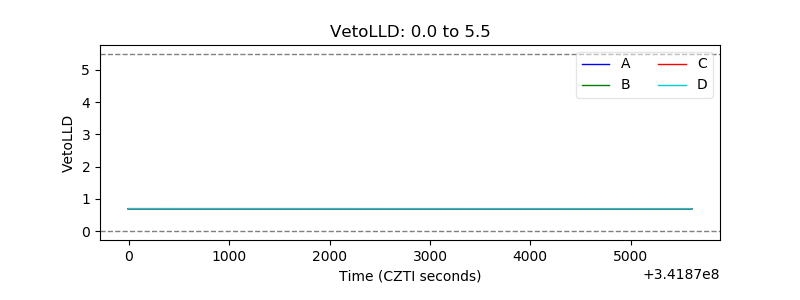 |
| Alpha Counter |  |
| _CPM_Rate | 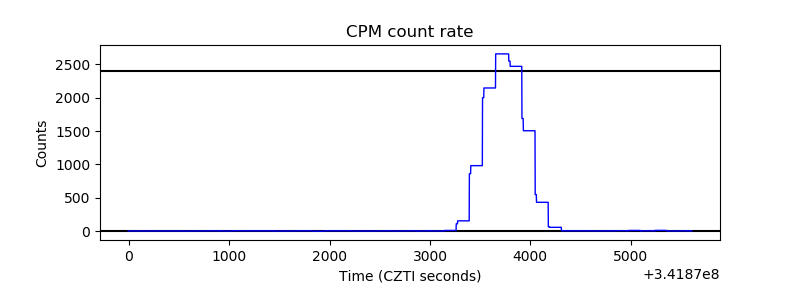 |
| CZT Counter | 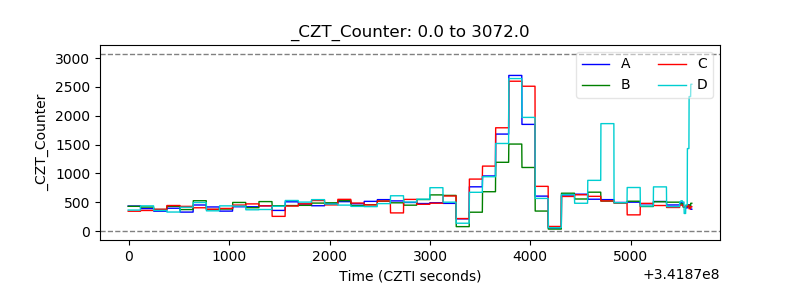 |
| +2.5 Volts monitor | 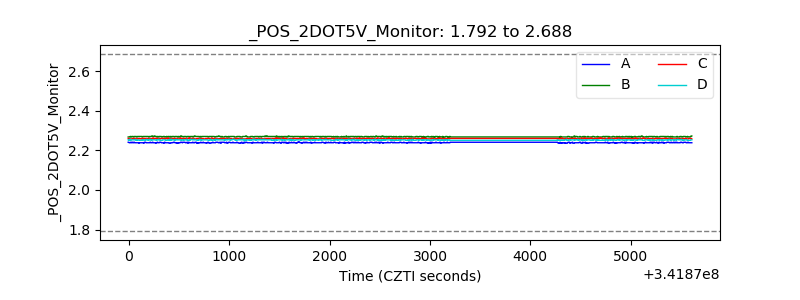 |
| +5 Volts monitor |  |
| _ROLL_ROT | 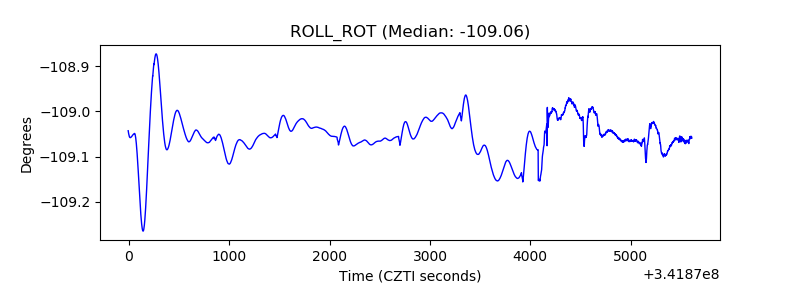 |
| _Roll_DEC | 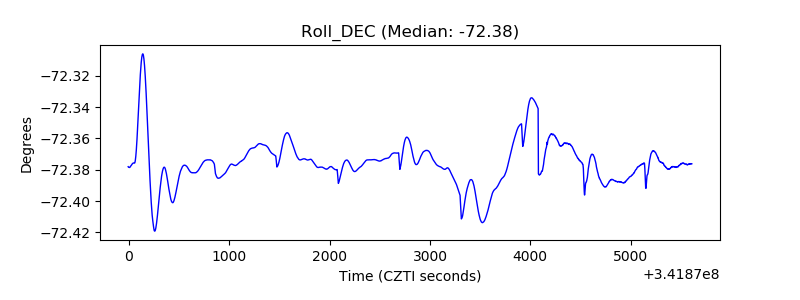 |
| _Roll_RA | 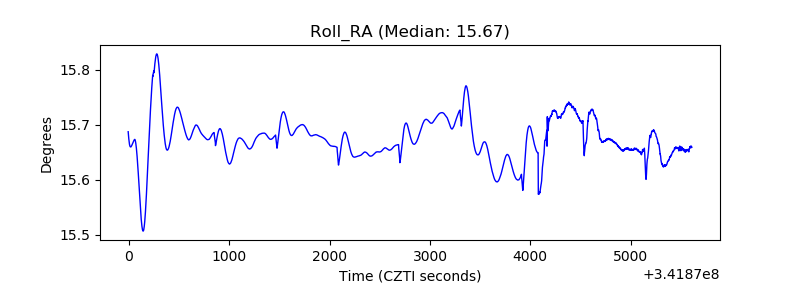 |
| Veto Counter | 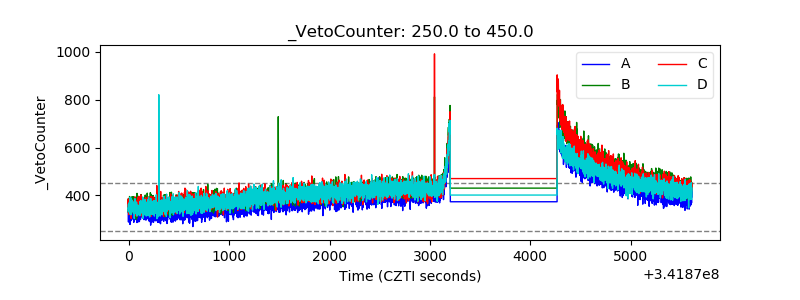 |