| Param | Original file | Final file |
|---|---|---|
| Filename | modeM0/AS1A10_016T01_9000004034_28133cztM0_level2.evt | modeM0/AS1A10_016T01_9000004034_28133cztM0_level2_quad_clean.evt |
| Size (bytes) | 193,921,920 | 39,254,400 |
| Size | 184.9 MB | 37.4 MB |
| Events in quadrant A | 1,301,913 | 257,738 |
| Events in quadrant B | 1,322,299 | 257,919 |
| Events in quadrant C | 1,326,180 | 242,172 |
| Events in quadrant D | 1,743,089 | 243,437 |
| Mode M0 | |||
|---|---|---|---|
| Quadrant | BADHDUFLAG | Total packets | Discarded packets |
| A | 0 | 5403 | 0 |
| B | 0 | 5435 | 0 |
| C | 0 | 5482 | 0 |
| D | 0 | 6923 | 0 |
| Mode M9 | |||
|---|---|---|---|
| Quadrant | BADHDUFLAG | Total packets | Discarded packets |
| A | 0 | 7 | 0 |
| B | 0 | 8 | 1 |
| C | 0 | 7 | 0 |
| D | 0 | 7 | 0 |
| Quadrant | Total seconds | Saturated seconds | Saturation percentage |
|---|---|---|---|
| A | 2597 | 39 | 1.501733% |
| B | 2582 | 52 | 2.013943% |
| C | 2562 | 59 | 2.302888% |
| D | 2594 | 87 | 3.353894% |
Noise dominated data is calculated using 1-second bins in cleaned event files. If a bin has >2000 counts, and if more than 50% of those come from <1% of pixels, then it is considered to be noise-dominated and hence unusable.
| Quadrant | # 1 sec bins | Bins with >0 counts | Bins with >2000 counts | High rate bins dominated by noise | Noise dominated (total time) | Noise dominated (detector-on time) | Marked lightcurve |
|---|---|---|---|---|---|---|---|
| A | 3523 | 2665 | 0 | 0 | 0.00% | 0.00% | 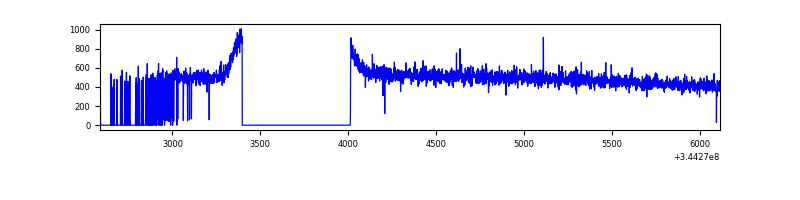 |
| B | 3492 | 2658 | 0 | 0 | 0.00% | 0.00% | 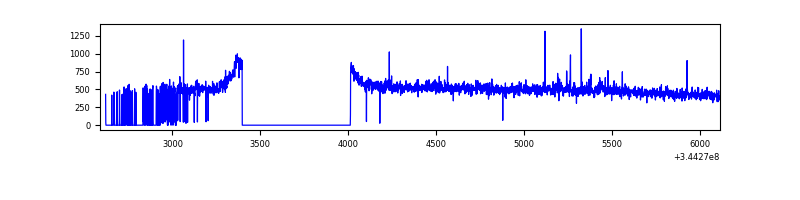 |
| C | 3501 | 2648 | 0 | 0 | 0.00% | 0.00% | 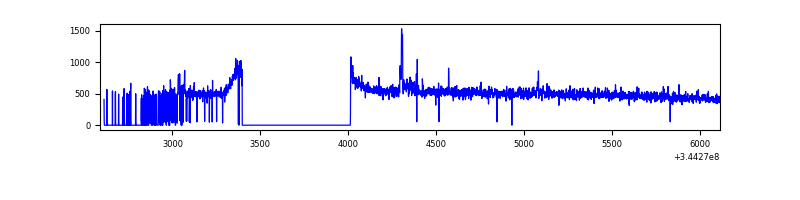 |
| D | 3524 | 2667 | 40 | 40 | 1.14% | 1.50% | 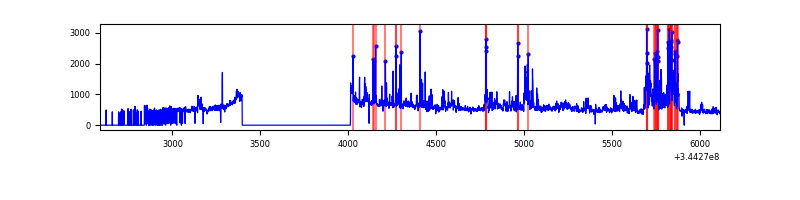 |
Top three noisy pixels from each quadrant. If the there are fewer than three noisy pixels in the level2.evt file, extra rows are filled as -1
| Pixel properties | Quadrant properties | ||||||
|---|---|---|---|---|---|---|---|
| Quadrant | DetID | PixID | Counts | Sigma | Mean | Median | Sigma |
| A | 13 | 254 | 4285 | 56.35 | 336 | 328 | 70.2 |
| A | 3 | 137 | 3486 | 44.97 | 336 | 328 | 70.2 |
| A | 0 | 226 | 2887 | 36.44 | 336 | 328 | 70.2 |
| B | 4 | 200 | 9376 | 136.64 | 331 | 322 | 66.3 |
| B | 12 | 111 | 8169 | 118.43 | 331 | 322 | 66.3 |
| B | 11 | 111 | 7562 | 109.27 | 331 | 322 | 66.3 |
| C | 14 | 238 | 51091 | 659.91 | 317 | 318 | 76.9 |
| C | 3 | 233 | 34641 | 446.11 | 317 | 318 | 76.9 |
| C | 2 | 16 | 3669 | 43.55 | 317 | 318 | 76.9 |
| D | 2 | 250 | 171345 | 2119.65 | 325 | 315 | 80.7 |
| D | 1 | 52 | 118358 | 1462.96 | 325 | 315 | 80.7 |
| D | 8 | 195 | 101905 | 1259.05 | 325 | 315 | 80.7 |
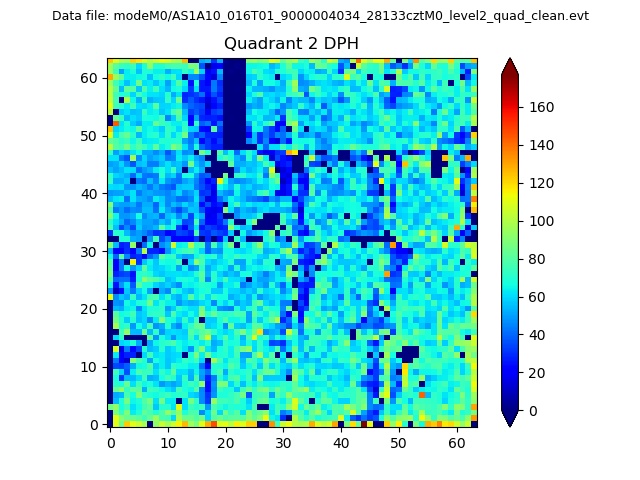
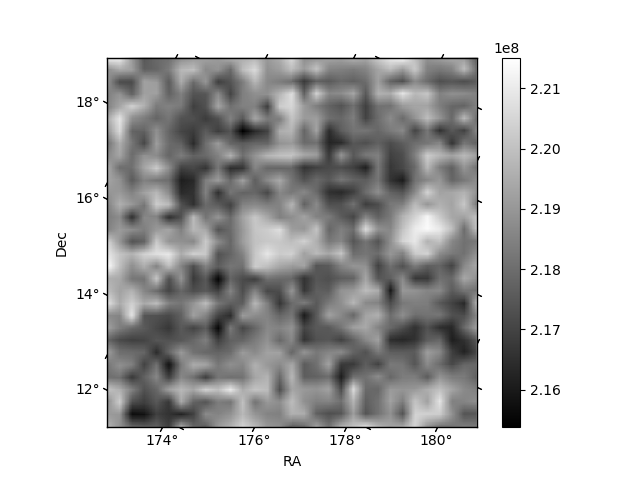
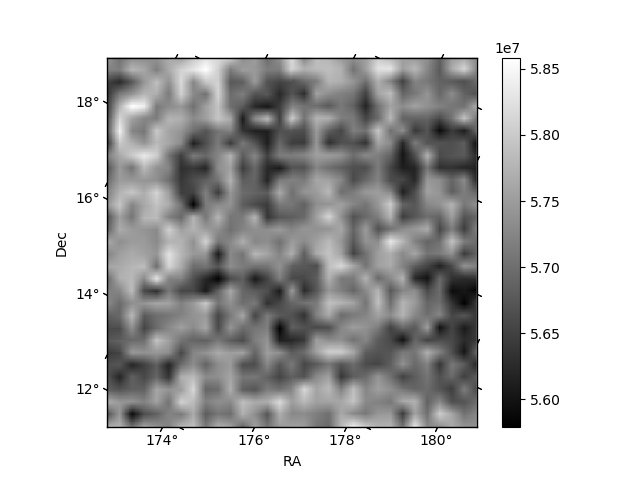
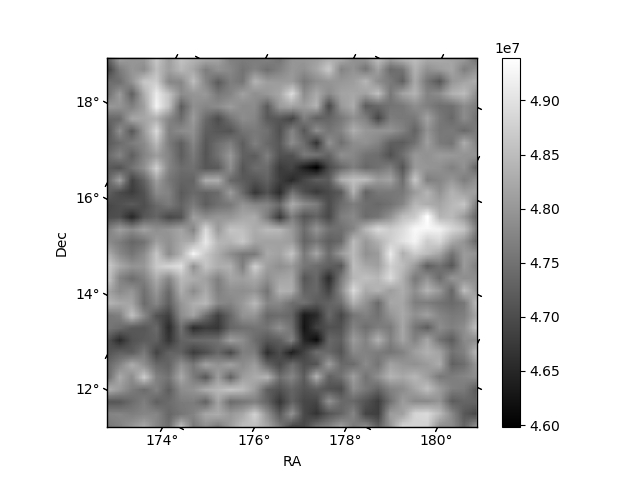
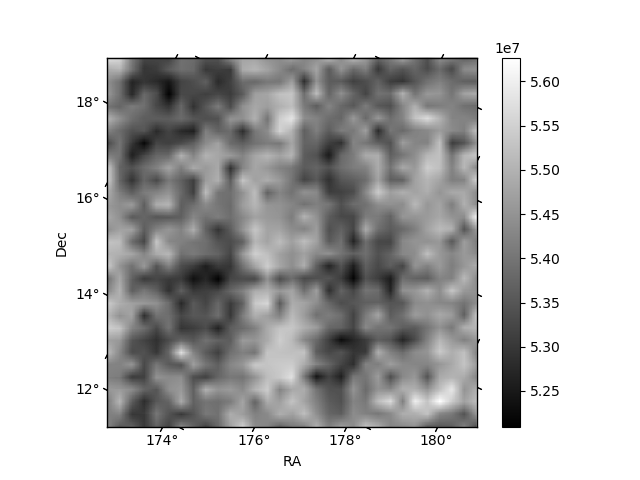
Histogram calculated using DETX and DETY for each event in the final _common_clean file
| Quadrant A | 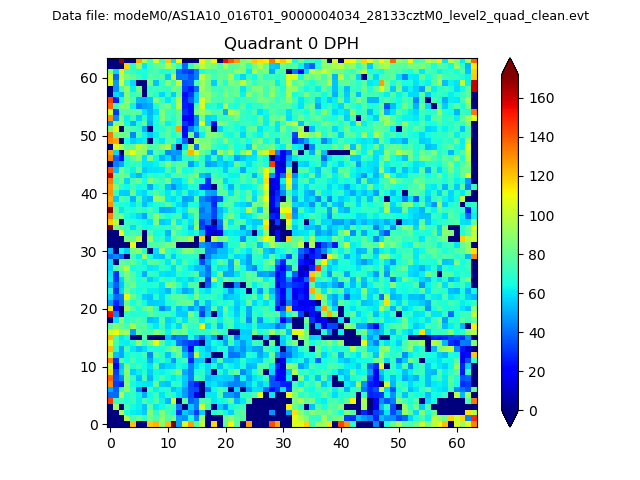 |
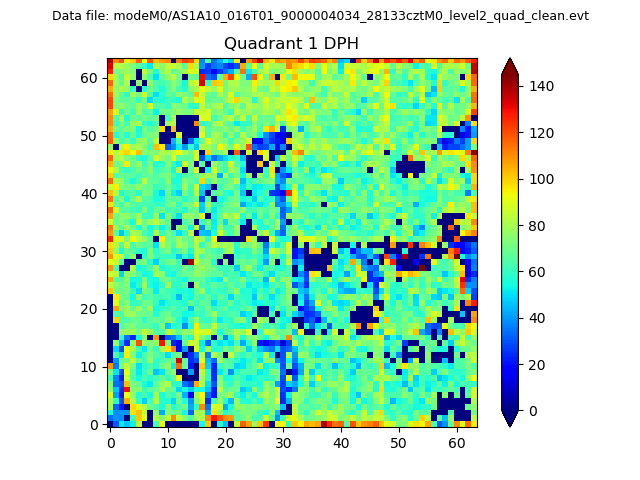 |
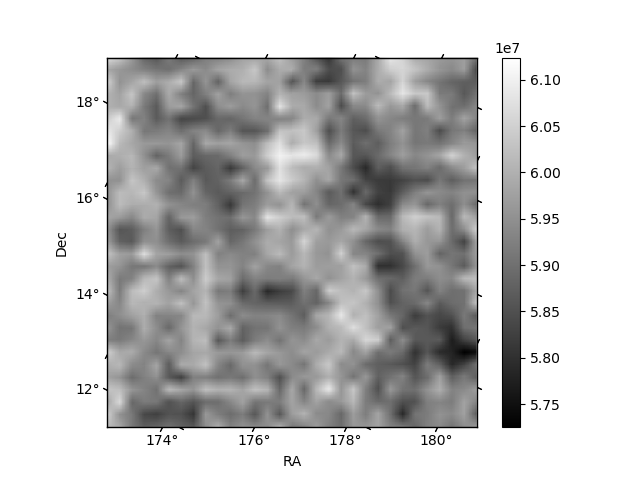
Quadrant B |
|---|---|---|---|
| Quadrant D | 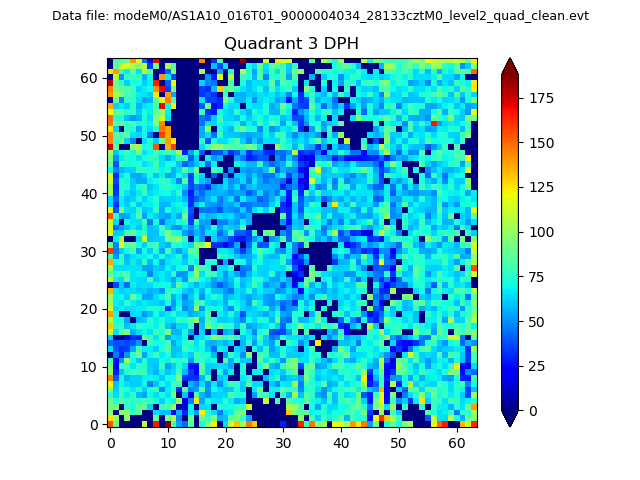 |
 |
Quadrant C |
| Plot type | Count rate plots | Images |
|---|---|---|
| Comparison with Poisson distribution Blue bars denote a histogram of data divided into 1 sec bins. Red curve is a Poisson curve with rate = median count rate of data. |
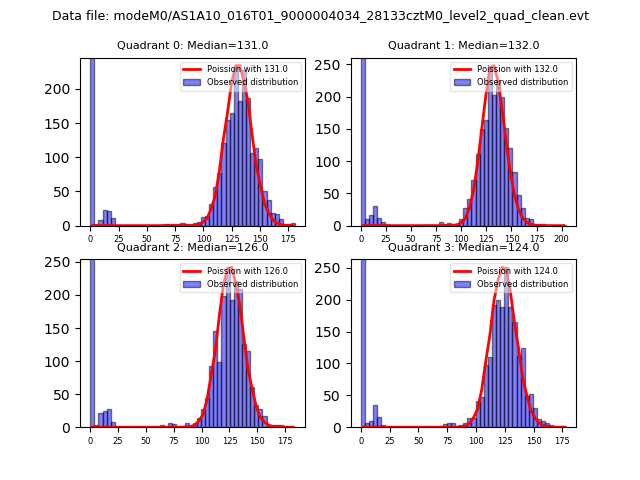 |
 |
| Quadrant-wise count rates Data is divided into 100 sec bins |
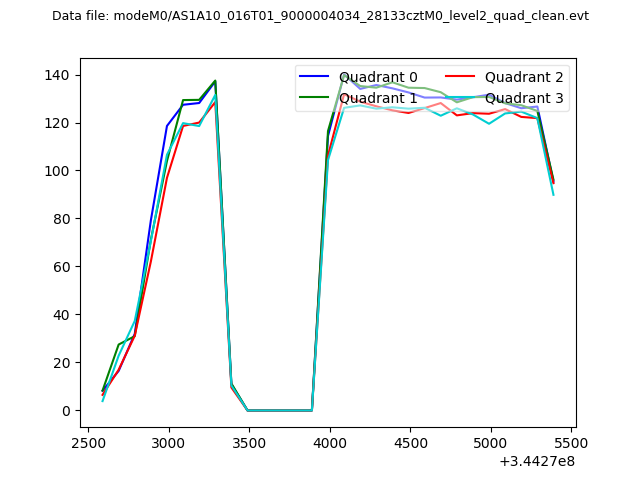 |
|
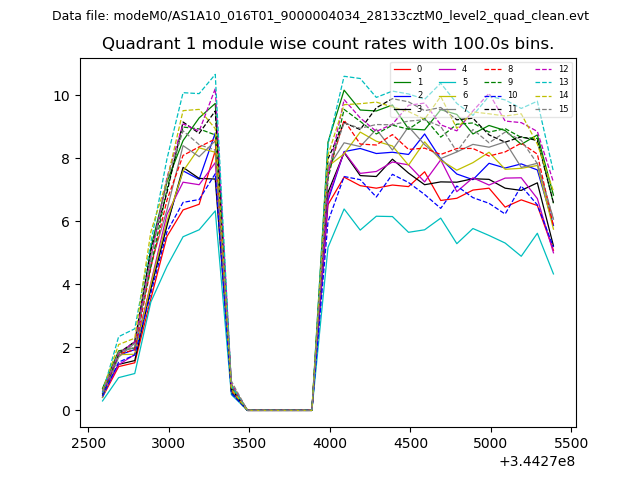
| Module-wise count rates for Quadrant A Data is divided into 100 sec bins |
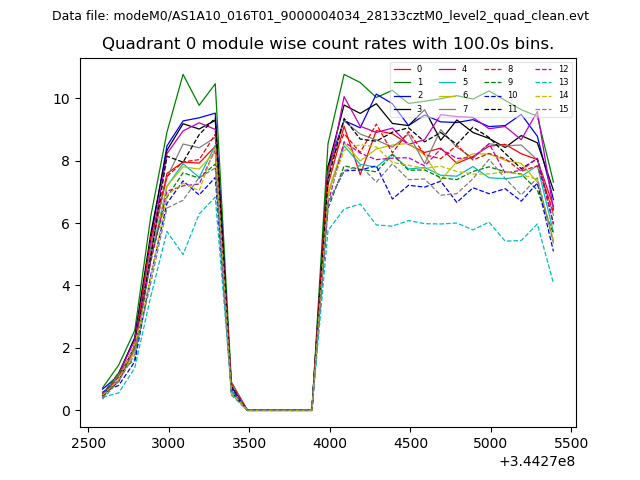 |
 |
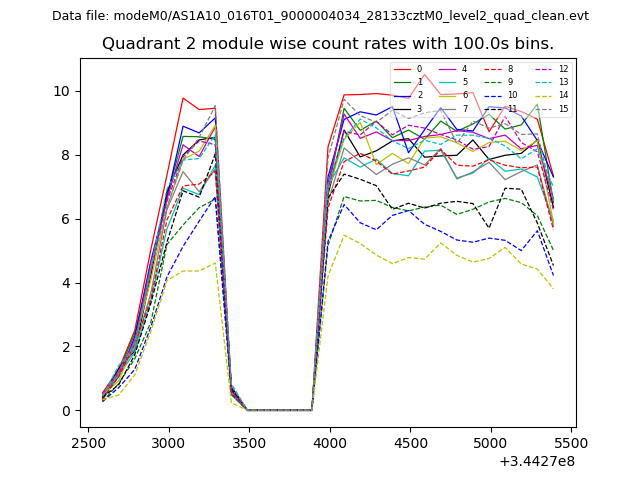
| Module-wise count rates for Quadrant B Data is divided into 100 sec bins |
 |
 |
| Module-wise count rates for Quadrant C Data is divided into 100 sec bins |
 |
 |
| Module-wise count rates for Quadrant D Data is divided into 100 sec bins |
 |
 |
| Parameter | Plot |
|---|---|
| CZT HV Monitor | 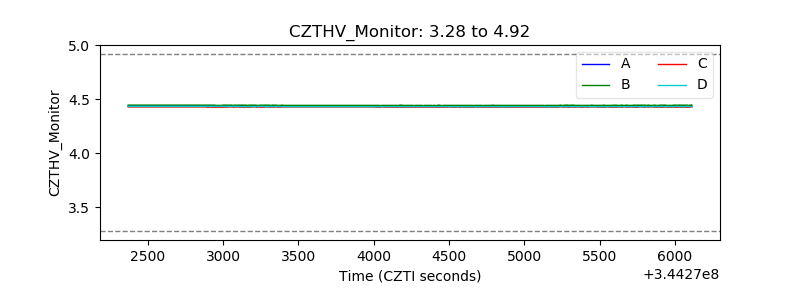 |
| D_VDD | 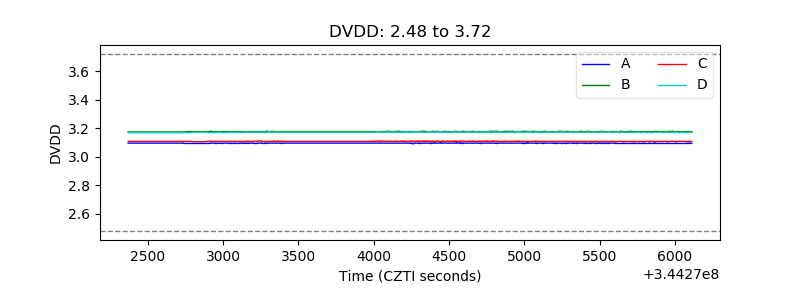 |
| Temperature 1 | 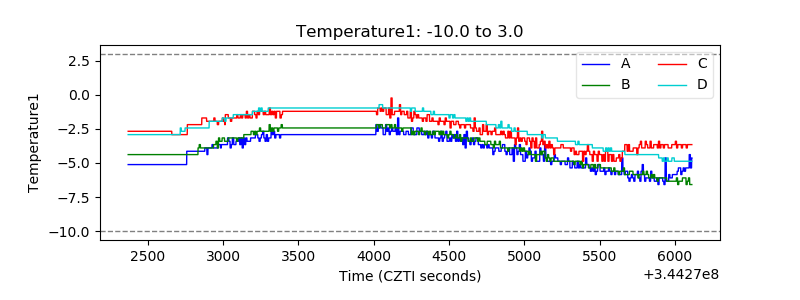 |
| Veto HV Monitor | 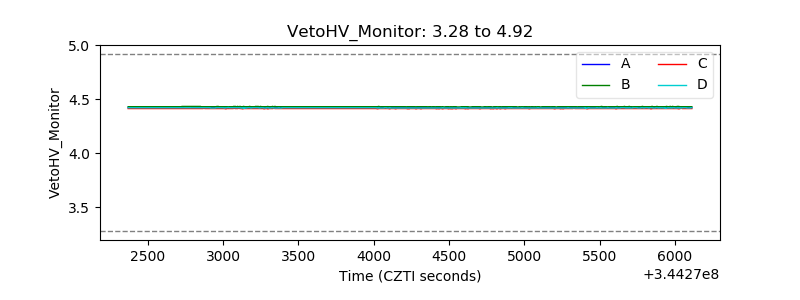 |
| Veto LLD | 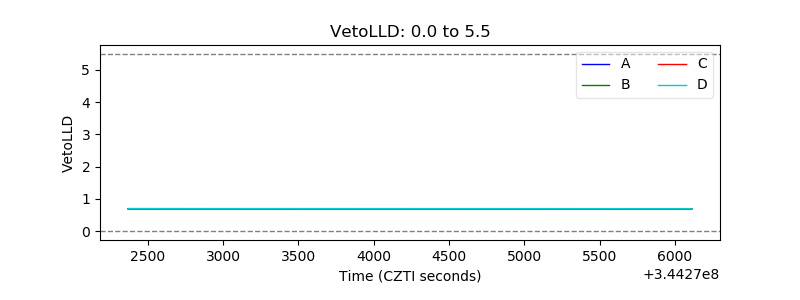 |
| Alpha Counter | 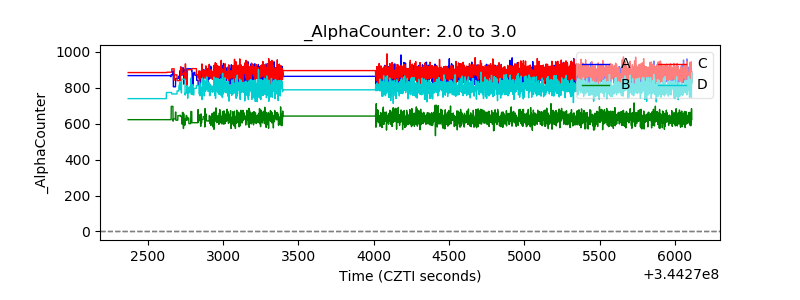 |
| _CPM_Rate | 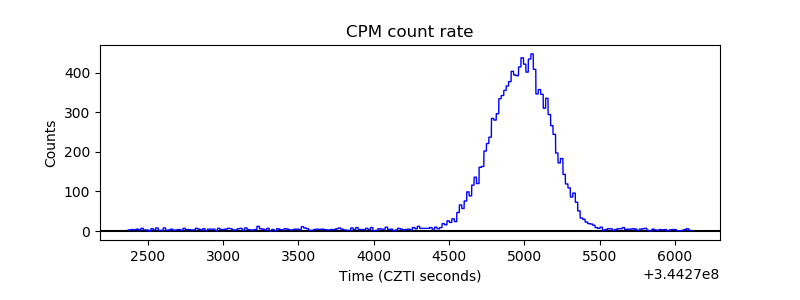 |
| CZT Counter | 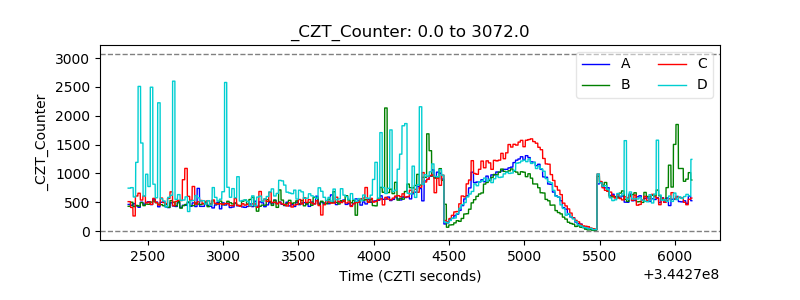 |
| +2.5 Volts monitor |  |
| +5 Volts monitor |  |
| _ROLL_ROT |  |
| _Roll_DEC | 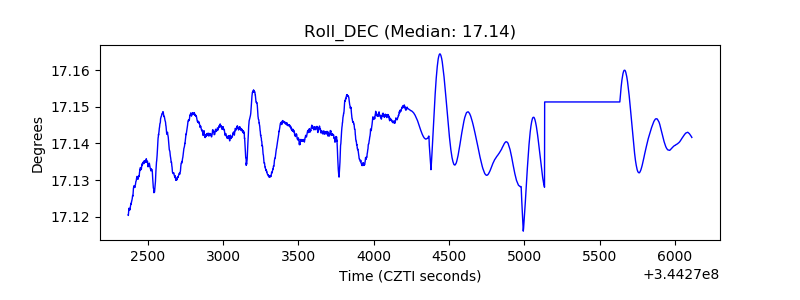 |
| _Roll_RA | 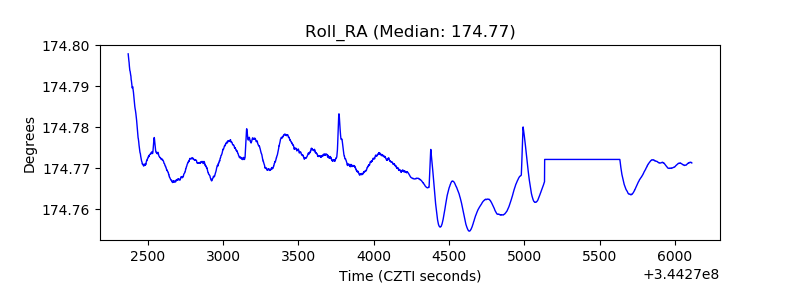 |
| Veto Counter | 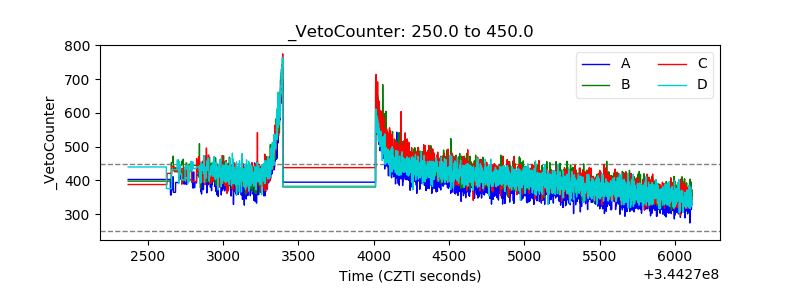 |