| Param | Original file | Final file |
|---|---|---|
| Filename | modeM0/AS1A10_021T03_9000004038_27968cztM0_level2.evt | modeM0/AS1A10_021T03_9000004038_27968cztM0_level2_quad_clean.evt |
| Size (bytes) | 226,532,160 | 16,430,400 |
| Size | 216.0 MB | 15.7 MB |
| Events in quadrant A | 1,306,551 | 82,158 |
| Events in quadrant B | 1,337,330 | 81,062 |
| Events in quadrant C | 1,324,375 | 78,534 |
| Events in quadrant D | 2,715,668 | 70,354 |
| Mode M0 | |||
|---|---|---|---|
| Quadrant | BADHDUFLAG | Total packets | Discarded packets |
| A | 0 | 5269 | 0 |
| B | 0 | 5415 | 0 |
| C | 0 | 5315 | 0 |
| D | 0 | 9999 | 0 |
| Quadrant | Total seconds | Saturated seconds | Saturation percentage |
|---|---|---|---|
| A | 2571 | 5 | 0.194477% |
| B | 2571 | 7 | 0.272268% |
| C | 2572 | 18 | 0.699844% |
| D | 2572 | 323 | 12.558320% |
Noise dominated data is calculated using 1-second bins in cleaned event files. If a bin has >2000 counts, and if more than 50% of those come from <1% of pixels, then it is considered to be noise-dominated and hence unusable.
| Quadrant | # 1 sec bins | Bins with >0 counts | Bins with >2000 counts | High rate bins dominated by noise | Noise dominated (total time) | Noise dominated (detector-on time) | Marked lightcurve |
|---|---|---|---|---|---|---|---|
| A | 2571 | 2571 | 0 | 0 | 0.00% | 0.00% | 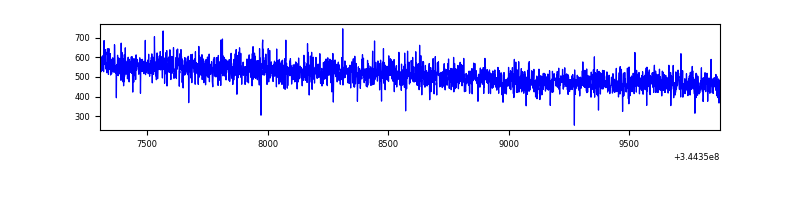 |
| B | 2571 | 2571 | 0 | 0 | 0.00% | 0.00% | 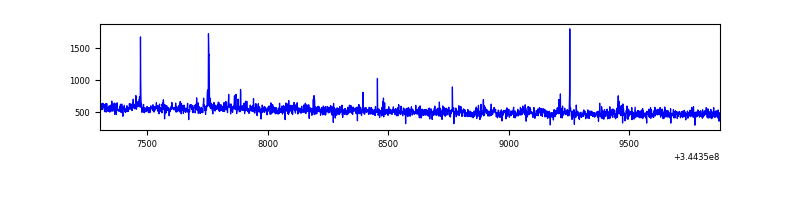 |
| C | 2572 | 2572 | 0 | 0 | 0.00% | 0.00% | 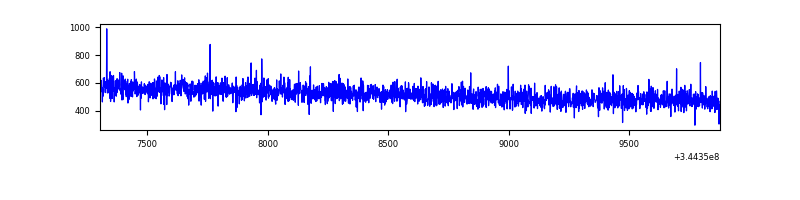 |
| D | 2572 | 2572 | 265 | 265 | 10.30% | 10.30% | 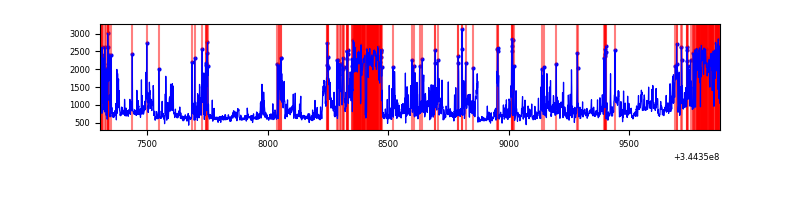 |
Top three noisy pixels from each quadrant. If the there are fewer than three noisy pixels in the level2.evt file, extra rows are filled as -1
| Pixel properties | Quadrant properties | ||||||
|---|---|---|---|---|---|---|---|
| Quadrant | DetID | PixID | Counts | Sigma | Mean | Median | Sigma |
| A | 13 | 254 | 4970 | 67.07 | 338 | 332 | 69.2 |
| A | 3 | 137 | 2941 | 37.73 | 338 | 332 | 69.2 |
| A | 0 | 226 | 2910 | 37.28 | 338 | 332 | 69.2 |
| B | 0 | 190 | 14037 | 213.31 | 332 | 324 | 64.3 |
| B | 4 | 52 | 9344 | 140.31 | 332 | 324 | 64.3 |
| B | 4 | 200 | 8658 | 129.64 | 332 | 324 | 64.3 |
| C | 14 | 238 | 52911 | 682.69 | 325 | 327 | 77.0 |
| C | 3 | 233 | 4180 | 50.02 | 325 | 327 | 77.0 |
| C | 13 | 61 | 2201 | 24.33 | 325 | 327 | 77.0 |
| D | 1 | 52 | 837733 | 11077.72 | 309 | 303 | 75.6 |
| D | 2 | 250 | 225517 | 2979.18 | 309 | 303 | 75.6 |
| D | 8 | 195 | 181043 | 2390.87 | 309 | 303 | 75.6 |
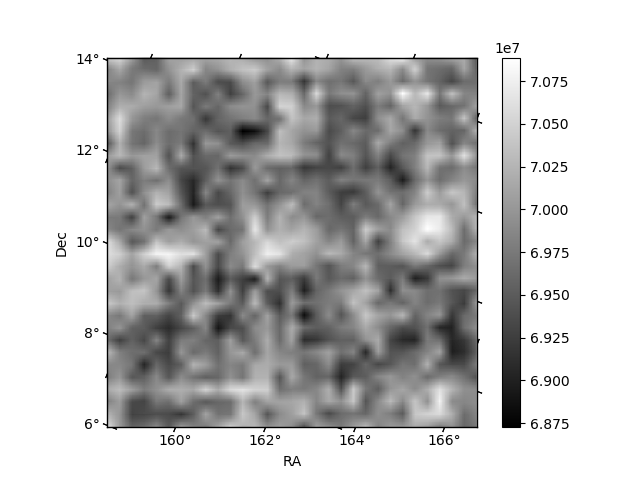
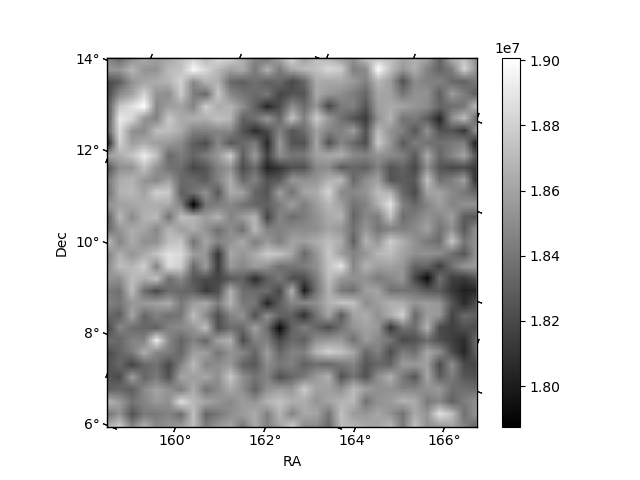
Histogram calculated using DETX and DETY for each event in the final _common_clean file
| Quadrant A | 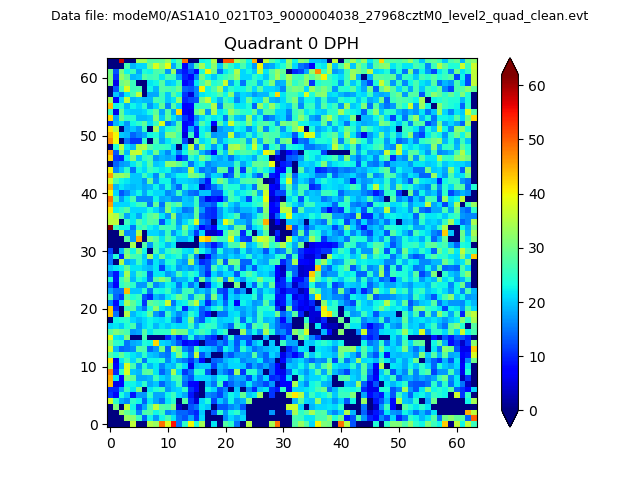 |
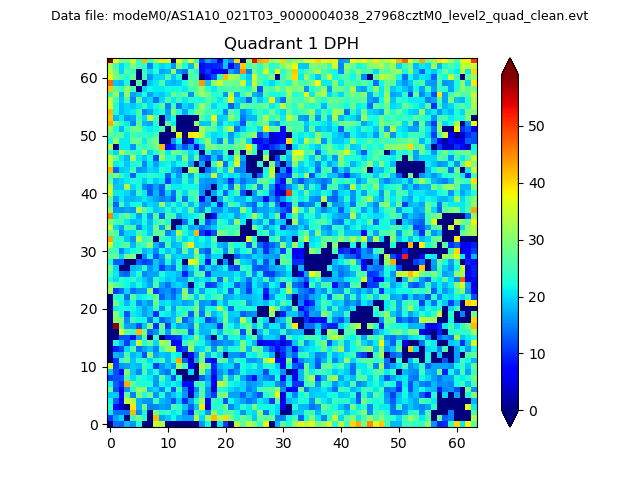 |
Quadrant B |
|---|---|---|---|
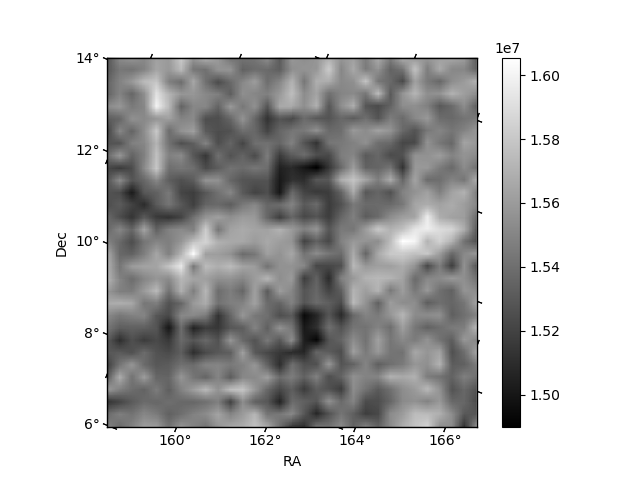
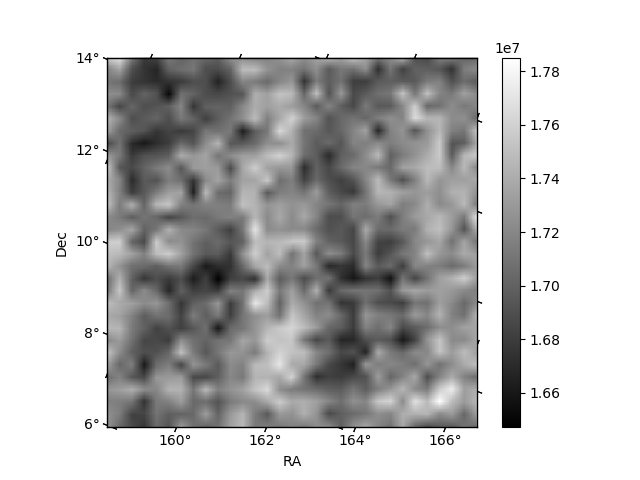
| Quadrant D |  |
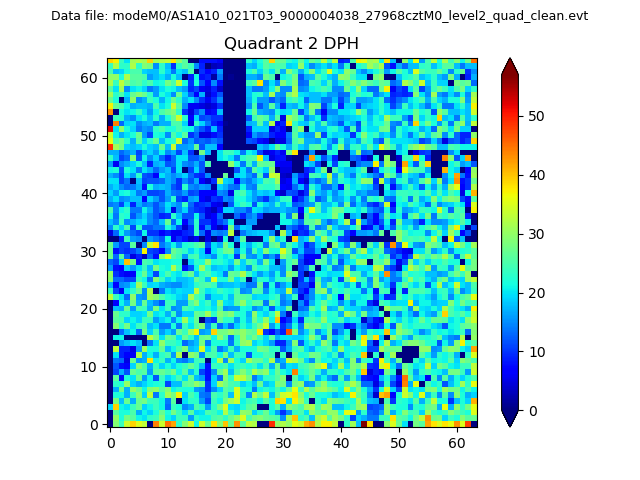 |
Quadrant C |
| Plot type | Count rate plots | Images |
|---|---|---|
| Comparison with Poisson distribution Blue bars denote a histogram of data divided into 1 sec bins. Red curve is a Poisson curve with rate = median count rate of data. |
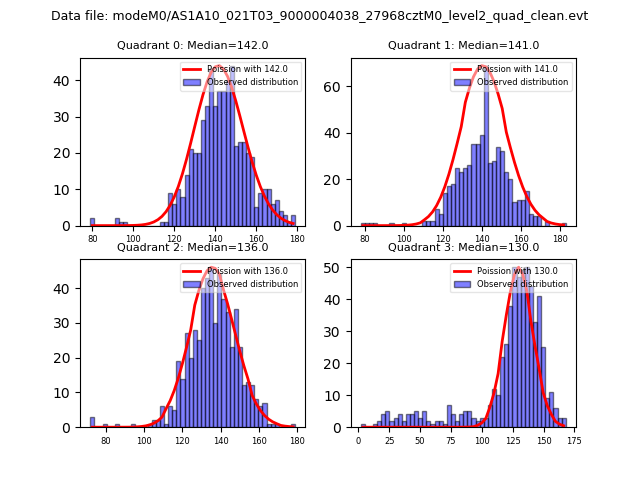 |
 |
| Quadrant-wise count rates Data is divided into 100 sec bins |
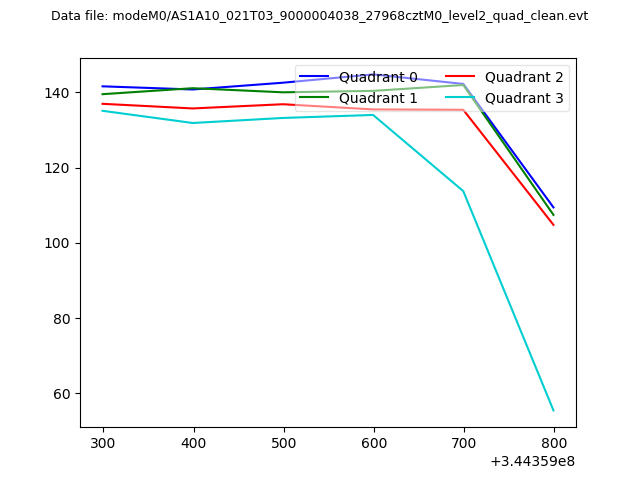 |
|
| Module-wise count rates for Quadrant A Data is divided into 100 sec bins |
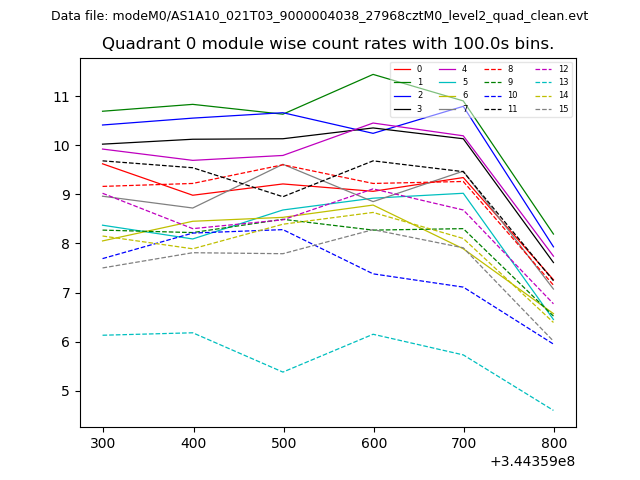 |
 |
| Module-wise count rates for Quadrant B Data is divided into 100 sec bins |
 |
 |
| Module-wise count rates for Quadrant C Data is divided into 100 sec bins |
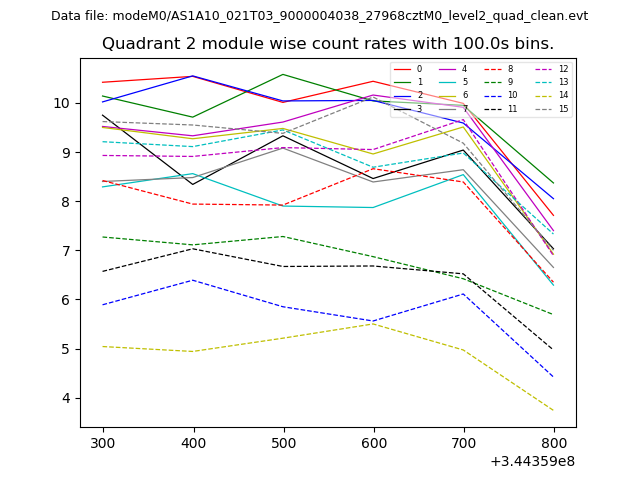 |
 |
| Module-wise count rates for Quadrant D Data is divided into 100 sec bins |
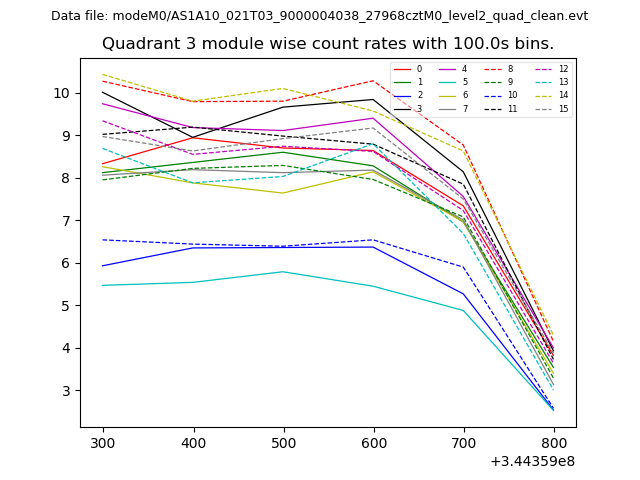 |
 |
| Parameter | Plot |
|---|---|
| CZT HV Monitor | 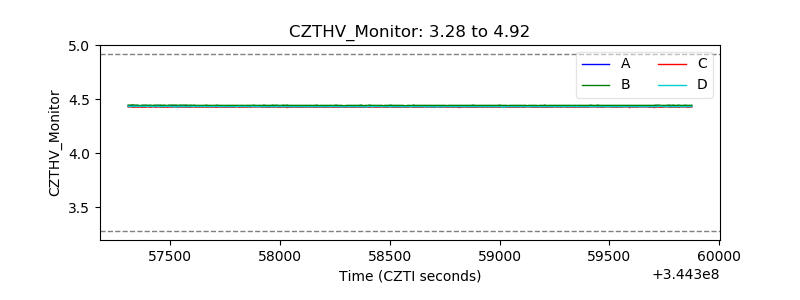 |
| D_VDD | 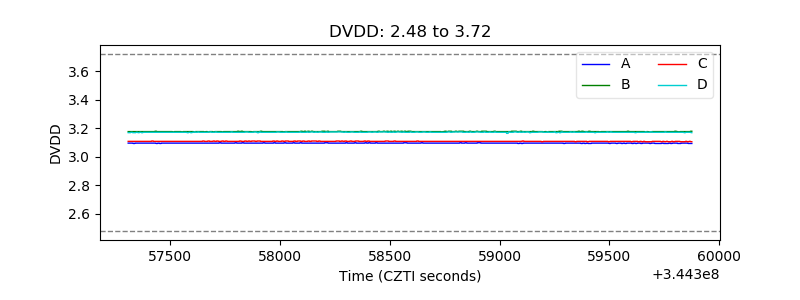 |
| Temperature 1 | 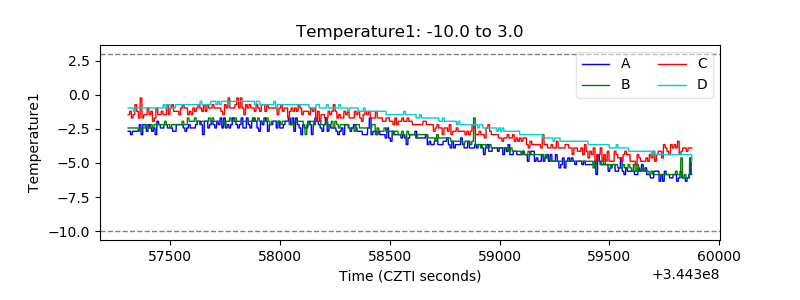 |
| Veto HV Monitor | 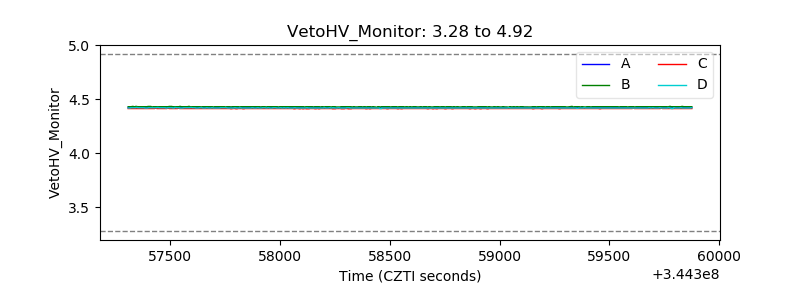 |
| Veto LLD | 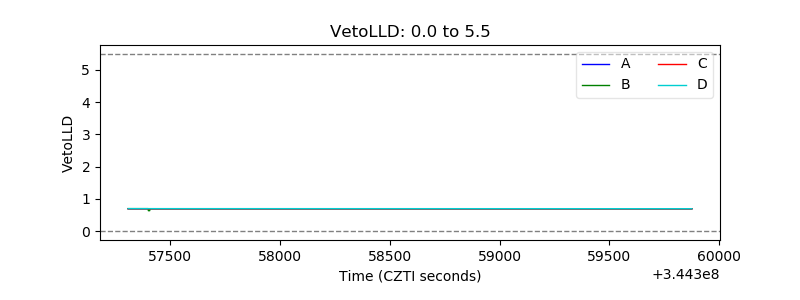 |
| Alpha Counter | 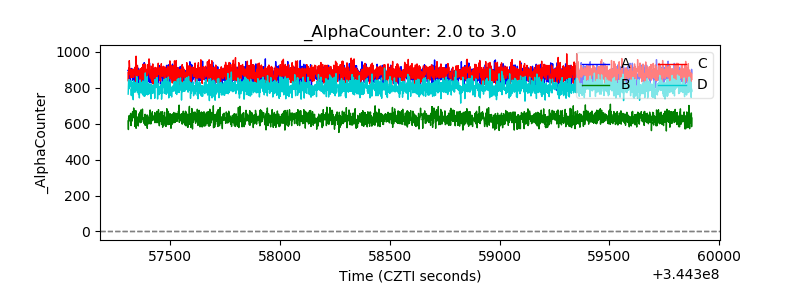 |
| _CPM_Rate | 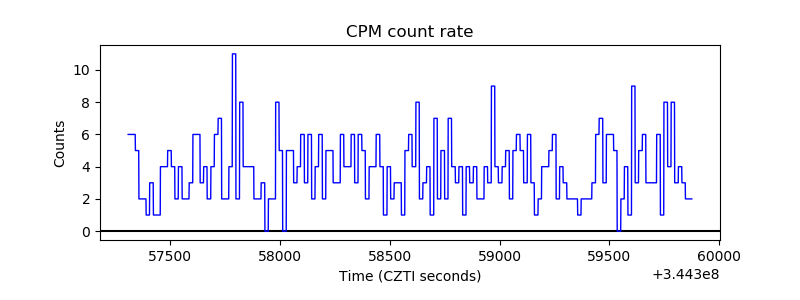 |
| CZT Counter | 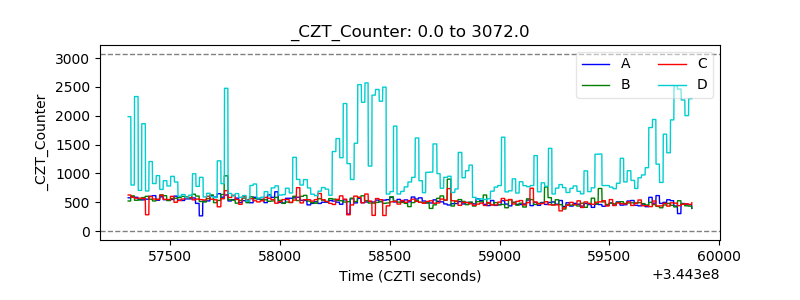 |
| +2.5 Volts monitor |  |
| +5 Volts monitor | 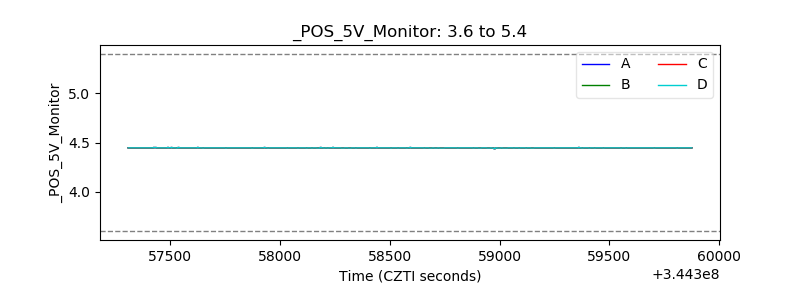 |
| _ROLL_ROT | 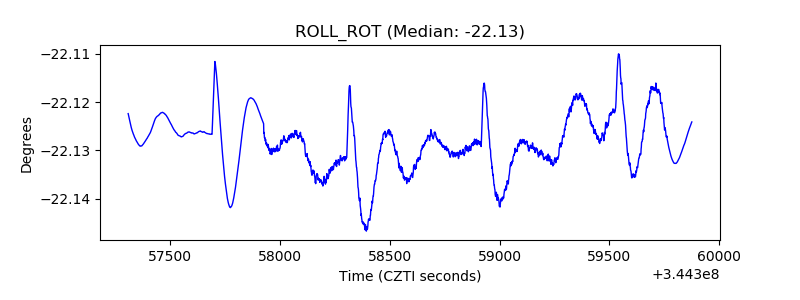 |
| _Roll_DEC | 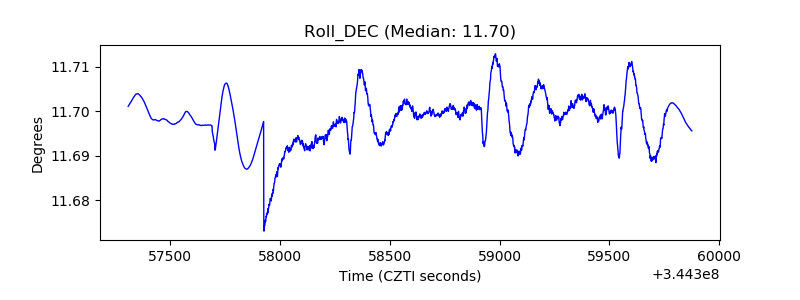 |
| _Roll_RA | 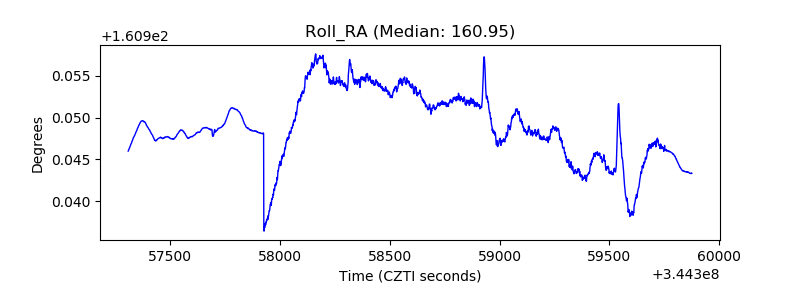 |
| Veto Counter | 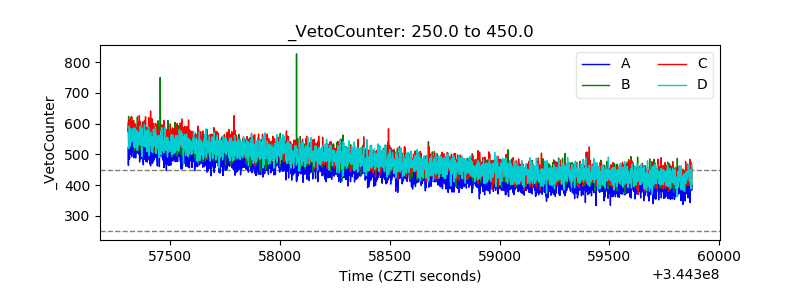 |