| Param | Original file | Final file |
|---|---|---|
| Filename | modeM0/AS1A10_110T03_9000004114_28670cztM0_level2.evt | modeM0/AS1A10_110T03_9000004114_28670cztM0_level2_quad_clean.evt |
| Size (bytes) | 548,231,040 | 98,988,480 |
| Size | 522.8 MB | 94.4 MB |
| Events in quadrant A | 3,465,583 | 636,325 |
| Events in quadrant B | 3,608,892 | 653,067 |
| Events in quadrant C | 3,673,551 | 611,679 |
| Events in quadrant D | 5,364,001 | 592,157 |
| Mode M9 | |||
|---|---|---|---|
| Quadrant | BADHDUFLAG | Total packets | Discarded packets |
| A | 0 | 19 | 0 |
| B | 0 | 19 | 0 |
| C | 0 | 19 | 0 |
| D | 0 | 19 | 0 |
| Mode M0 | |||
|---|---|---|---|
| Quadrant | BADHDUFLAG | Total packets | Discarded packets |
| A | 0 | 14876 | 2 |
| B | 0 | 15291 | 2 |
| C | 0 | 15376 | 2 |
| D | 0 | 20928 | 5 |
| Mode SS | |||
|---|---|---|---|
| Quadrant | BADHDUFLAG | Total packets | Discarded packets |
| A | 0 | 150 | 0 |
| B | 0 | 150 | 0 |
| C | 0 | 150 | 0 |
| D | 0 | 150 | 0 |
| Quadrant | Total seconds | Saturated seconds | Saturation percentage |
|---|---|---|---|
| A | 7240 | 51 | 0.704420% |
| B | 7241 | 74 | 1.021958% |
| C | 7241 | 206 | 2.844911% |
| D | 7240 | 261 | 3.604972% |
Noise dominated data is calculated using 1-second bins in cleaned event files. If a bin has >2000 counts, and if more than 50% of those come from <1% of pixels, then it is considered to be noise-dominated and hence unusable.
| Quadrant | # 1 sec bins | Bins with >0 counts | Bins with >2000 counts | High rate bins dominated by noise | Noise dominated (total time) | Noise dominated (detector-on time) | Marked lightcurve |
|---|---|---|---|---|---|---|---|
| A | 9180 | 7240 | 0 | 0 | 0.00% | 0.00% | 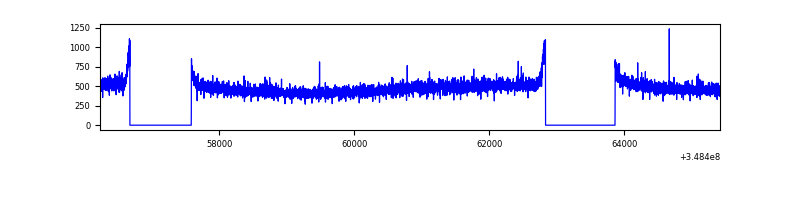 |
| B | 9181 | 7241 | 1 | 1 | 0.01% | 0.01% | 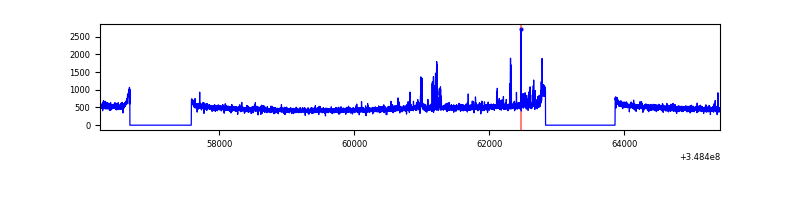 |
| C | 9181 | 7241 | 0 | 0 | 0.00% | 0.00% | 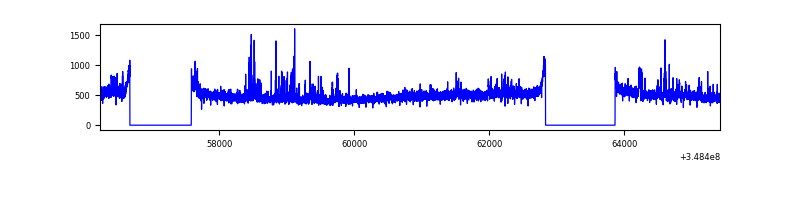 |
| D | 9179 | 7239 | 241 | 241 | 2.63% | 3.33% | 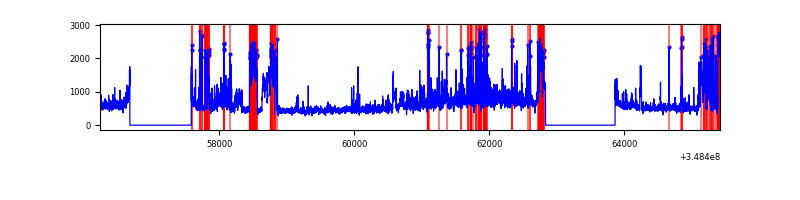 |
Top three noisy pixels from each quadrant. If the there are fewer than three noisy pixels in the level2.evt file, extra rows are filled as -1
| Pixel properties | Quadrant properties | ||||||
|---|---|---|---|---|---|---|---|
| Quadrant | DetID | PixID | Counts | Sigma | Mean | Median | Sigma |
| A | 13 | 254 | 12827 | 65.68 | 898 | 880 | 181.9 |
| A | 3 | 137 | 8838 | 43.75 | 898 | 880 | 181.9 |
| A | 0 | 226 | 7736 | 37.69 | 898 | 880 | 181.9 |
| B | 10 | 245 | 104830 | 606.21 | 893 | 872 | 171.5 |
| B | 12 | 111 | 21454 | 120.02 | 893 | 872 | 171.5 |
| B | 11 | 111 | 19253 | 107.18 | 893 | 872 | 171.5 |
| C | 14 | 238 | 185172 | 919.16 | 852 | 858 | 200.5 |
| C | 7 | 220 | 67869 | 334.18 | 852 | 858 | 200.5 |
| C | 14 | 254 | 66330 | 326.5 | 852 | 858 | 200.5 |
| D | 1 | 52 | 1708313 | 8345.03 | 853 | 832 | 204.6 |
| D | 8 | 195 | 354440 | 1728.2 | 853 | 832 | 204.6 |
| D | 2 | 234 | 27251 | 129.12 | 853 | 832 | 204.6 |
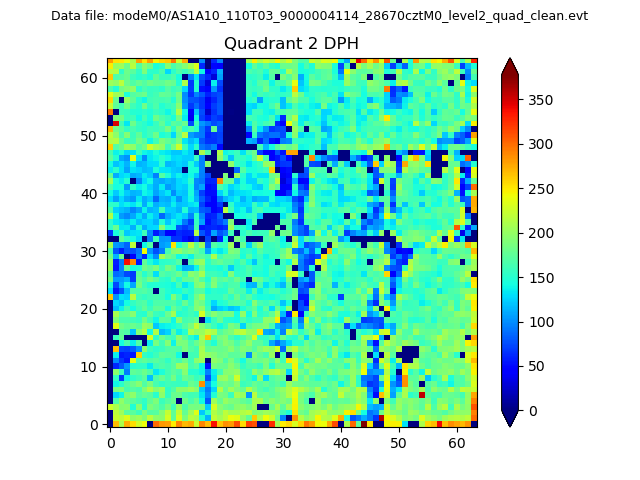
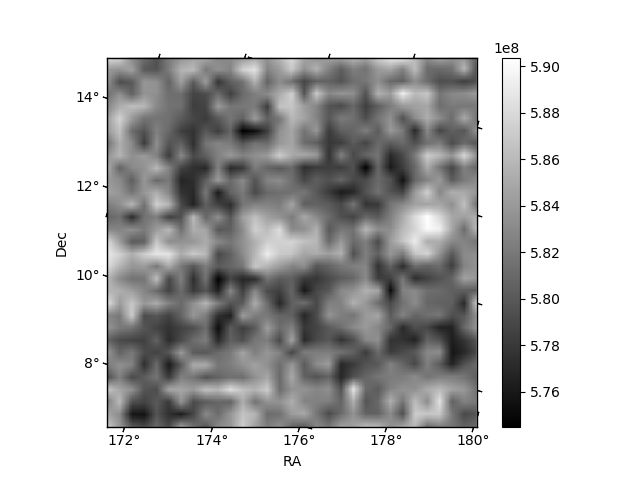
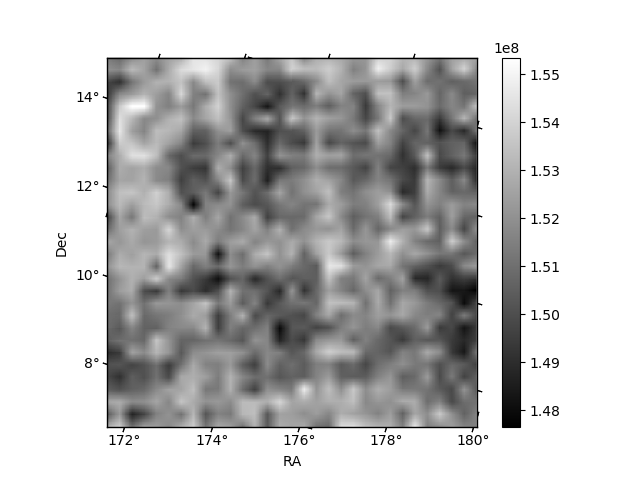
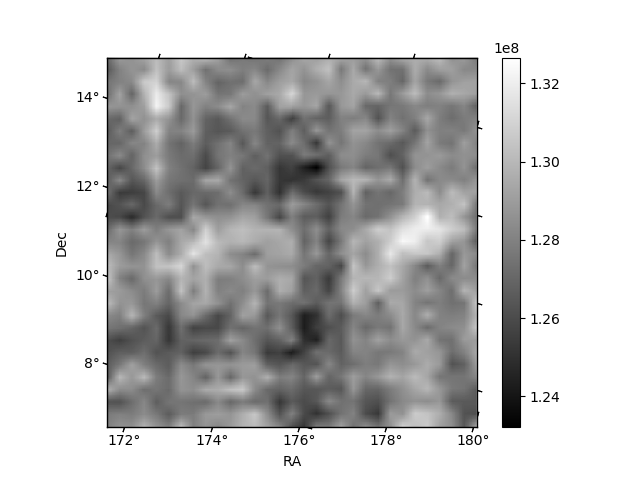
Histogram calculated using DETX and DETY for each event in the final _common_clean file
| Quadrant A | 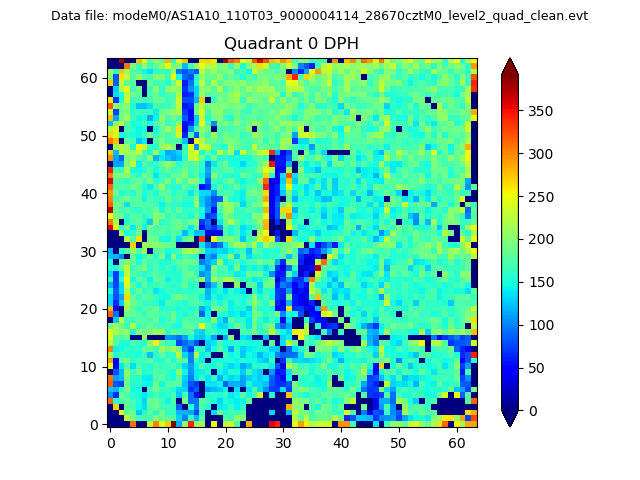 |
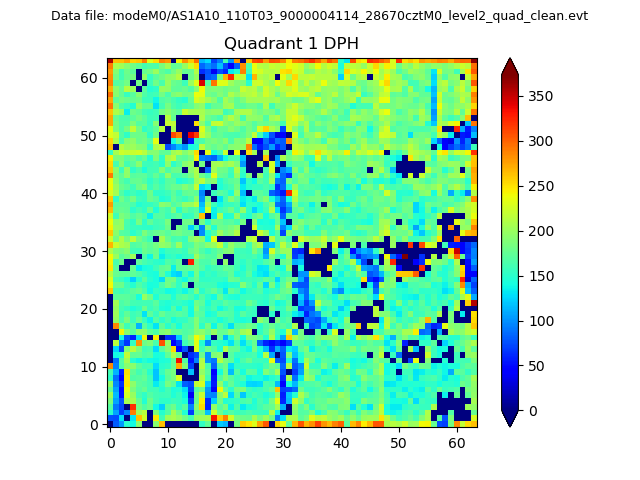 |
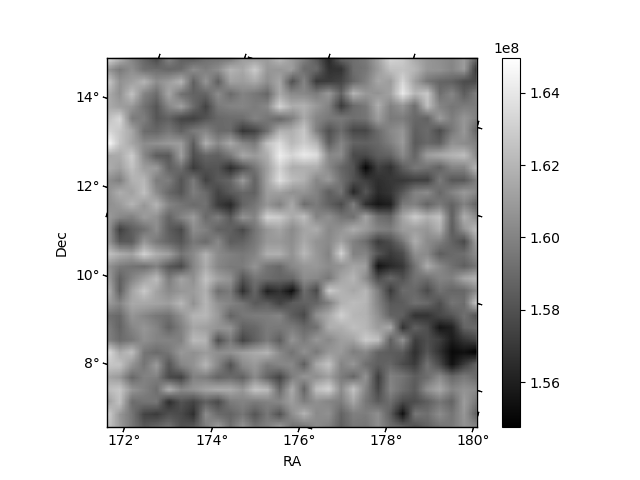
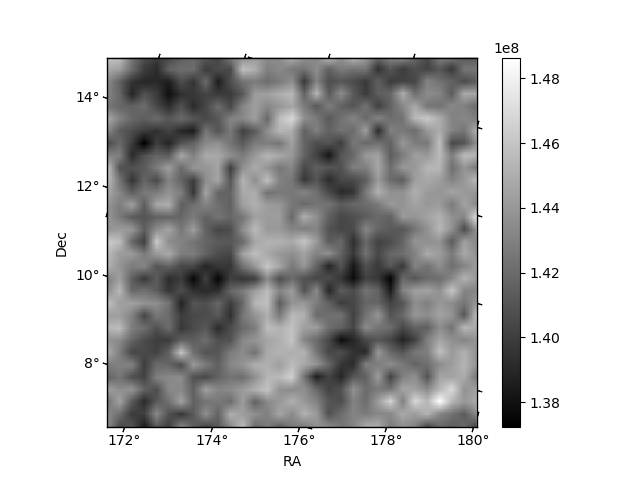
Quadrant B |
|---|---|---|---|
| Quadrant D | 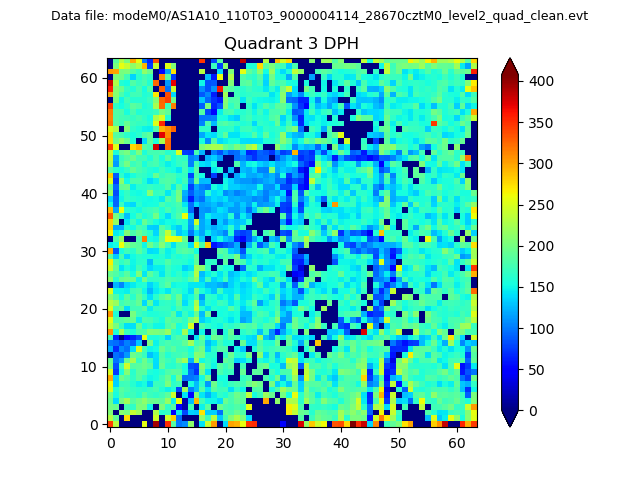 |
 |
Quadrant C |
| Plot type | Count rate plots | Images |
|---|---|---|
| Comparison with Poisson distribution Blue bars denote a histogram of data divided into 1 sec bins. Red curve is a Poisson curve with rate = median count rate of data. |
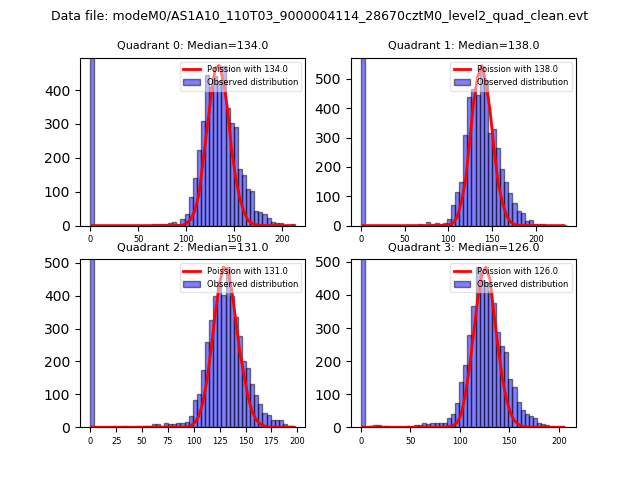 |
 |
| Quadrant-wise count rates Data is divided into 100 sec bins |
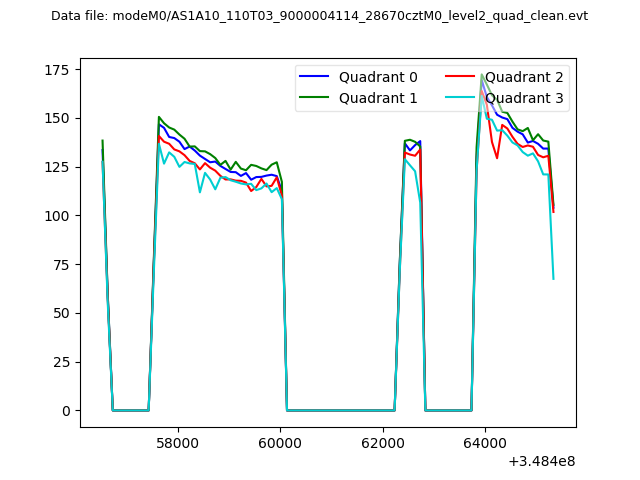 |
|
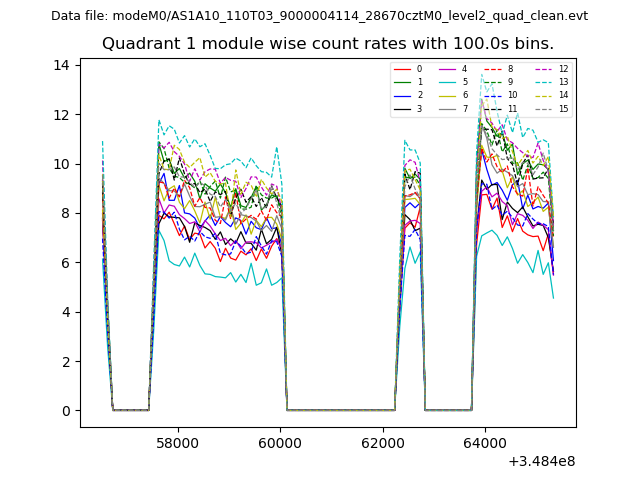
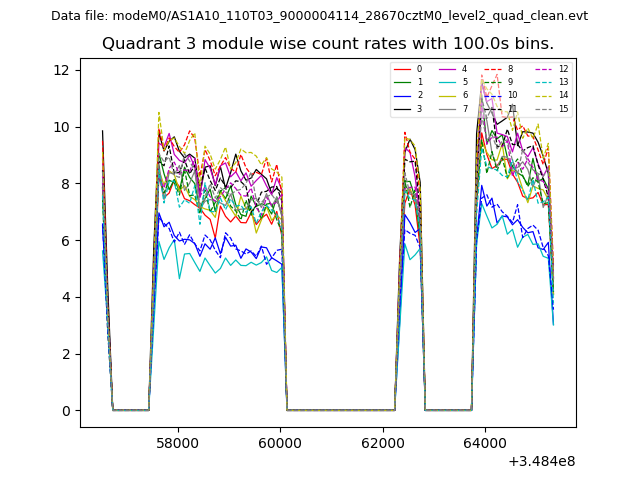
| Module-wise count rates for Quadrant A Data is divided into 100 sec bins |
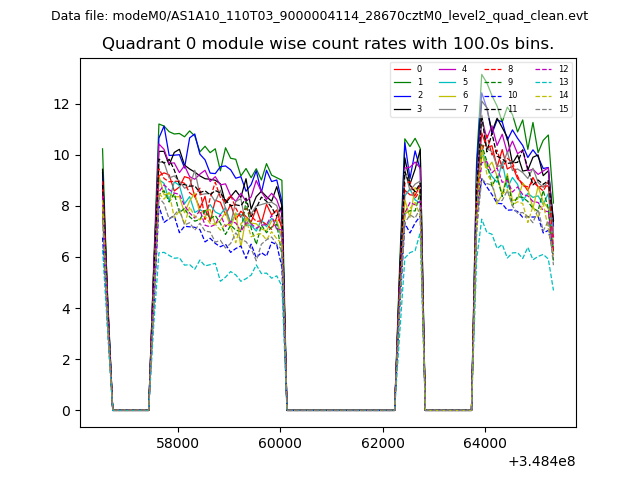 |
 |
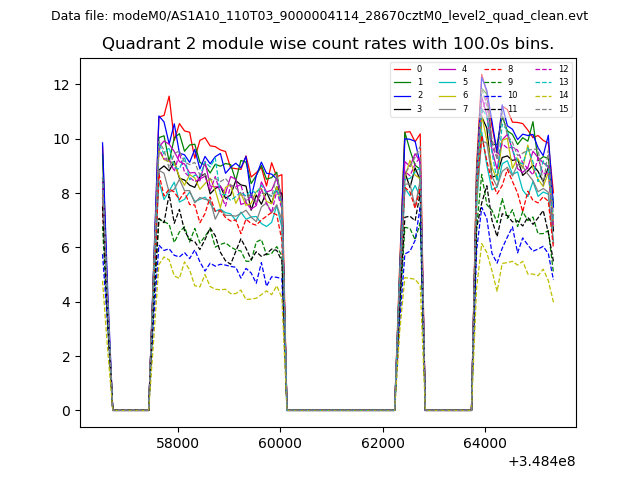
| Module-wise count rates for Quadrant B Data is divided into 100 sec bins |
 |
 |
| Module-wise count rates for Quadrant C Data is divided into 100 sec bins |
 |
 |
| Module-wise count rates for Quadrant D Data is divided into 100 sec bins |
 |
 |
| Parameter | Plot |
|---|---|
| CZT HV Monitor | 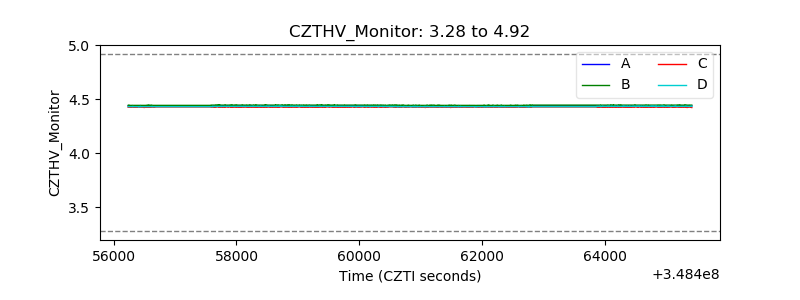 |
| D_VDD | 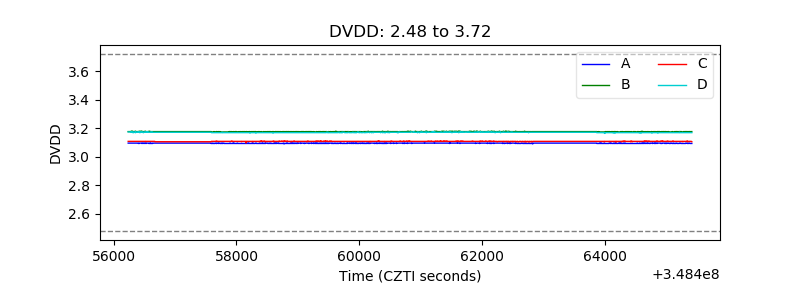 |
| Temperature 1 |  |
| Veto HV Monitor | 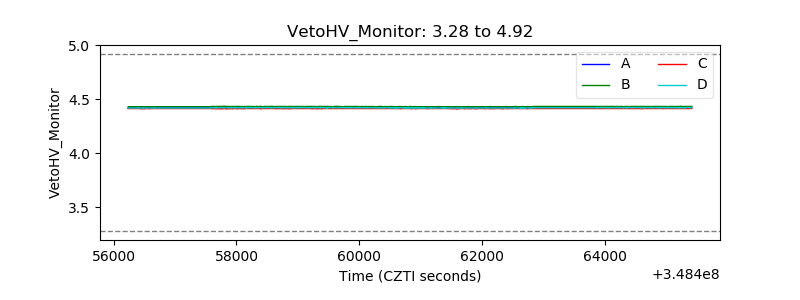 |
| Veto LLD | 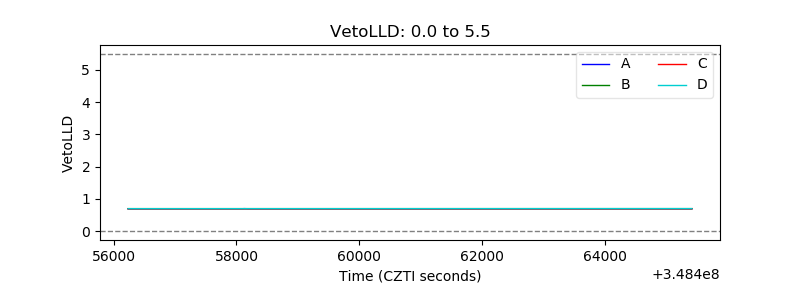 |
| Alpha Counter | 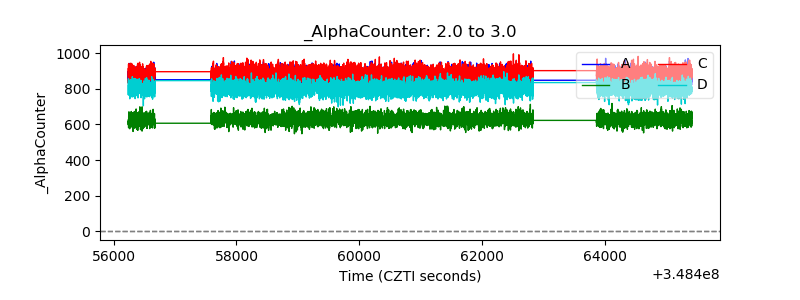 |
| _CPM_Rate | 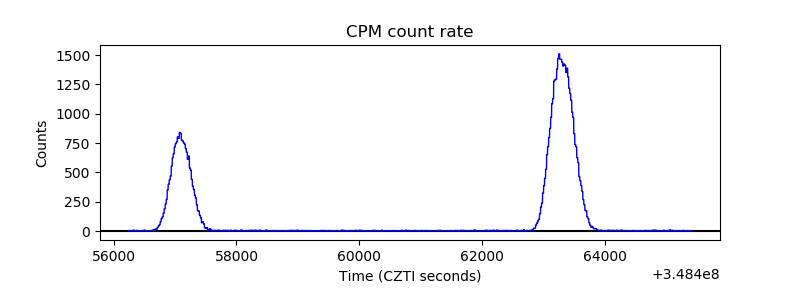 |
| CZT Counter | 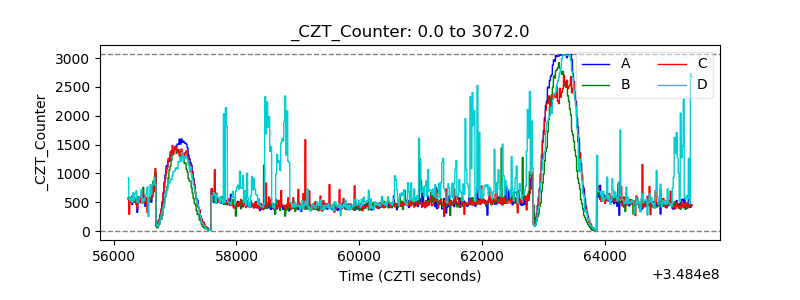 |
| +2.5 Volts monitor |  |
| +5 Volts monitor |  |
| _ROLL_ROT | 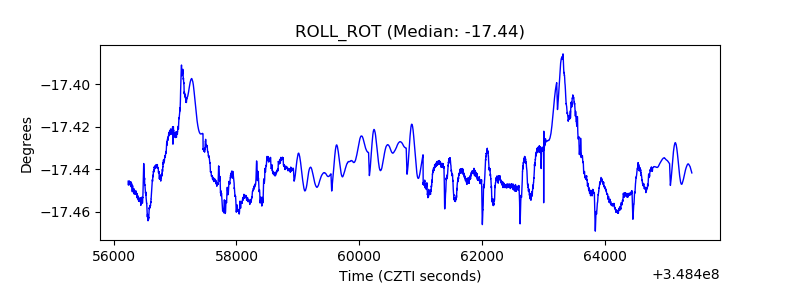 |
| _Roll_DEC | 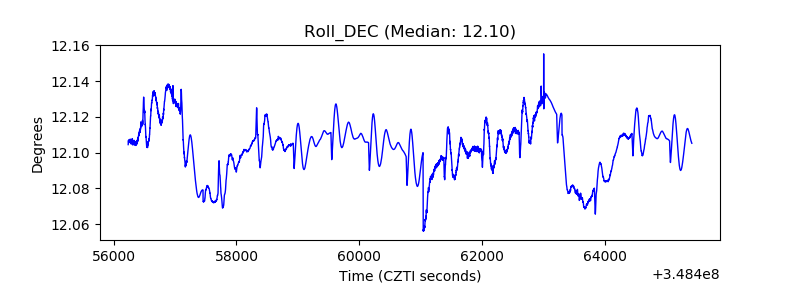 |
| _Roll_RA | 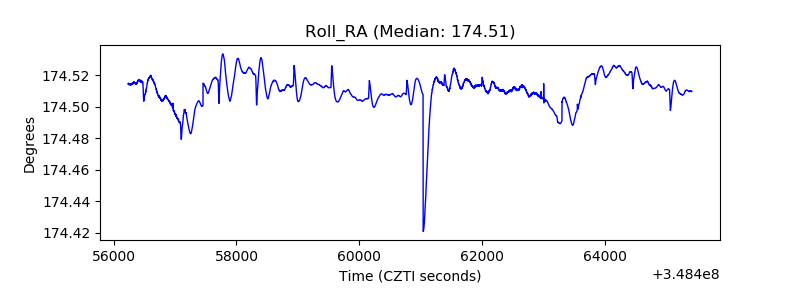 |
| Veto Counter | 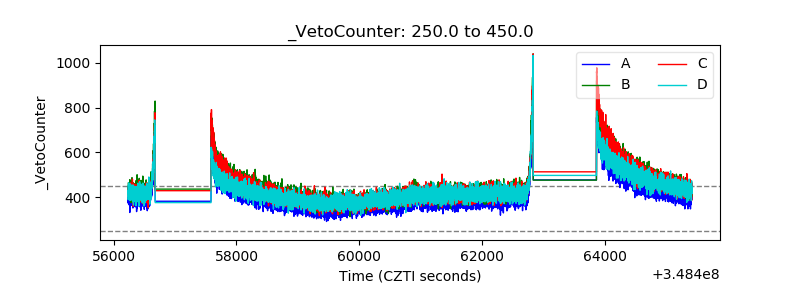 |