| Param | Original file | Final file |
|---|---|---|
| Filename | modeM0/AS1A10_123T06_9000004122_28719cztM0_level2.evt | modeM0/AS1A10_123T06_9000004122_28719cztM0_level2_quad_clean.evt |
| Size (bytes) | 191,448,000 | 39,407,040 |
| Size | 182.6 MB | 37.6 MB |
| Events in quadrant A | 1,232,840 | 264,409 |
| Events in quadrant B | 1,227,490 | 268,152 |
| Events in quadrant C | 1,272,193 | 256,351 |
| Events in quadrant D | 1,915,492 | 246,575 |
| Mode M9 | |||
|---|---|---|---|
| Quadrant | BADHDUFLAG | Total packets | Discarded packets |
| A | 0 | 13 | 0 |
| B | 0 | 13 | 0 |
| C | 0 | 13 | 0 |
| D | 0 | 13 | 0 |
| Mode M0 | |||
|---|---|---|---|
| Quadrant | BADHDUFLAG | Total packets | Discarded packets |
| A | 0 | 4950 | 1 |
| B | 0 | 4904 | 1 |
| C | 0 | 5076 | 1 |
| D | 0 | 7251 | 1 |
| Mode SS | |||
|---|---|---|---|
| Quadrant | BADHDUFLAG | Total packets | Discarded packets |
| A | 0 | 44 | 0 |
| B | 0 | 44 | 0 |
| C | 0 | 44 | 0 |
| D | 0 | 44 | 0 |
| Quadrant | Total seconds | Saturated seconds | Saturation percentage |
|---|---|---|---|
| A | 2183 | 117 | 5.359597% |
| B | 2183 | 128 | 5.863491% |
| C | 2183 | 128 | 5.863491% |
| D | 2183 | 179 | 8.199725% |
Noise dominated data is calculated using 1-second bins in cleaned event files. If a bin has >2000 counts, and if more than 50% of those come from <1% of pixels, then it is considered to be noise-dominated and hence unusable.
| Quadrant | # 1 sec bins | Bins with >0 counts | Bins with >2000 counts | High rate bins dominated by noise | Noise dominated (total time) | Noise dominated (detector-on time) | Marked lightcurve |
|---|---|---|---|---|---|---|---|
| A | 3458 | 2183 | 0 | 0 | 0.00% | 0.00% | 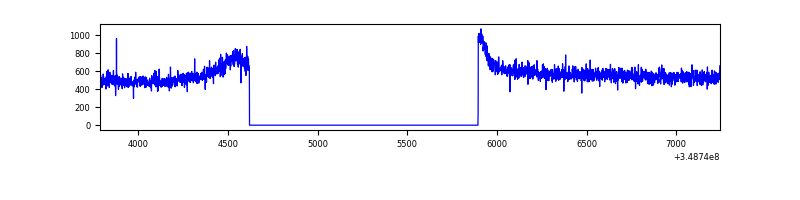 |
| B | 3458 | 2183 | 0 | 0 | 0.00% | 0.00% | 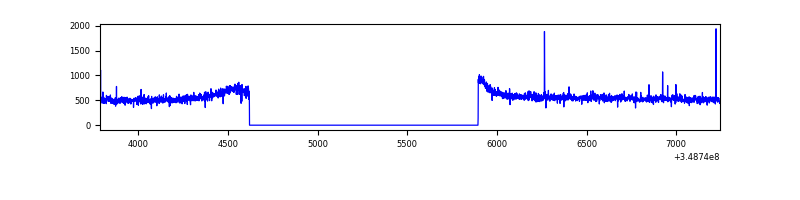 |
| C | 3458 | 2183 | 0 | 0 | 0.00% | 0.00% |  |
| D | 3458 | 2183 | 96 | 96 | 2.78% | 4.40% | 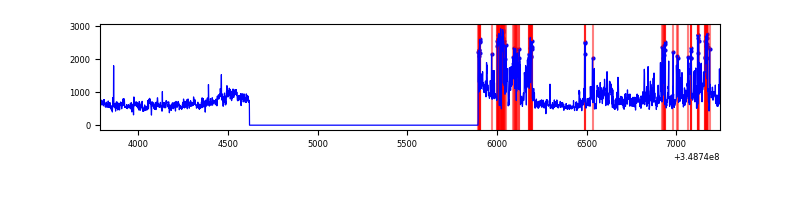 |
Top three noisy pixels from each quadrant. If the there are fewer than three noisy pixels in the level2.evt file, extra rows are filled as -1
| Pixel properties | Quadrant properties | ||||||
|---|---|---|---|---|---|---|---|
| Quadrant | DetID | PixID | Counts | Sigma | Mean | Median | Sigma |
| A | 13 | 254 | 3595 | 50.9 | 318 | 313 | 64.5 |
| A | 15 | 174 | 3235 | 45.32 | 318 | 313 | 64.5 |
| A | 3 | 137 | 2972 | 41.24 | 318 | 313 | 64.5 |
| B | 12 | 111 | 7149 | 114.04 | 311 | 303 | 60.0 |
| B | 11 | 111 | 6472 | 102.76 | 311 | 303 | 60.0 |
| B | 14 | 111 | 6185 | 97.98 | 311 | 303 | 60.0 |
| C | 3 | 233 | 50292 | 717.95 | 300 | 300 | 69.6 |
| C | 14 | 238 | 49794 | 710.8 | 300 | 300 | 69.6 |
| C | 13 | 61 | 1976 | 24.07 | 300 | 300 | 69.6 |
| D | 1 | 52 | 614015 | 8509.73 | 301 | 294 | 72.1 |
| D | 8 | 195 | 128523 | 1778.0 | 301 | 294 | 72.1 |
| D | 12 | 233 | 29347 | 402.84 | 301 | 294 | 72.1 |
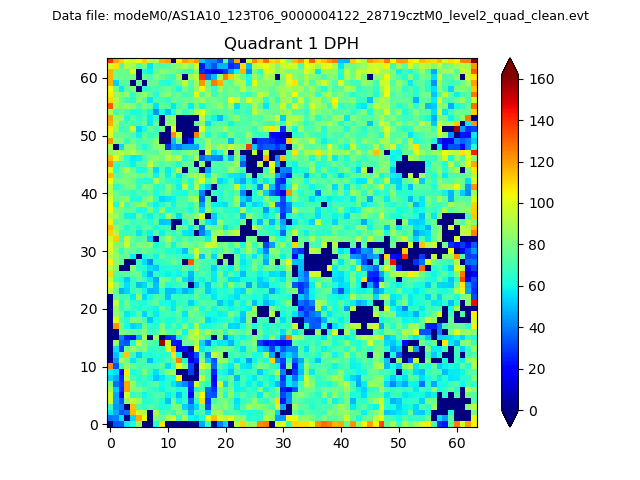
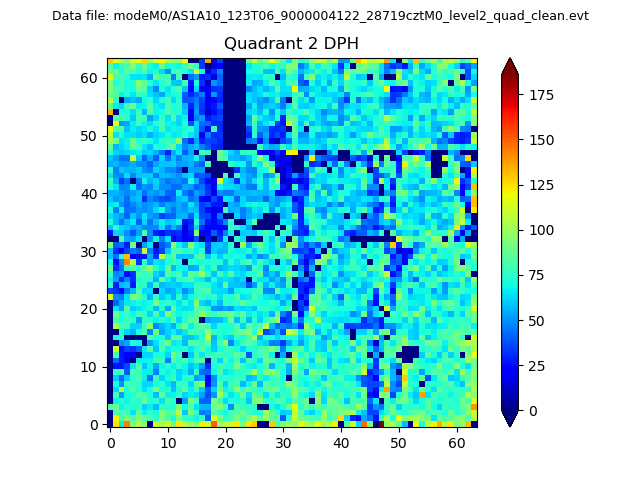
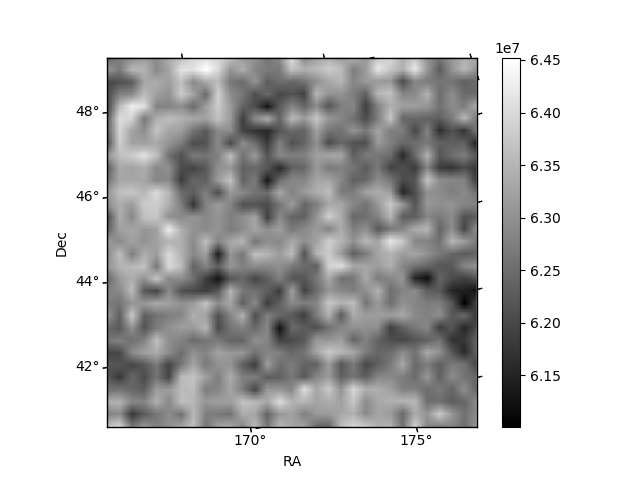
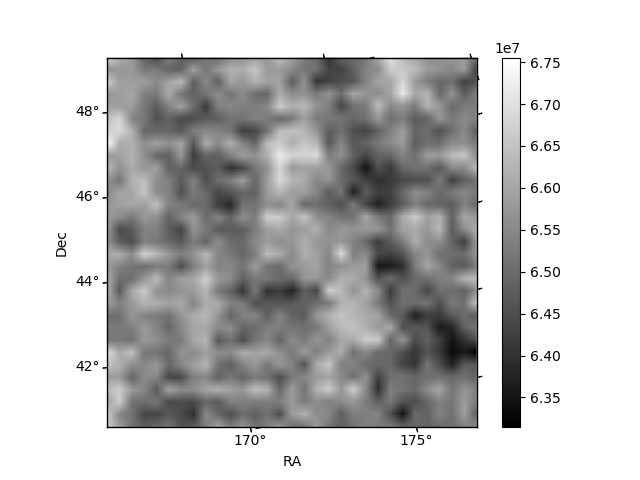
Histogram calculated using DETX and DETY for each event in the final _common_clean file
| Quadrant A |  |
 |
Quadrant B |
|---|---|---|---|
| Quadrant D | 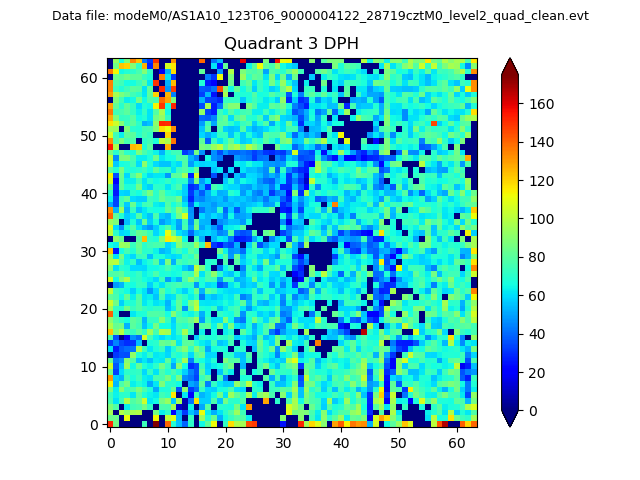 |
 |
Quadrant C |
| Plot type | Count rate plots | Images |
|---|---|---|
| Comparison with Poisson distribution Blue bars denote a histogram of data divided into 1 sec bins. Red curve is a Poisson curve with rate = median count rate of data. |
 |
 |
| Quadrant-wise count rates Data is divided into 100 sec bins |
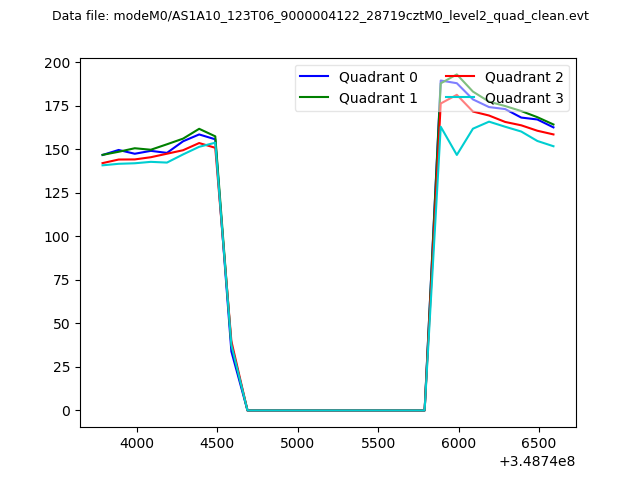 |
|
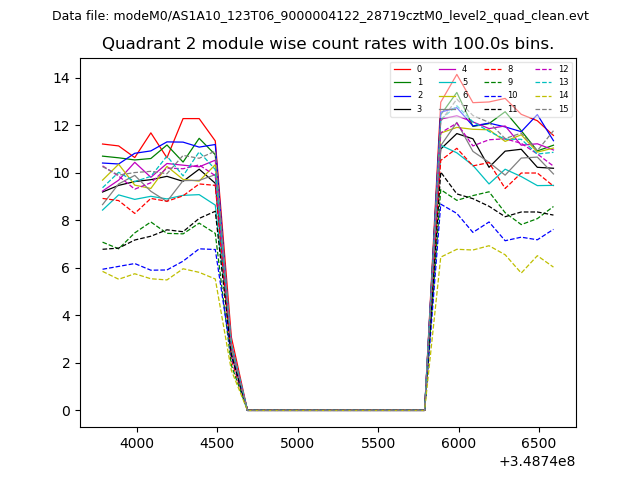
| Module-wise count rates for Quadrant A Data is divided into 100 sec bins |
 |
 |
| Module-wise count rates for Quadrant B Data is divided into 100 sec bins |
 |
 |
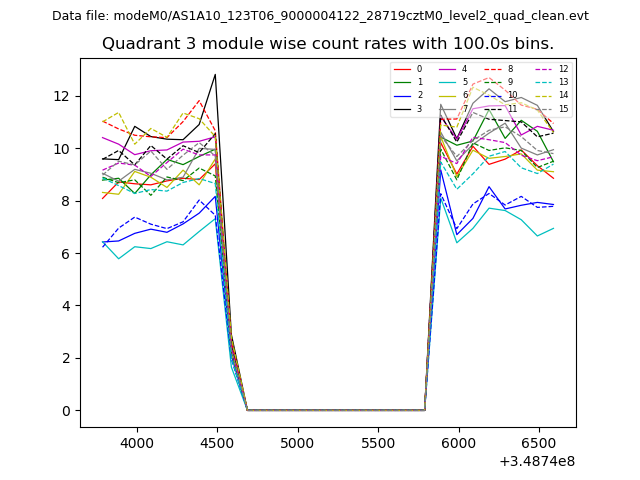
| Module-wise count rates for Quadrant C Data is divided into 100 sec bins |
 |
 |
| Module-wise count rates for Quadrant D Data is divided into 100 sec bins |
 |
 |
| Parameter | Plot |
|---|---|
| CZT HV Monitor | 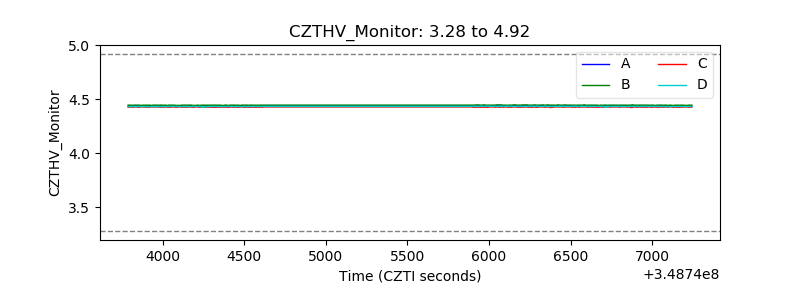 |
| D_VDD | 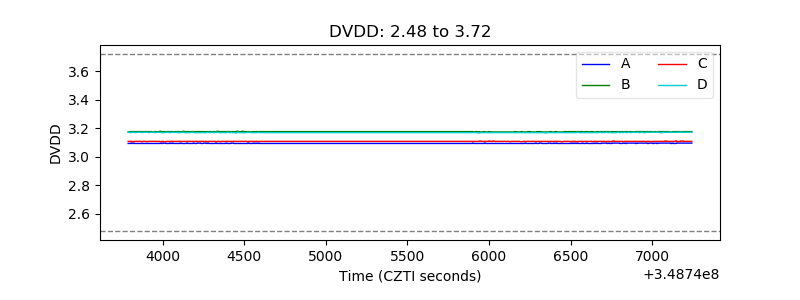 |
| Temperature 1 |  |
| Veto HV Monitor | 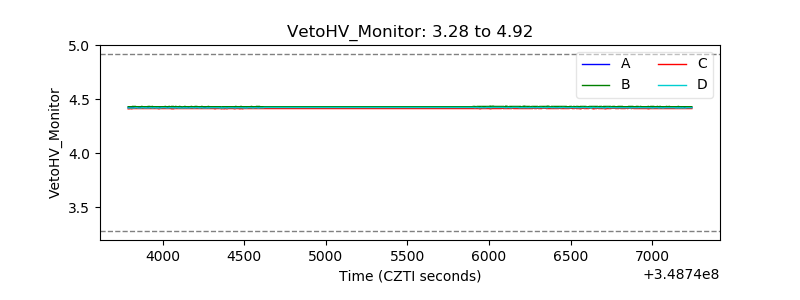 |
| Veto LLD |  |
| Alpha Counter | 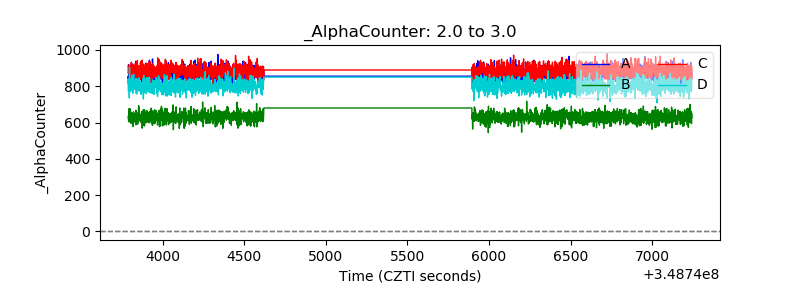 |
| _CPM_Rate | 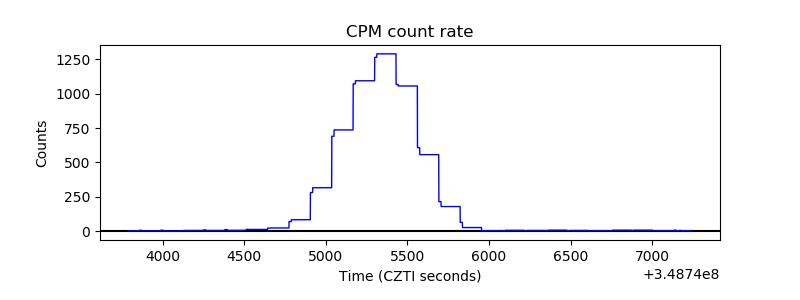 |
| CZT Counter | 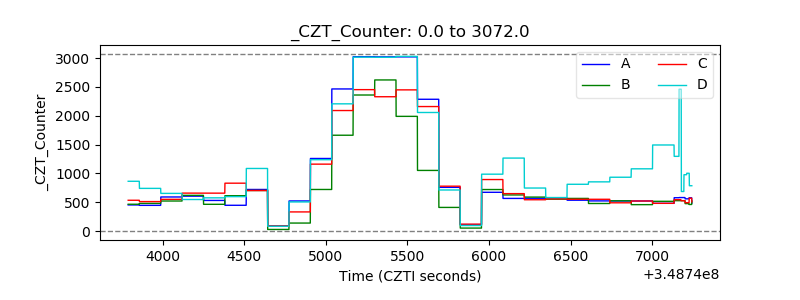 |
| +2.5 Volts monitor |  |
| +5 Volts monitor | 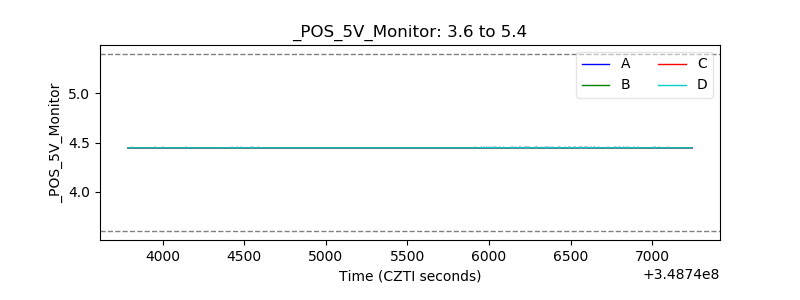 |
| _ROLL_ROT |  |
| _Roll_DEC | 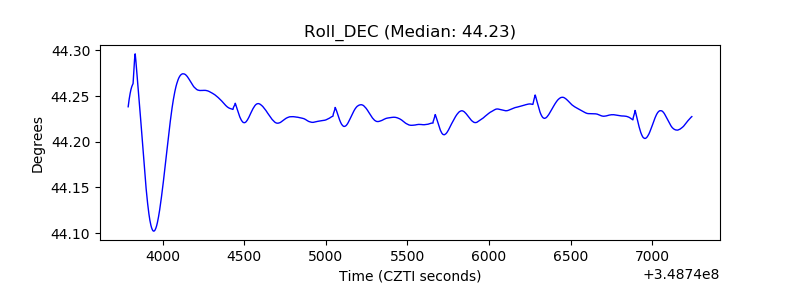 |
| _Roll_RA | 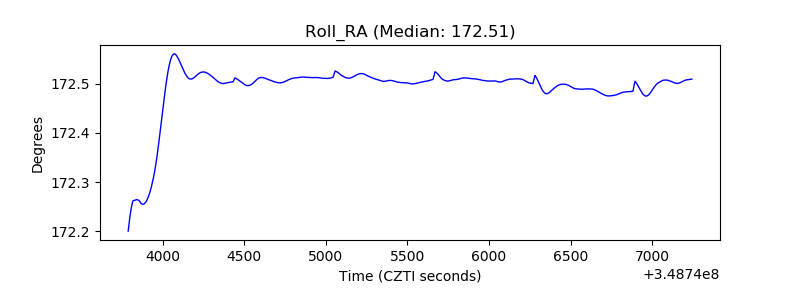 |
| Veto Counter | 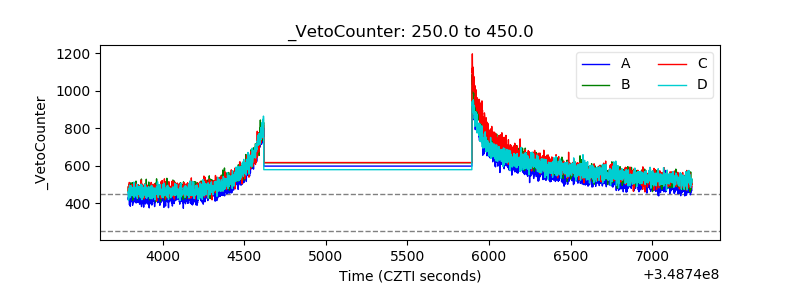 |