| Param | Original file | Final file |
|---|---|---|
| Filename | modeM0/AS1C05_019T04_9000004130_28773cztM0_level2.evt | modeM0/AS1C05_019T04_9000004130_28773cztM0_level2_quad_clean.evt |
| Size (bytes) | 479,134,080 | 127,535,040 |
| Size | 456.9 MB | 121.6 MB |
| Events in quadrant A | 3,096,209 | 861,876 |
| Events in quadrant B | 3,211,170 | 884,993 |
| Events in quadrant C | 3,483,739 | 842,969 |
| Events in quadrant D | 4,268,477 | 809,829 |
| Mode SS | |||
|---|---|---|---|
| Quadrant | BADHDUFLAG | Total packets | Discarded packets |
| A | 0 | 134 | 0 |
| B | 0 | 134 | 0 |
| C | 0 | 134 | 0 |
| D | 0 | 134 | 0 |
| Mode M9 | |||
|---|---|---|---|
| Quadrant | BADHDUFLAG | Total packets | Discarded packets |
| A | 0 | 17 | 0 |
| B | 0 | 18 | 0 |
| C | 0 | 18 | 0 |
| D | 0 | 18 | 0 |
| Mode M0 | |||
|---|---|---|---|
| Quadrant | BADHDUFLAG | Total packets | Discarded packets |
| A | 0 | 13659 | 2 |
| B | 0 | 13931 | 2 |
| C | 0 | 14810 | 2 |
| D | 0 | 17402 | 2 |
| Quadrant | Total seconds | Saturated seconds | Saturation percentage |
|---|---|---|---|
| A | 6645 | 8 | 0.120391% |
| B | 6645 | 17 | 0.255831% |
| C | 6645 | 83 | 1.249059% |
| D | 6645 | 153 | 2.302483% |
Noise dominated data is calculated using 1-second bins in cleaned event files. If a bin has >2000 counts, and if more than 50% of those come from <1% of pixels, then it is considered to be noise-dominated and hence unusable.
| Quadrant | # 1 sec bins | Bins with >0 counts | Bins with >2000 counts | High rate bins dominated by noise | Noise dominated (total time) | Noise dominated (detector-on time) | Marked lightcurve |
|---|---|---|---|---|---|---|---|
| A | 7785 | 6646 | 0 | 0 | 0.00% | 0.00% | 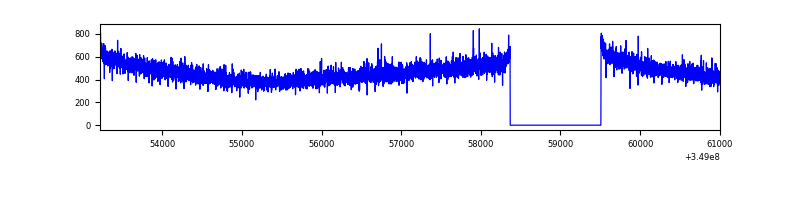 |
| B | 7785 | 6646 | 0 | 0 | 0.00% | 0.00% | 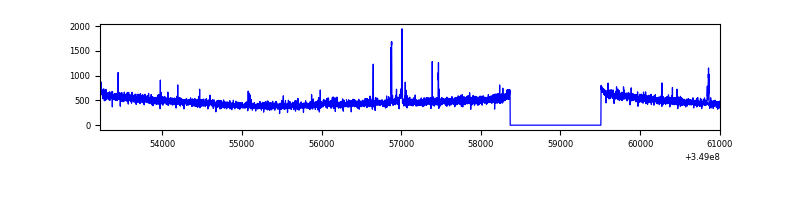 |
| C | 7785 | 6645 | 0 | 0 | 0.00% | 0.00% | 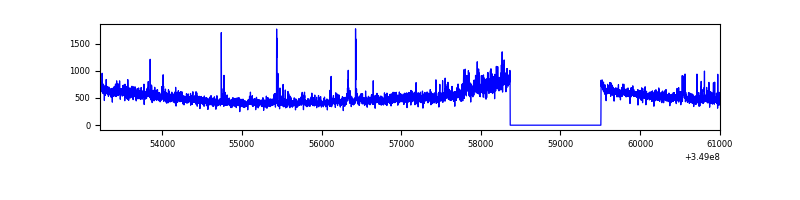 |
| D | 7785 | 6646 | 127 | 127 | 1.63% | 1.91% | 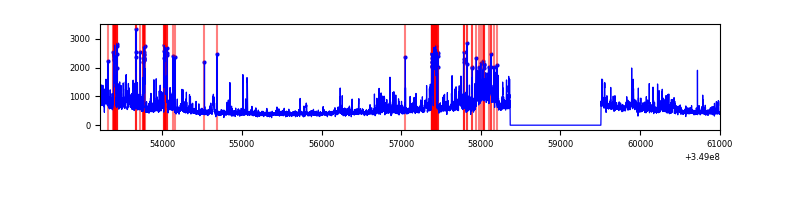 |
Top three noisy pixels from each quadrant. If the there are fewer than three noisy pixels in the level2.evt file, extra rows are filled as -1
| Pixel properties | Quadrant properties | ||||||
|---|---|---|---|---|---|---|---|
| Quadrant | DetID | PixID | Counts | Sigma | Mean | Median | Sigma |
| A | 13 | 254 | 11633 | 67.72 | 799 | 783 | 160.2 |
| A | 3 | 137 | 7633 | 42.75 | 799 | 783 | 160.2 |
| A | 0 | 226 | 6844 | 37.83 | 799 | 783 | 160.2 |
| B | 10 | 245 | 64462 | 422.09 | 800 | 781 | 150.9 |
| B | 12 | 111 | 18560 | 117.84 | 800 | 781 | 150.9 |
| B | 11 | 111 | 16568 | 104.64 | 800 | 781 | 150.9 |
| C | 3 | 233 | 283703 | 1571.68 | 775 | 780 | 180.0 |
| C | 14 | 238 | 133679 | 738.28 | 775 | 780 | 180.0 |
| C | 15 | 208 | 29053 | 157.06 | 775 | 780 | 180.0 |
| D | 1 | 52 | 571161 | 3144.46 | 764 | 743 | 181.4 |
| D | 8 | 195 | 461763 | 2541.4 | 764 | 743 | 181.4 |
| D | 12 | 233 | 171476 | 941.17 | 764 | 743 | 181.4 |
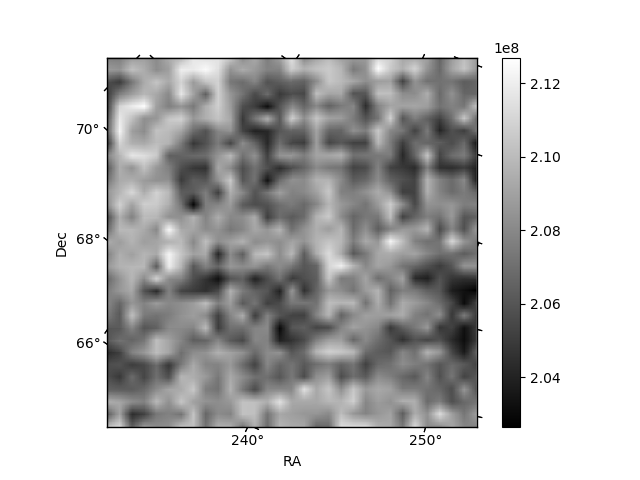
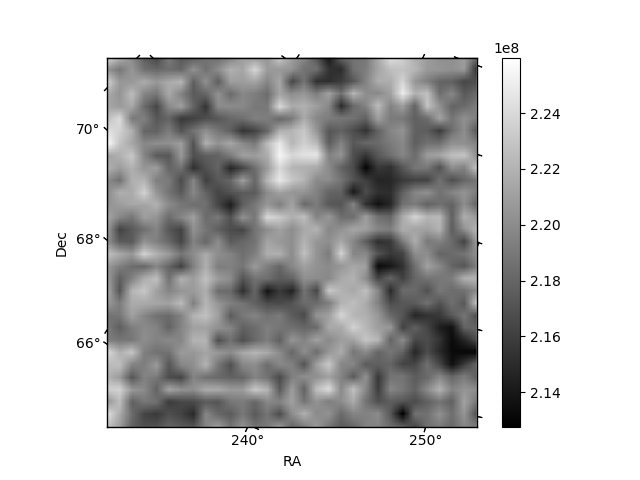
Histogram calculated using DETX and DETY for each event in the final _common_clean file
| Quadrant A |  |
 |
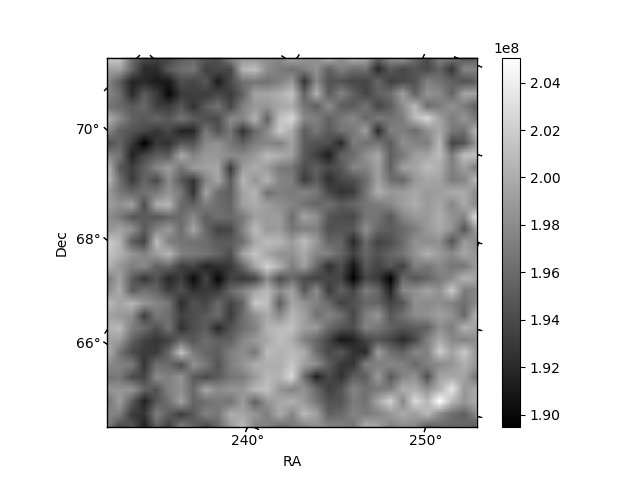
Quadrant B |
|---|---|---|---|
| Quadrant D |  |
 |
Quadrant C |
| Plot type | Count rate plots | Images |
|---|---|---|
| Comparison with Poisson distribution Blue bars denote a histogram of data divided into 1 sec bins. Red curve is a Poisson curve with rate = median count rate of data. |
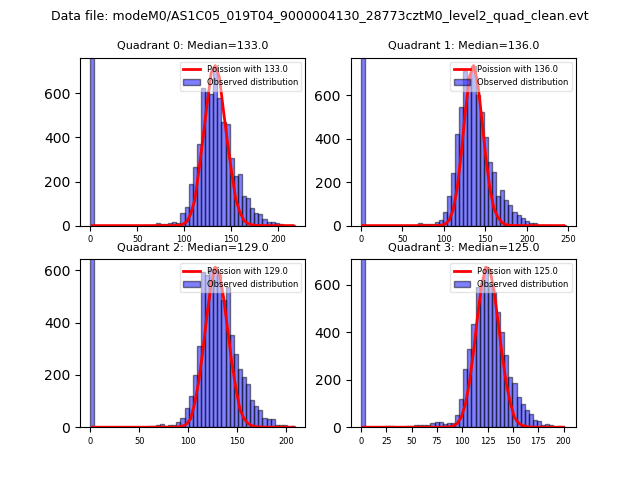 |
 |
| Quadrant-wise count rates Data is divided into 100 sec bins |
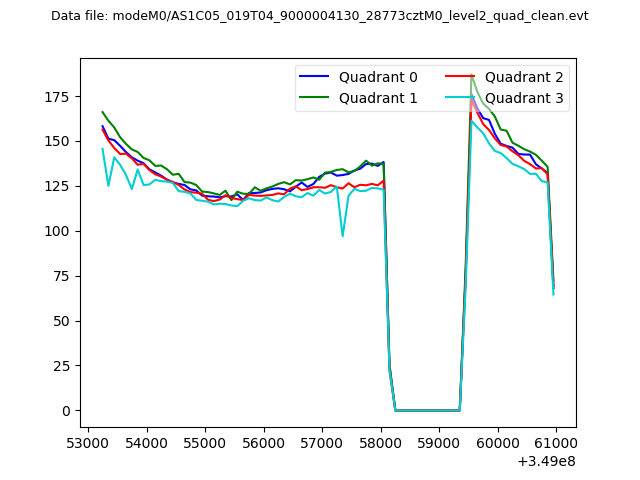 |
|
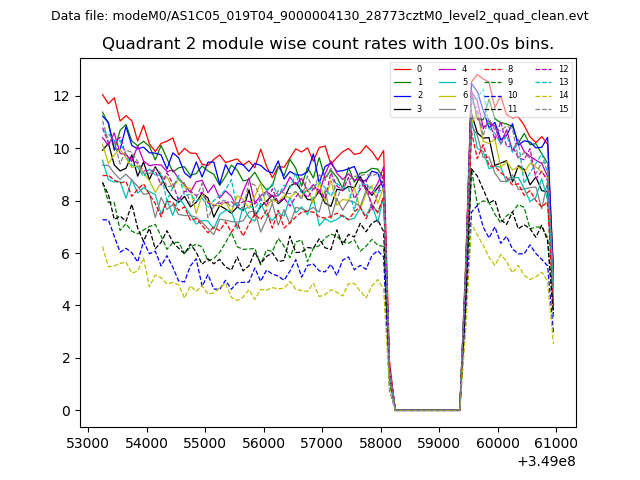
| Module-wise count rates for Quadrant A Data is divided into 100 sec bins |
 |
 |
| Module-wise count rates for Quadrant B Data is divided into 100 sec bins |
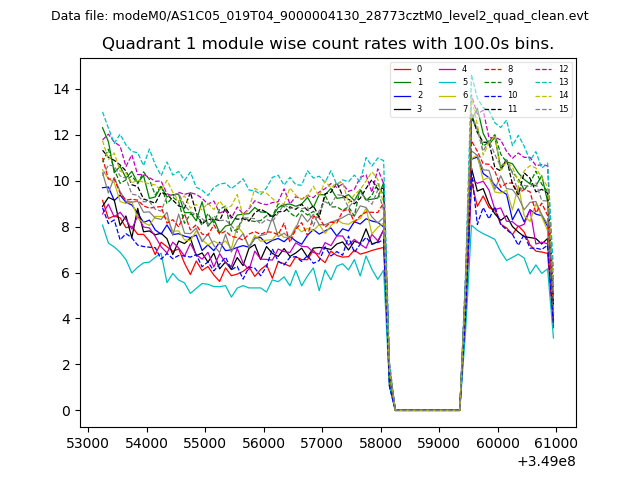 |
 |
| Module-wise count rates for Quadrant C Data is divided into 100 sec bins |
 |
 |
| Module-wise count rates for Quadrant D Data is divided into 100 sec bins |
 |
 |
| Parameter | Plot |
|---|---|
| CZT HV Monitor | 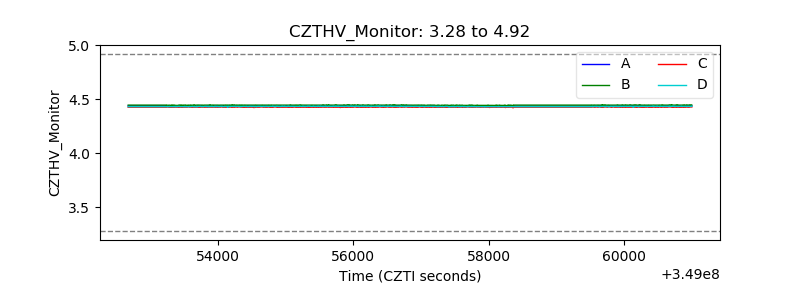 |
| D_VDD |  |
| Temperature 1 |  |
| Veto HV Monitor |  |
| Veto LLD |  |
| Alpha Counter | 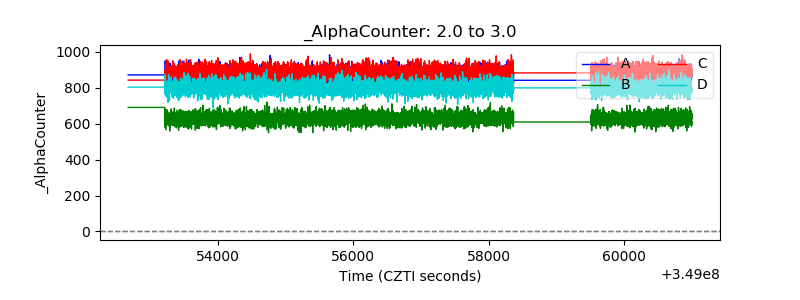 |
| _CPM_Rate | 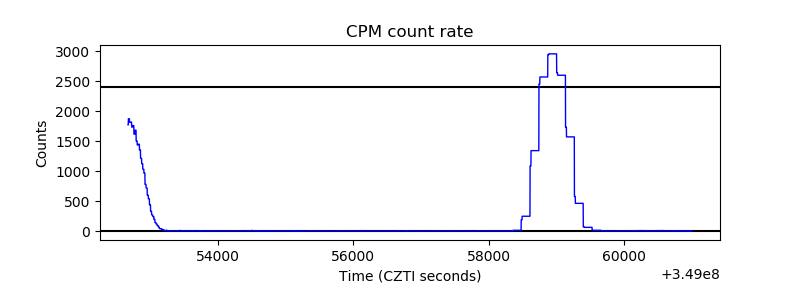 |
| CZT Counter |  |
| +2.5 Volts monitor |  |
| +5 Volts monitor |  |
| _ROLL_ROT |  |
| _Roll_DEC |  |
| _Roll_RA |  |
| Veto Counter |  |