| Param | Original file | Final file |
|---|---|---|
| Filename | modeM0/AS1A10_082T04_9000004150_28945cztM0_level2.evt | modeM0/AS1A10_082T04_9000004150_28945cztM0_level2_quad_clean.evt |
| Size (bytes) | 236,116,800 | 22,086,720 |
| Size | 225.2 MB | 21.1 MB |
| Events in quadrant A | 1,183,894 | 123,499 |
| Events in quadrant B | 1,203,347 | 125,127 |
| Events in quadrant C | 1,255,192 | 122,671 |
| Events in quadrant D | 3,331,726 | 112,108 |
| Mode SS | |||
|---|---|---|---|
| Quadrant | BADHDUFLAG | Total packets | Discarded packets |
| A | 0 | 52 | 0 |
| B | 0 | 52 | 0 |
| C | 0 | 52 | 0 |
| D | 0 | 52 | 0 |
| Mode M0 | |||
|---|---|---|---|
| Quadrant | BADHDUFLAG | Total packets | Discarded packets |
| A | 0 | 5193 | 0 |
| B | 0 | 5215 | 0 |
| C | 0 | 5276 | 0 |
| D | 0 | 11641 | 0 |
| Quadrant | Total seconds | Saturated seconds | Saturation percentage |
|---|---|---|---|
| A | 2573 | 3 | 0.116595% |
| B | 2573 | 0 | 0.000000% |
| C | 2573 | 25 | 0.971628% |
| D | 2573 | 457 | 17.761368% |
Noise dominated data is calculated using 1-second bins in cleaned event files. If a bin has >2000 counts, and if more than 50% of those come from <1% of pixels, then it is considered to be noise-dominated and hence unusable.
| Quadrant | # 1 sec bins | Bins with >0 counts | Bins with >2000 counts | High rate bins dominated by noise | Noise dominated (total time) | Noise dominated (detector-on time) | Marked lightcurve |
|---|---|---|---|---|---|---|---|
| A | 2573 | 2573 | 0 | 0 | 0.00% | 0.00% | 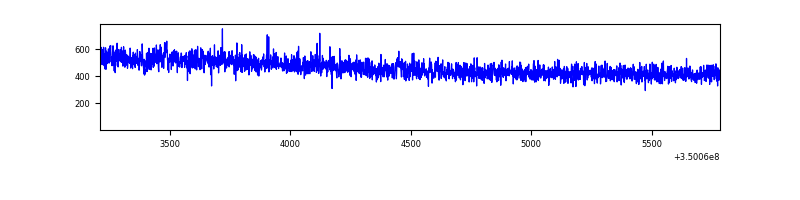 |
| B | 2573 | 2573 | 0 | 0 | 0.00% | 0.00% | 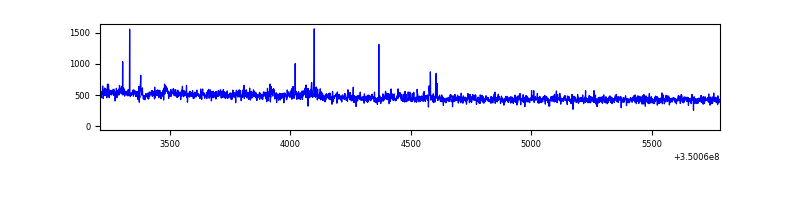 |
| C | 2573 | 2573 | 0 | 0 | 0.00% | 0.00% | 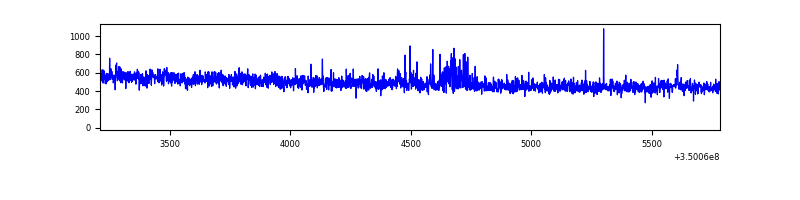 |
| D | 2573 | 2573 | 542 | 542 | 21.06% | 21.06% | 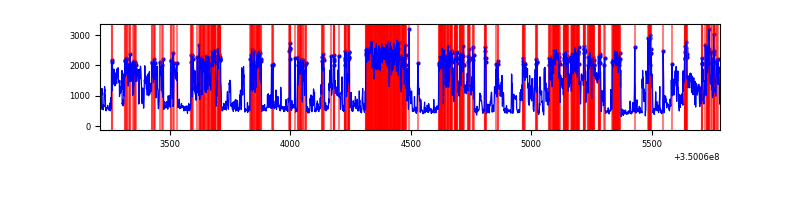 |
Top three noisy pixels from each quadrant. If the there are fewer than three noisy pixels in the level2.evt file, extra rows are filled as -1
| Pixel properties | Quadrant properties | ||||||
|---|---|---|---|---|---|---|---|
| Quadrant | DetID | PixID | Counts | Sigma | Mean | Median | Sigma |
| A | 13 | 254 | 4792 | 70.53 | 306 | 300 | 63.7 |
| A | 3 | 137 | 3035 | 42.94 | 306 | 300 | 63.7 |
| A | 0 | 226 | 2590 | 35.95 | 306 | 300 | 63.7 |
| B | 12 | 111 | 6989 | 114.45 | 303 | 296 | 58.5 |
| B | 11 | 111 | 6364 | 103.77 | 303 | 296 | 58.5 |
| B | 14 | 111 | 5469 | 88.46 | 303 | 296 | 58.5 |
| C | 14 | 238 | 55972 | 793.1 | 297 | 299 | 70.2 |
| C | 3 | 233 | 20420 | 286.64 | 297 | 299 | 70.2 |
| C | 14 | 254 | 10686 | 147.97 | 297 | 299 | 70.2 |
| D | 8 | 195 | 1928302 | 27018.67 | 287 | 279 | 71.4 |
| D | 1 | 52 | 280248 | 3923.39 | 287 | 279 | 71.4 |
| D | 12 | 233 | 14499 | 199.27 | 287 | 279 | 71.4 |
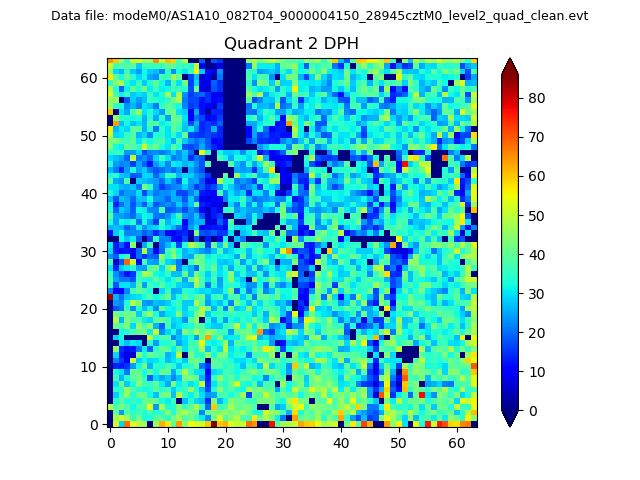
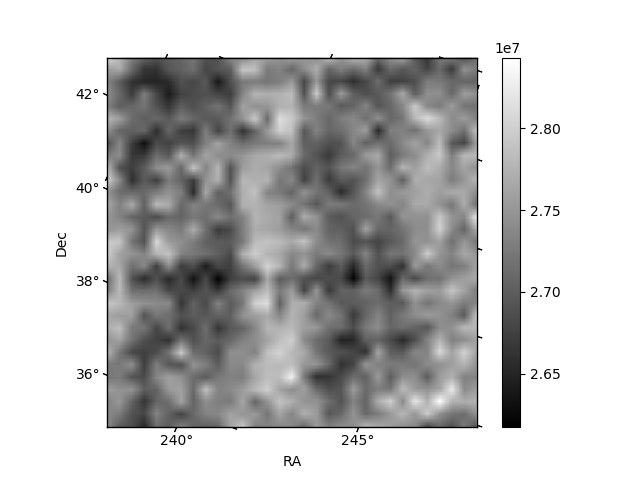
Histogram calculated using DETX and DETY for each event in the final _common_clean file
| Quadrant A |  |
 |
Quadrant B |
|---|---|---|---|
| Quadrant D | 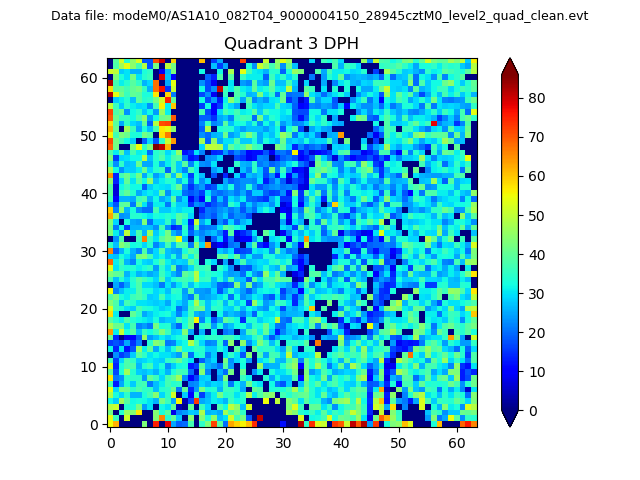 |
 |
Quadrant C |
| Plot type | Count rate plots | Images |
|---|---|---|
| Comparison with Poisson distribution Blue bars denote a histogram of data divided into 1 sec bins. Red curve is a Poisson curve with rate = median count rate of data. |
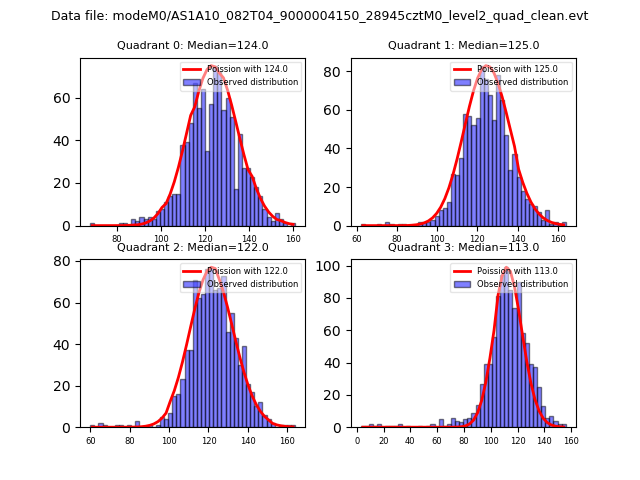 |
 |
| Quadrant-wise count rates Data is divided into 100 sec bins |
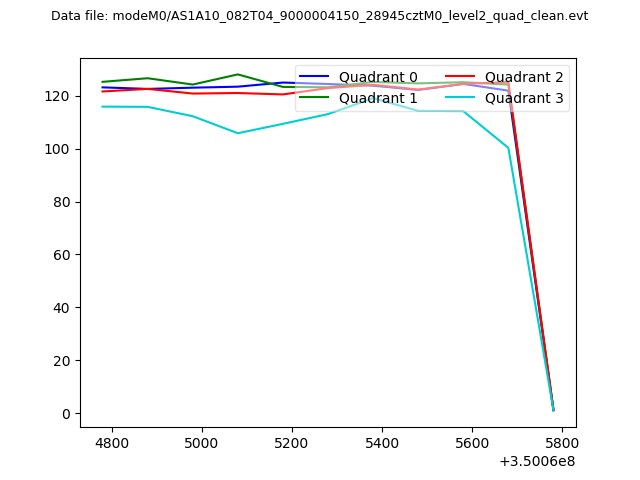 |
|
| Module-wise count rates for Quadrant A Data is divided into 100 sec bins |
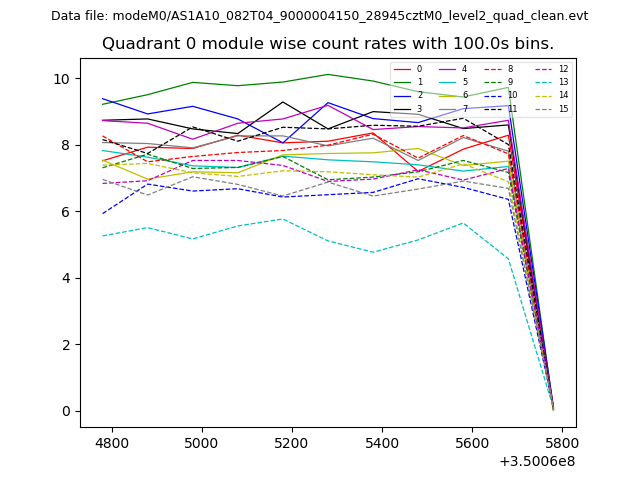 |
 |
| Module-wise count rates for Quadrant B Data is divided into 100 sec bins |
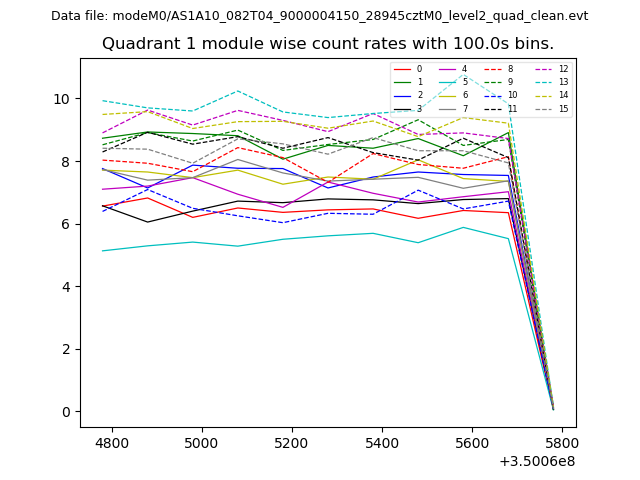 |
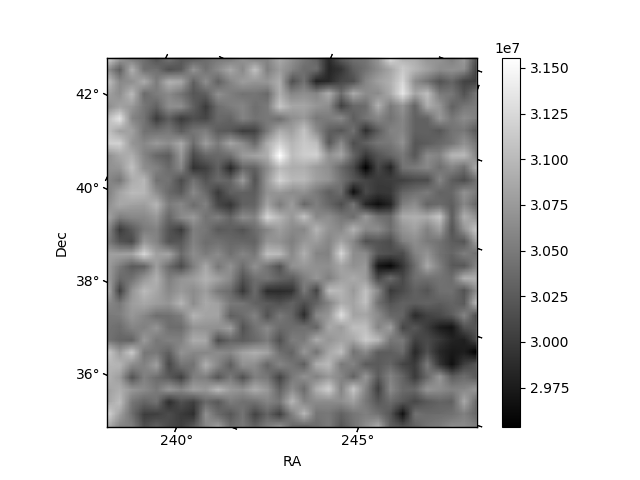 |
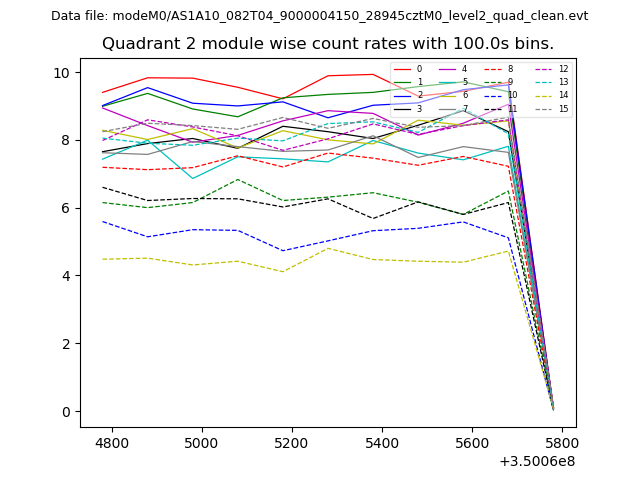
| Module-wise count rates for Quadrant C Data is divided into 100 sec bins |
 |
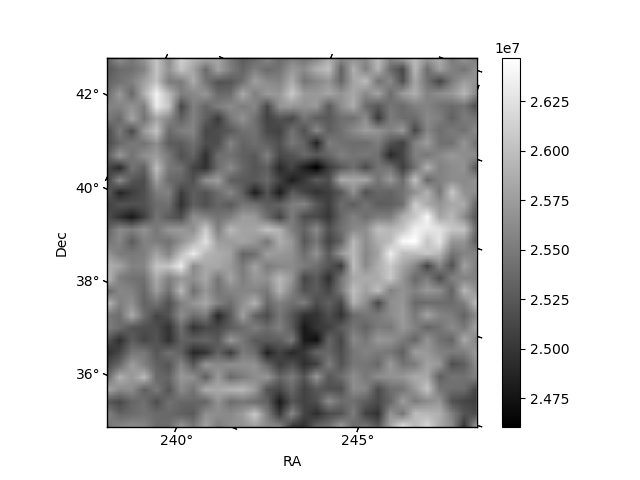 |
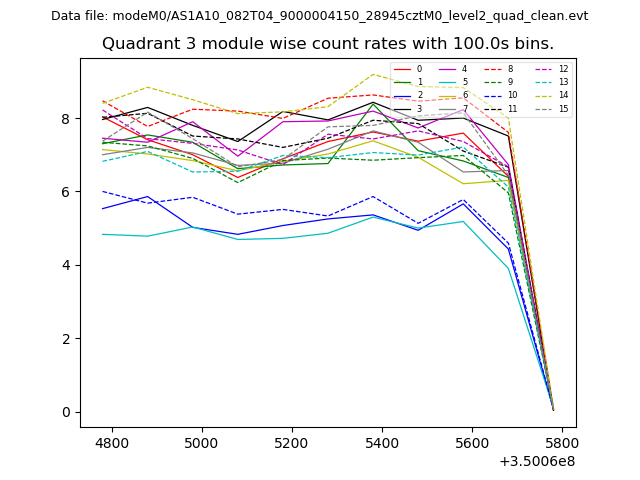
| Module-wise count rates for Quadrant D Data is divided into 100 sec bins |
 |
 |
| Parameter | Plot |
|---|---|
| CZT HV Monitor |  |
| D_VDD | 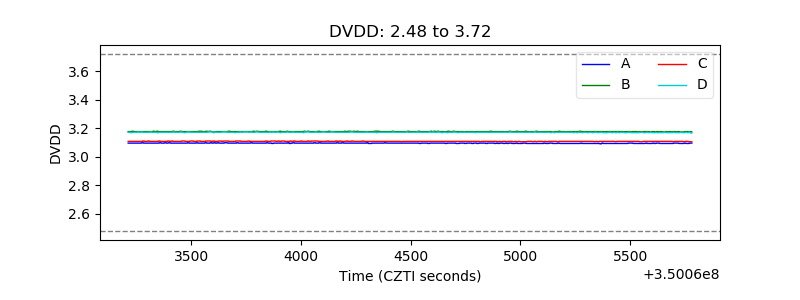 |
| Temperature 1 | 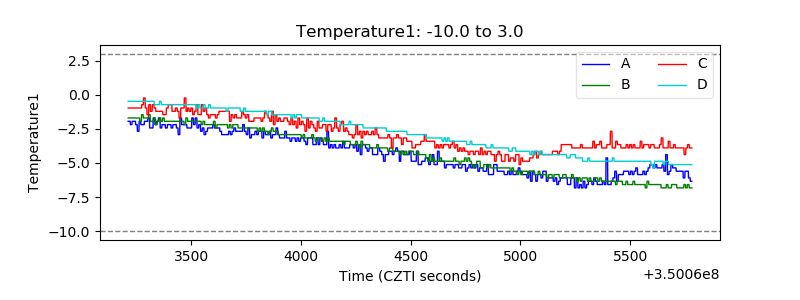 |
| Veto HV Monitor | 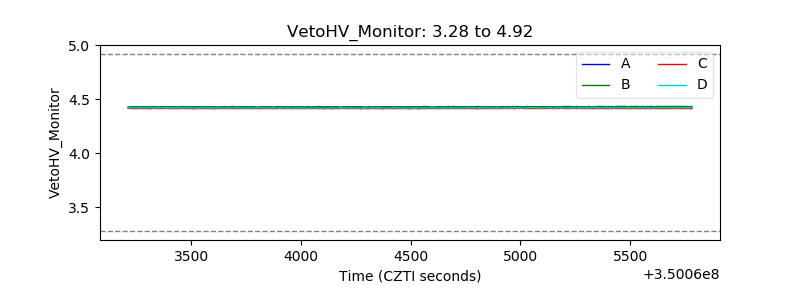 |
| Veto LLD | 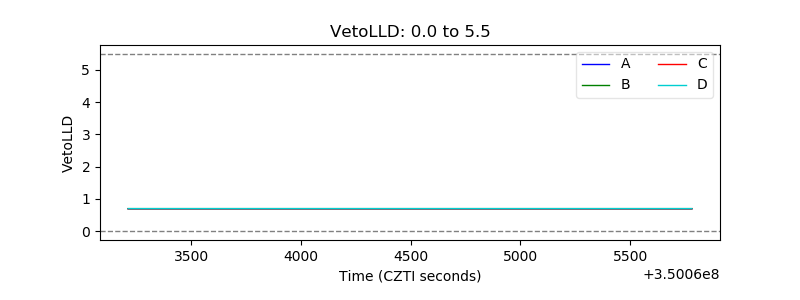 |
| Alpha Counter | 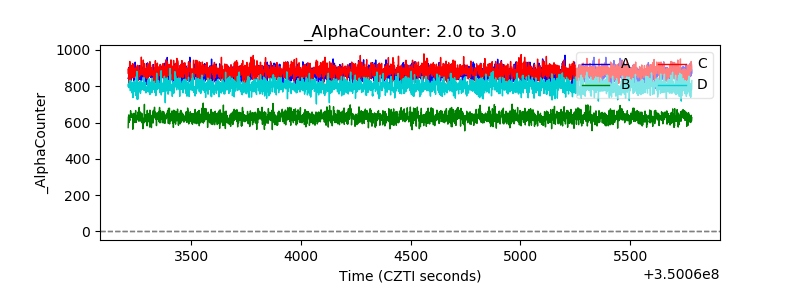 |
| _CPM_Rate | 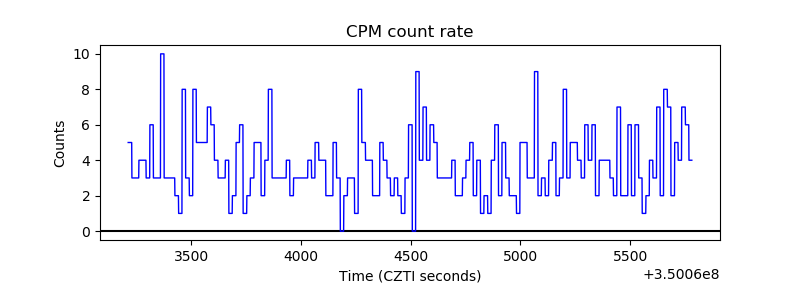 |
| CZT Counter | 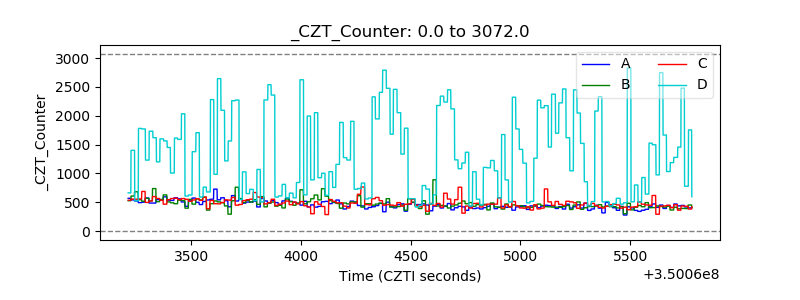 |
| +2.5 Volts monitor |  |
| +5 Volts monitor |  |
| _ROLL_ROT | 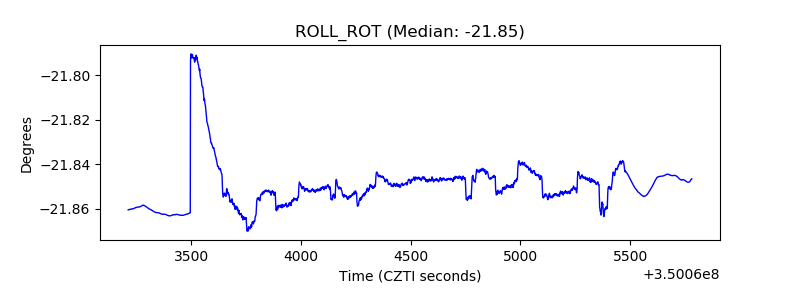 |
| _Roll_DEC | 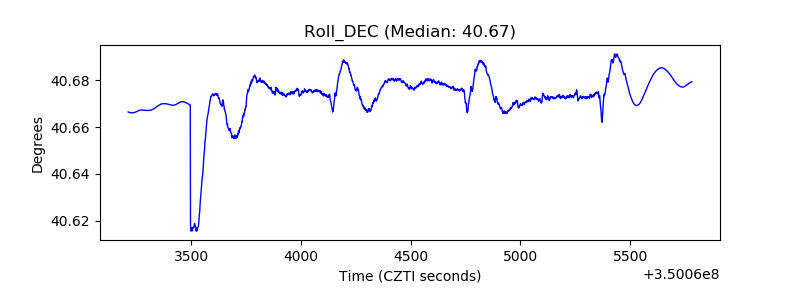 |
| _Roll_RA | 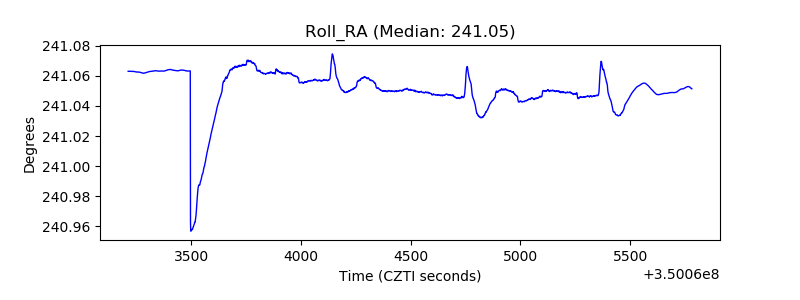 |
| Veto Counter | 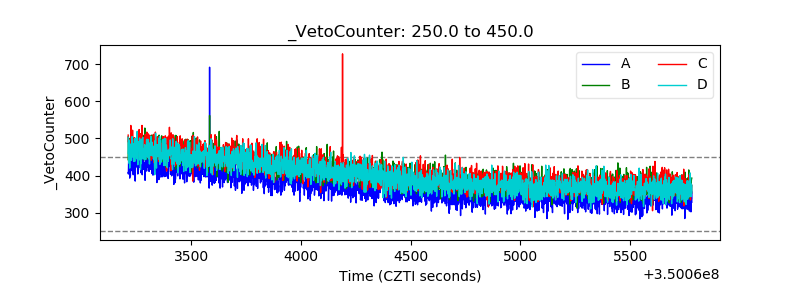 |