| Param | Original file | Final file |
|---|---|---|
| Filename | modeM0/AS1A10_123T02_9000004160_29035cztM0_level2.evt | modeM0/AS1A10_123T02_9000004160_29035cztM0_level2_quad_clean.evt |
| Size (bytes) | 570,260,160 | 111,375,360 |
| Size | 543.8 MB | 106.2 MB |
| Events in quadrant A | 3,037,788 | 760,911 |
| Events in quadrant B | 3,098,265 | 781,654 |
| Events in quadrant C | 5,809,940 | 722,533 |
| Events in quadrant D | 4,925,710 | 695,963 |
| Mode M9 | |||
|---|---|---|---|
| Quadrant | BADHDUFLAG | Total packets | Discarded packets |
| A | 0 | 13 | 0 |
| B | 0 | 13 | 0 |
| C | 0 | 13 | 0 |
| D | 0 | 13 | 0 |
| Mode SS | |||
|---|---|---|---|
| Quadrant | BADHDUFLAG | Total packets | Discarded packets |
| A | 0 | 120 | 0 |
| B | 0 | 120 | 0 |
| C | 0 | 120 | 0 |
| D | 0 | 120 | 0 |
| Mode M0 | |||
|---|---|---|---|
| Quadrant | BADHDUFLAG | Total packets | Discarded packets |
| A | 0 | 12868 | 1 |
| B | 0 | 12971 | 1 |
| C | 0 | 21506 | 1 |
| D | 0 | 18691 | 1 |
| Quadrant | Total seconds | Saturated seconds | Saturation percentage |
|---|---|---|---|
| A | 5895 | 48 | 0.814249% |
| B | 5896 | 59 | 1.000678% |
| C | 5896 | 349 | 5.919267% |
| D | 5896 | 368 | 6.241520% |
Noise dominated data is calculated using 1-second bins in cleaned event files. If a bin has >2000 counts, and if more than 50% of those come from <1% of pixels, then it is considered to be noise-dominated and hence unusable.
| Quadrant | # 1 sec bins | Bins with >0 counts | Bins with >2000 counts | High rate bins dominated by noise | Noise dominated (total time) | Noise dominated (detector-on time) | Marked lightcurve |
|---|---|---|---|---|---|---|---|
| A | 7170 | 5895 | 0 | 0 | 0.00% | 0.00% | 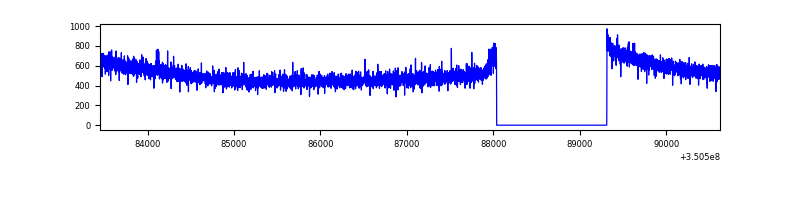 |
| B | 7171 | 5896 | 0 | 0 | 0.00% | 0.00% | 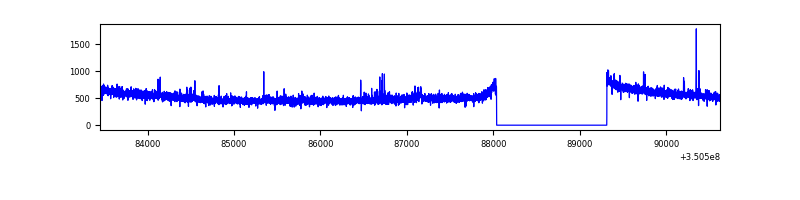 |
| C | 7171 | 5897 | 15 | 15 | 0.21% | 0.25% | 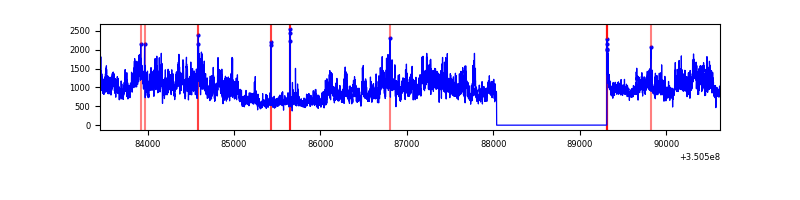 |
| D | 7171 | 5897 | 290 | 290 | 4.04% | 4.92% | 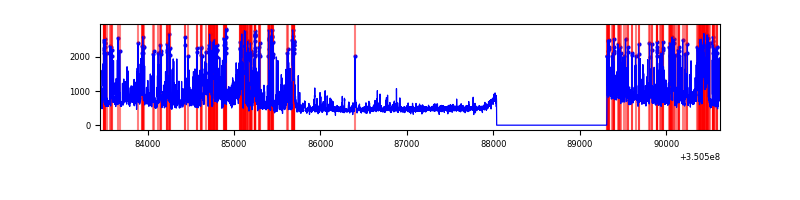 |
Top three noisy pixels from each quadrant. If the there are fewer than three noisy pixels in the level2.evt file, extra rows are filled as -1
| Pixel properties | Quadrant properties | ||||||
|---|---|---|---|---|---|---|---|
| Quadrant | DetID | PixID | Counts | Sigma | Mean | Median | Sigma |
| A | 13 | 254 | 9018 | 53.13 | 786 | 773 | 155.2 |
| A | 3 | 137 | 7045 | 40.41 | 786 | 773 | 155.2 |
| A | 0 | 226 | 6778 | 38.69 | 786 | 773 | 155.2 |
| B | 10 | 245 | 24181 | 162.06 | 779 | 760 | 144.5 |
| B | 12 | 111 | 17209 | 113.82 | 779 | 760 | 144.5 |
| B | 0 | 190 | 16415 | 108.32 | 779 | 760 | 144.5 |
| C | 3 | 233 | 2686422 | 15466.73 | 757 | 766 | 173.6 |
| C | 14 | 238 | 122596 | 701.62 | 757 | 766 | 173.6 |
| C | 2 | 16 | 32691 | 183.86 | 757 | 766 | 173.6 |
| D | 1 | 52 | 1667774 | 9406.11 | 757 | 739 | 177.2 |
| D | 8 | 195 | 229678 | 1291.77 | 757 | 739 | 177.2 |
| D | 7 | 80 | 91541 | 512.34 | 757 | 739 | 177.2 |
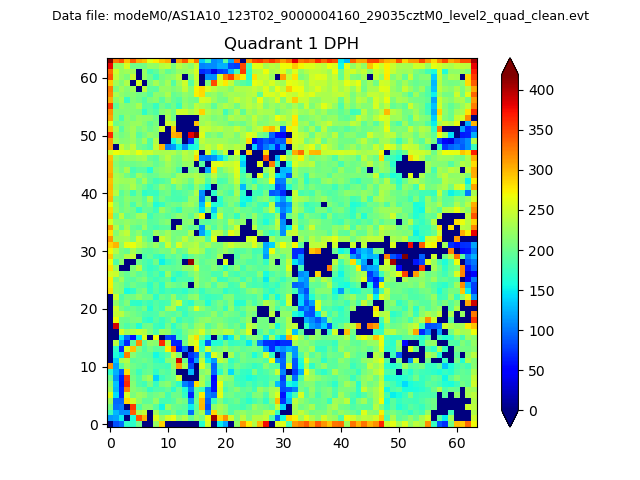
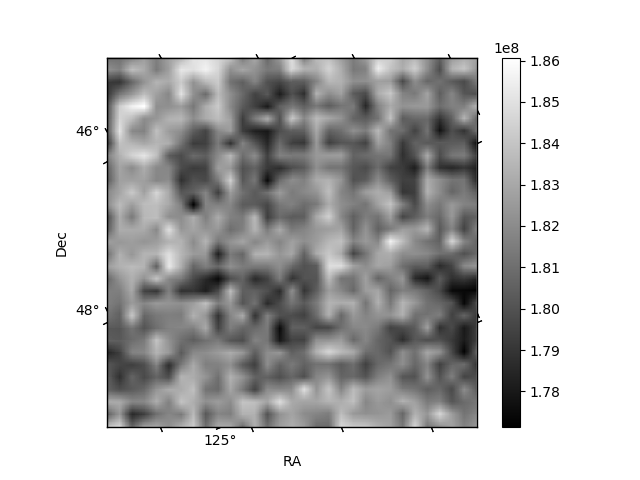
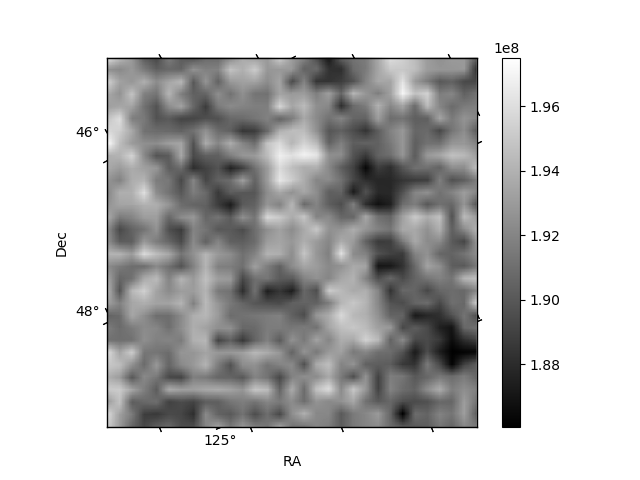
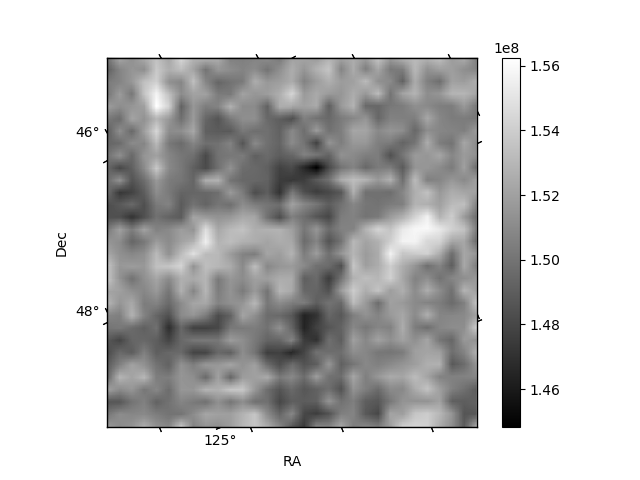
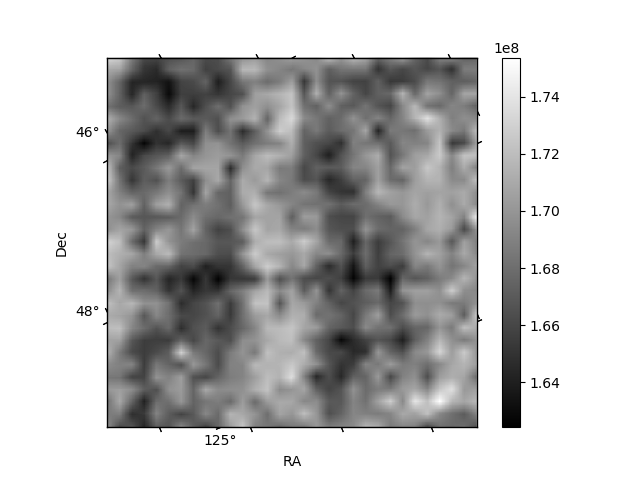
Histogram calculated using DETX and DETY for each event in the final _common_clean file
| Quadrant A |  |
 |
Quadrant B |
|---|---|---|---|
| Quadrant D | 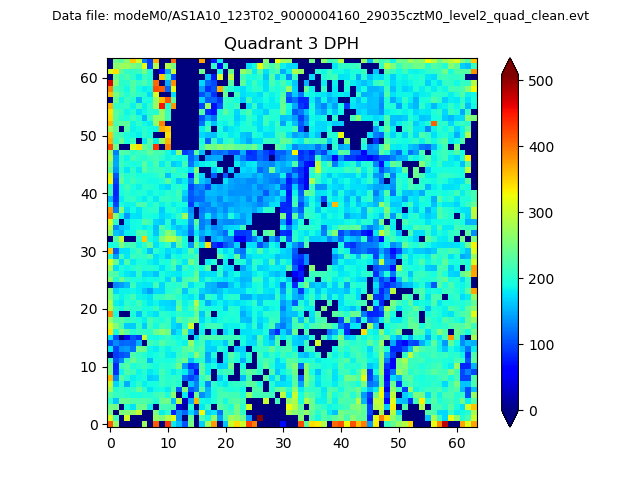 |
 |
Quadrant C |
| Plot type | Count rate plots | Images |
|---|---|---|
| Comparison with Poisson distribution Blue bars denote a histogram of data divided into 1 sec bins. Red curve is a Poisson curve with rate = median count rate of data. |
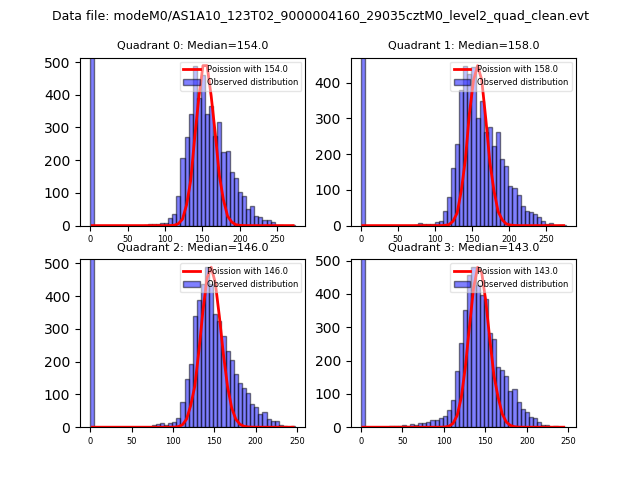 |
 |
| Quadrant-wise count rates Data is divided into 100 sec bins |
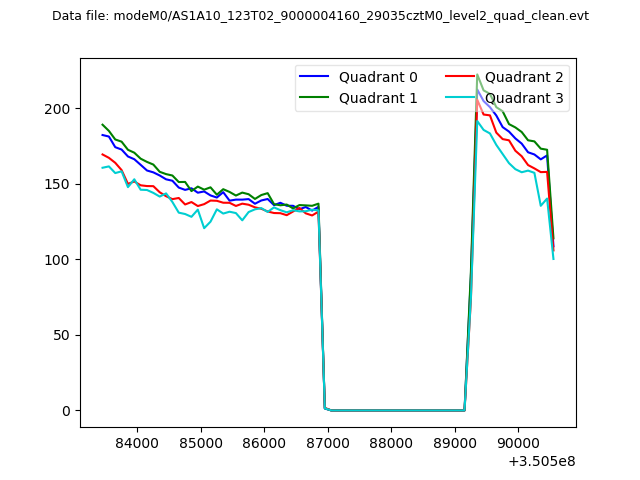 |
|
| Module-wise count rates for Quadrant A Data is divided into 100 sec bins |
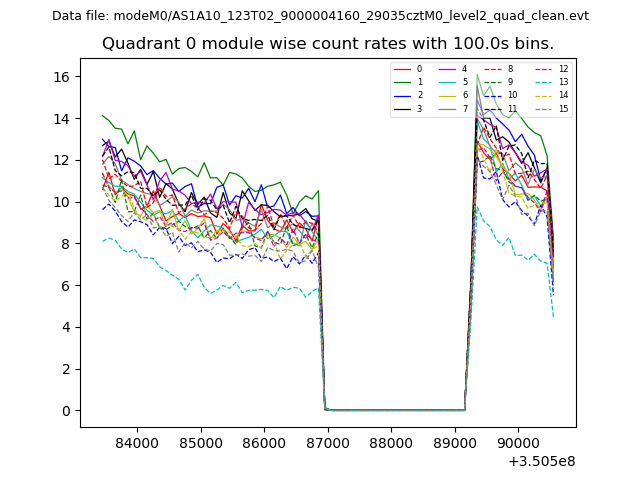 |
 |
| Module-wise count rates for Quadrant B Data is divided into 100 sec bins |
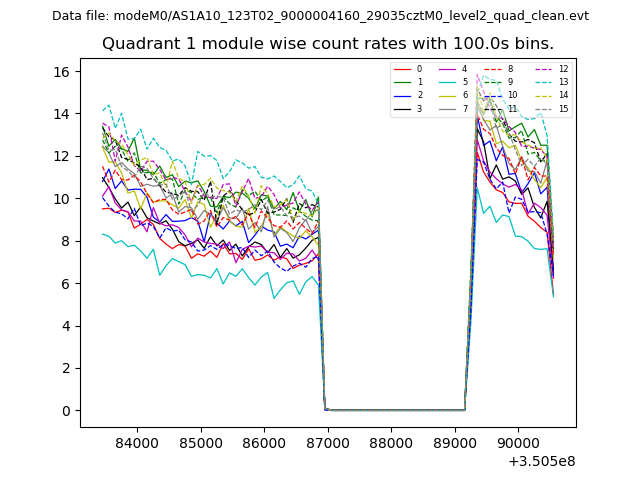 |
 |
| Module-wise count rates for Quadrant C Data is divided into 100 sec bins |
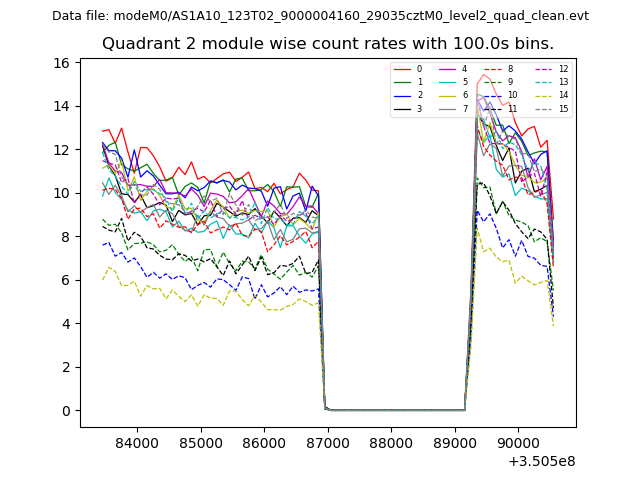 |
 |
| Module-wise count rates for Quadrant D Data is divided into 100 sec bins |
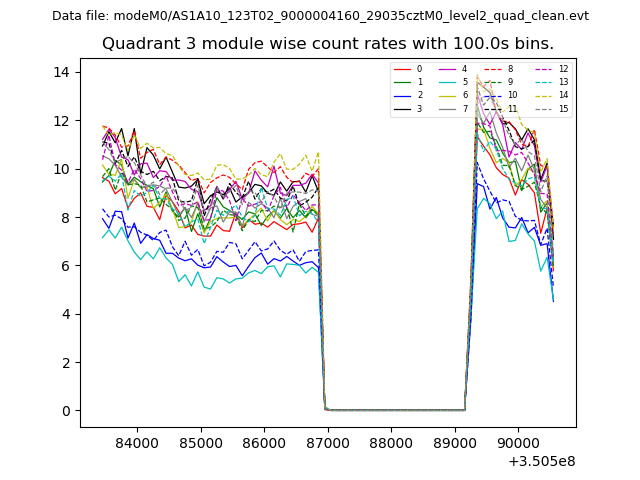 |
 |
| Parameter | Plot |
|---|---|
| CZT HV Monitor | 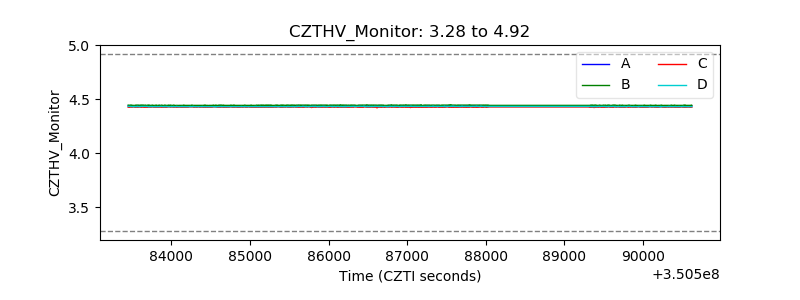 |
| D_VDD | 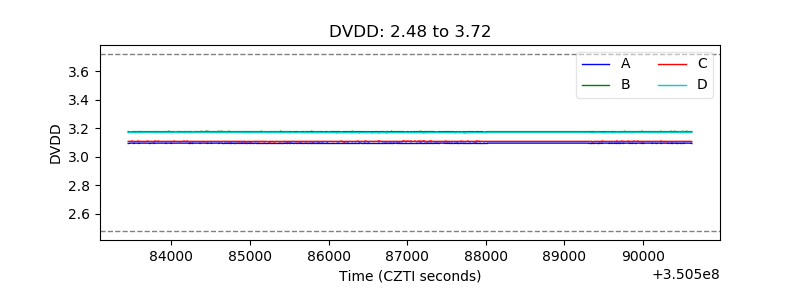 |
| Temperature 1 | 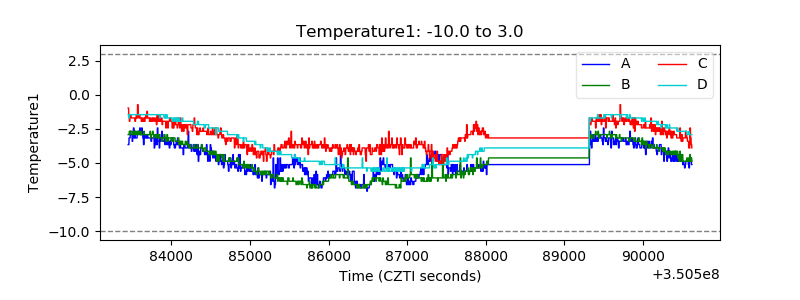 |
| Veto HV Monitor | 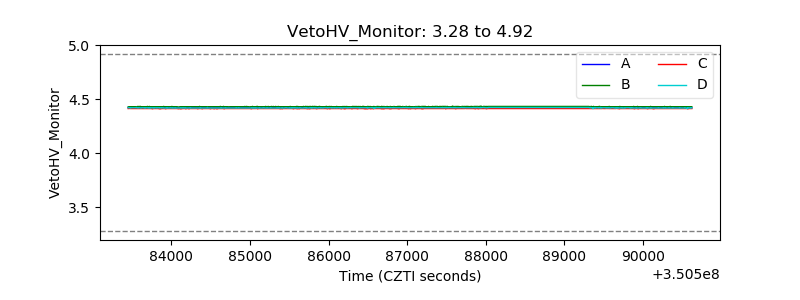 |
| Veto LLD | 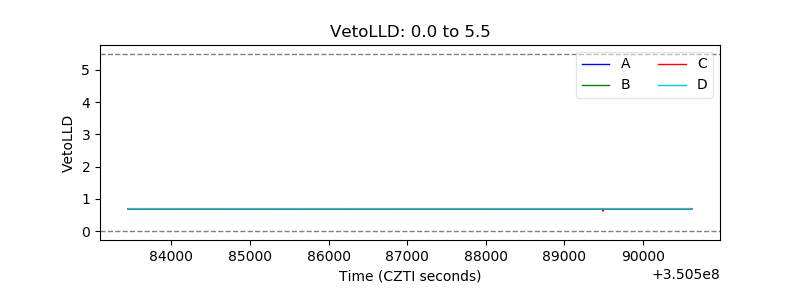 |
| Alpha Counter |  |
| _CPM_Rate | 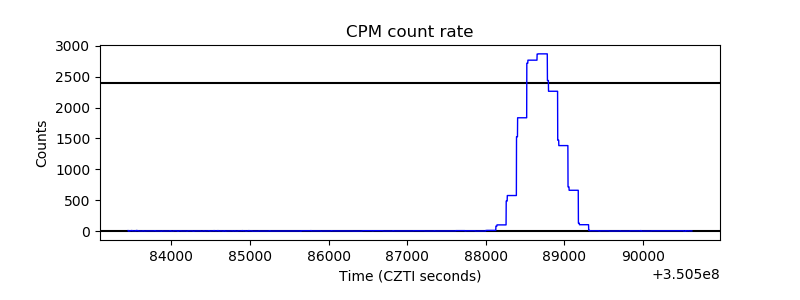 |
| CZT Counter |  |
| +2.5 Volts monitor |  |
| +5 Volts monitor |  |
| _ROLL_ROT | 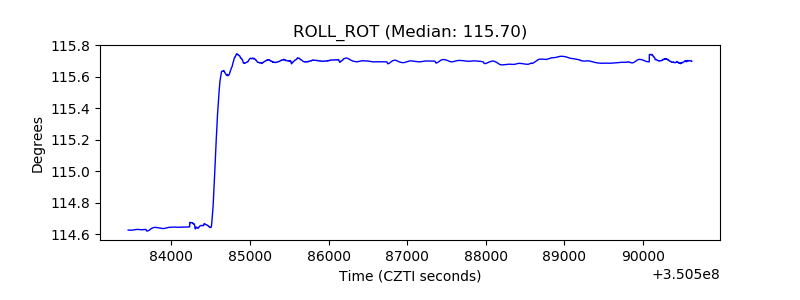 |
| _Roll_DEC | 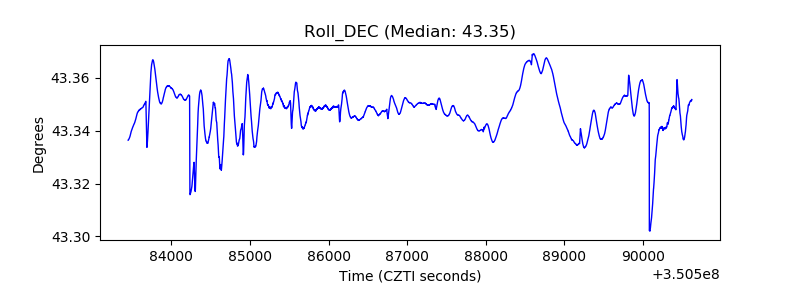 |
| _Roll_RA |  |
| Veto Counter | 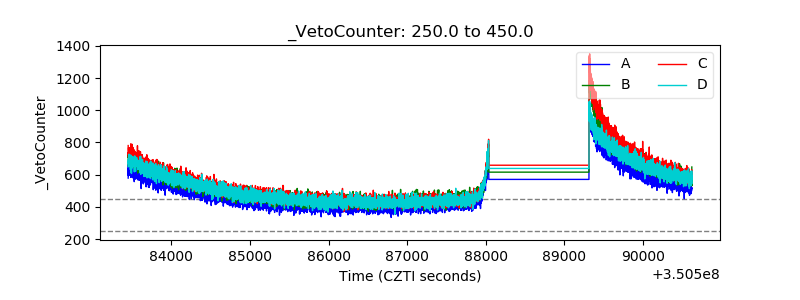 |