| Param | Original file | Final file |
|---|---|---|
| Filename | modeM0/AS1A10_099T01_9000004184_29154cztM0_level2.evt | modeM0/AS1A10_099T01_9000004184_29154cztM0_level2_quad_clean.evt |
| Size (bytes) | 513,521,280 | 99,377,280 |
| Size | 489.7 MB | 94.8 MB |
| Events in quadrant A | 3,231,907 | 664,795 |
| Events in quadrant B | 3,386,038 | 681,475 |
| Events in quadrant C | 3,285,033 | 634,431 |
| Events in quadrant D | 5,230,277 | 597,895 |
| Mode M9 | |||
|---|---|---|---|
| Quadrant | BADHDUFLAG | Total packets | Discarded packets |
| A | 0 | 13 | 0 |
| B | 0 | 13 | 0 |
| C | 0 | 13 | 0 |
| D | 0 | 13 | 0 |
| Mode SS | |||
|---|---|---|---|
| Quadrant | BADHDUFLAG | Total packets | Discarded packets |
| A | 0 | 124 | 0 |
| B | 0 | 124 | 0 |
| C | 0 | 124 | 0 |
| D | 0 | 124 | 0 |
| Mode M0 | |||
|---|---|---|---|
| Quadrant | BADHDUFLAG | Total packets | Discarded packets |
| A | 0 | 13410 | 1 |
| B | 0 | 13895 | 1 |
| C | 0 | 13488 | 1 |
| D | 0 | 19736 | 5 |
| Quadrant | Total seconds | Saturated seconds | Saturation percentage |
|---|---|---|---|
| A | 6179 | 99 | 1.602201% |
| B | 6180 | 126 | 2.038835% |
| C | 6180 | 135 | 2.184466% |
| D | 6179 | 354 | 5.729082% |
Noise dominated data is calculated using 1-second bins in cleaned event files. If a bin has >2000 counts, and if more than 50% of those come from <1% of pixels, then it is considered to be noise-dominated and hence unusable.
| Quadrant | # 1 sec bins | Bins with >0 counts | Bins with >2000 counts | High rate bins dominated by noise | Noise dominated (total time) | Noise dominated (detector-on time) | Marked lightcurve |
|---|---|---|---|---|---|---|---|
| A | 7434 | 6180 | 0 | 0 | 0.00% | 0.00% | 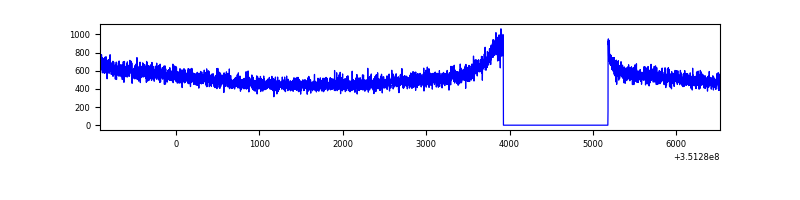 |
| B | 7435 | 6181 | 4 | 4 | 0.05% | 0.06% | 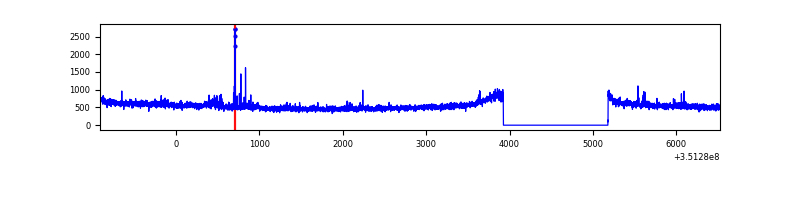 |
| C | 7435 | 6181 | 0 | 0 | 0.00% | 0.00% | 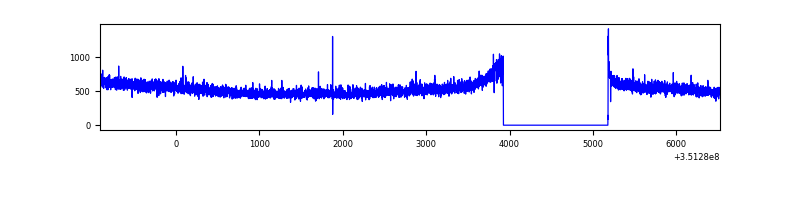 |
| D | 7434 | 6180 | 256 | 256 | 3.44% | 4.14% | 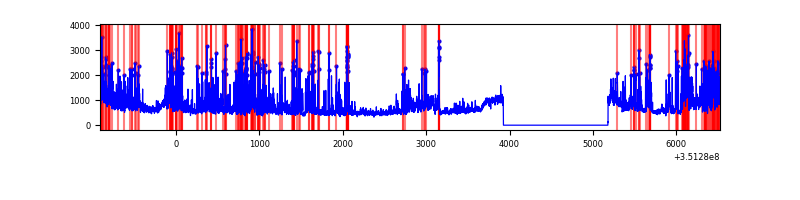 |
Top three noisy pixels from each quadrant. If the there are fewer than three noisy pixels in the level2.evt file, extra rows are filled as -1
| Pixel properties | Quadrant properties | ||||||
|---|---|---|---|---|---|---|---|
| Quadrant | DetID | PixID | Counts | Sigma | Mean | Median | Sigma |
| A | 13 | 254 | 11810 | 66.28 | 835 | 822 | 165.8 |
| A | 3 | 137 | 8050 | 43.6 | 835 | 822 | 165.8 |
| A | 13 | 6 | 7427 | 39.84 | 835 | 822 | 165.8 |
| B | 0 | 183 | 44865 | 280.07 | 833 | 814 | 157.3 |
| B | 0 | 189 | 41201 | 256.77 | 833 | 814 | 157.3 |
| B | 10 | 245 | 25183 | 154.93 | 833 | 814 | 157.3 |
| C | 14 | 238 | 133269 | 715.15 | 795 | 805 | 185.2 |
| C | 3 | 233 | 31918 | 167.97 | 795 | 805 | 185.2 |
| C | 2 | 114 | 14947 | 76.35 | 795 | 805 | 185.2 |
| D | 1 | 52 | 1714418 | 9253.47 | 781 | 765 | 185.2 |
| D | 8 | 195 | 436458 | 2352.68 | 781 | 765 | 185.2 |
| D | 10 | 33 | 50956 | 271.02 | 781 | 765 | 185.2 |
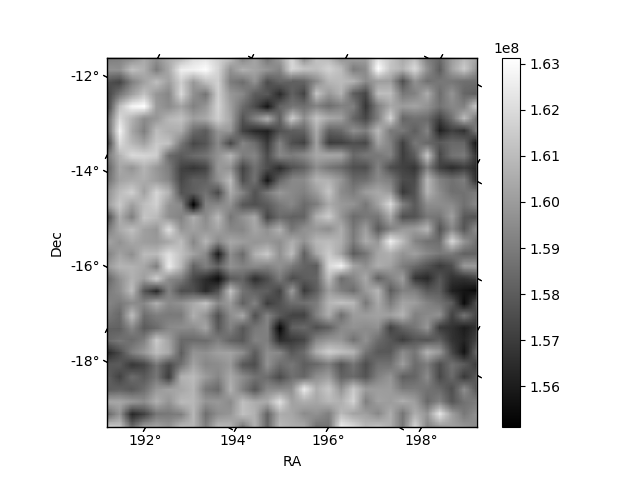
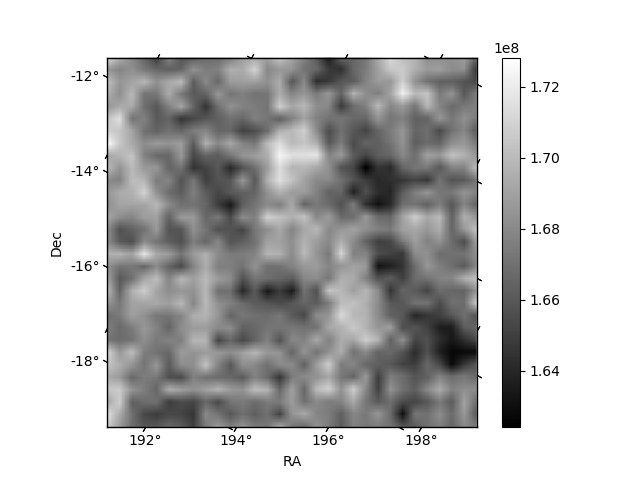
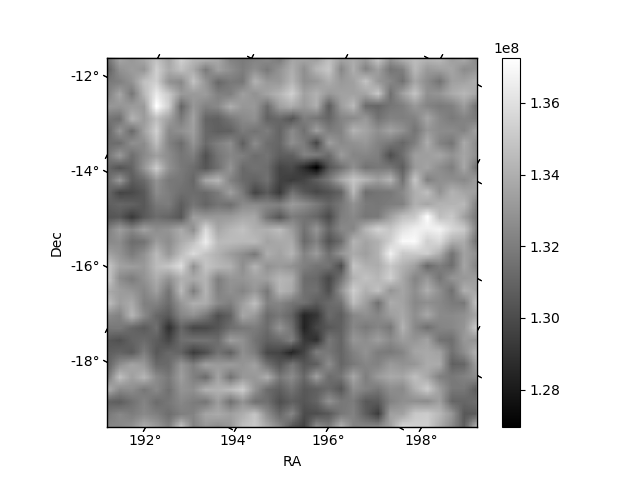
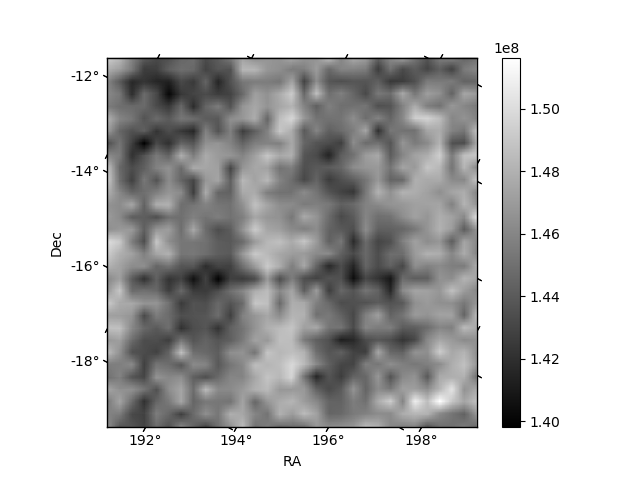
Histogram calculated using DETX and DETY for each event in the final _common_clean file
| Quadrant A | 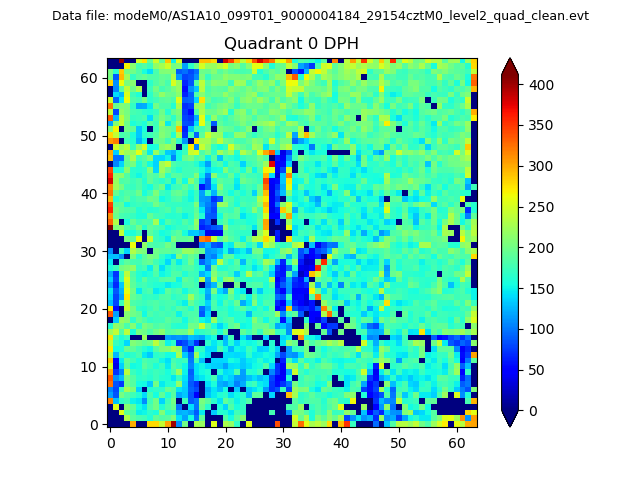 |
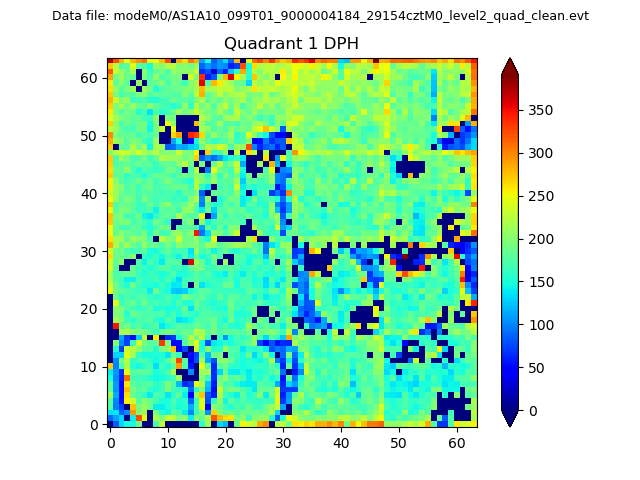 |
Quadrant B |
|---|---|---|---|
| Quadrant D | 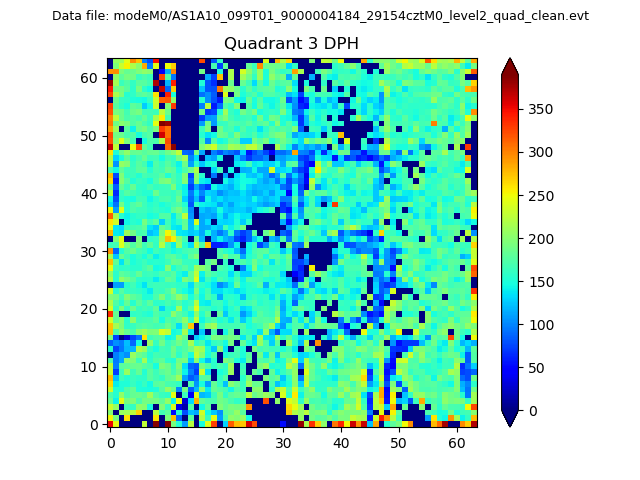 |
 |
Quadrant C |
| Plot type | Count rate plots | Images |
|---|---|---|
| Comparison with Poisson distribution Blue bars denote a histogram of data divided into 1 sec bins. Red curve is a Poisson curve with rate = median count rate of data. |
 |
 |
| Quadrant-wise count rates Data is divided into 100 sec bins |
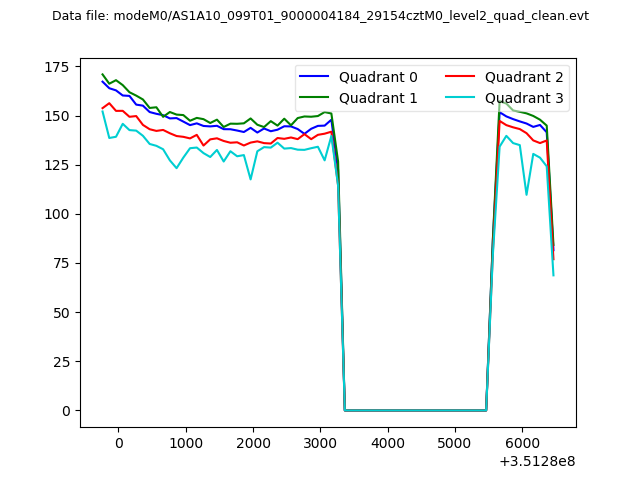 |
|
| Module-wise count rates for Quadrant A Data is divided into 100 sec bins |
 |
 |
| Module-wise count rates for Quadrant B Data is divided into 100 sec bins |
 |
 |
| Module-wise count rates for Quadrant C Data is divided into 100 sec bins |
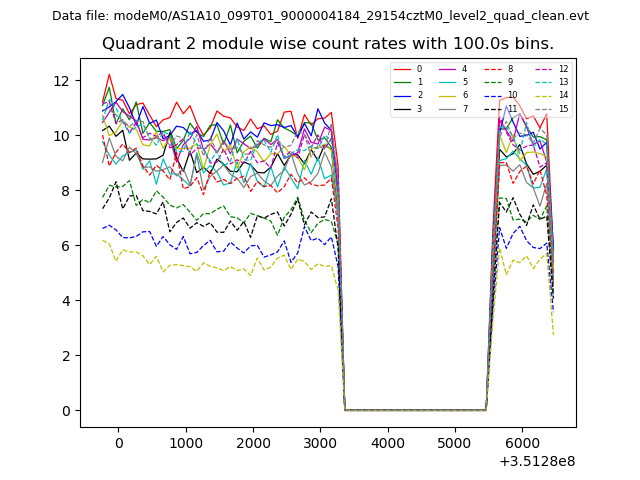 |
 |
| Module-wise count rates for Quadrant D Data is divided into 100 sec bins |
 |
 |
| Parameter | Plot |
|---|---|
| CZT HV Monitor | 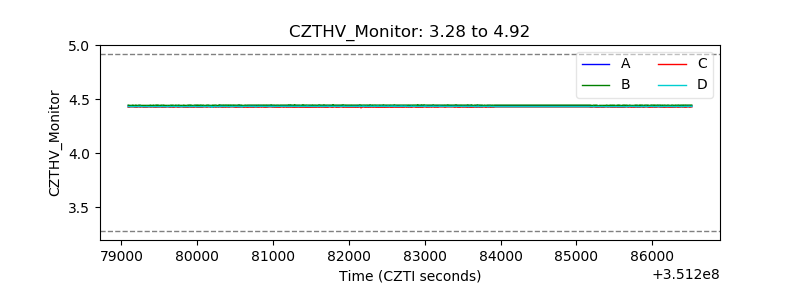 |
| D_VDD | 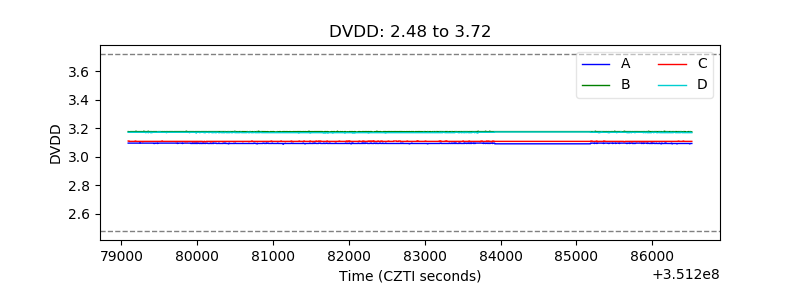 |
| Temperature 1 | 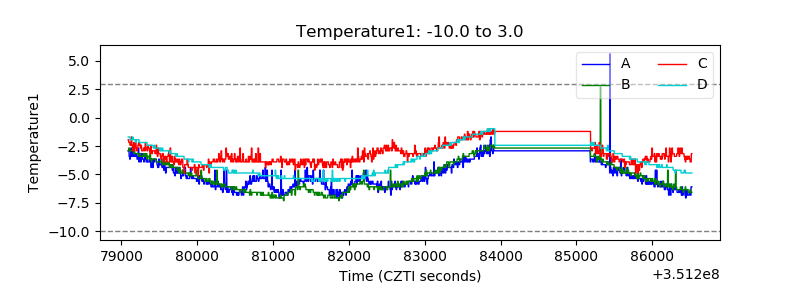 |
| Veto HV Monitor | 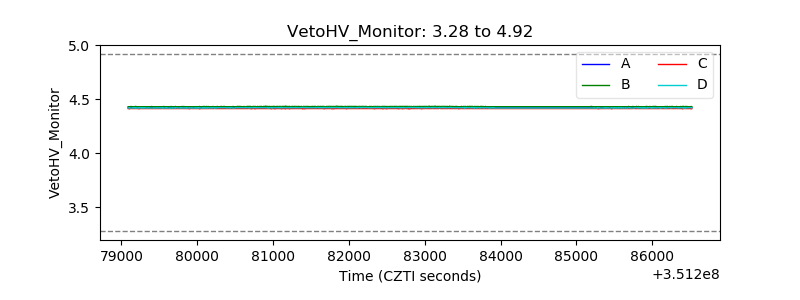 |
| Veto LLD | 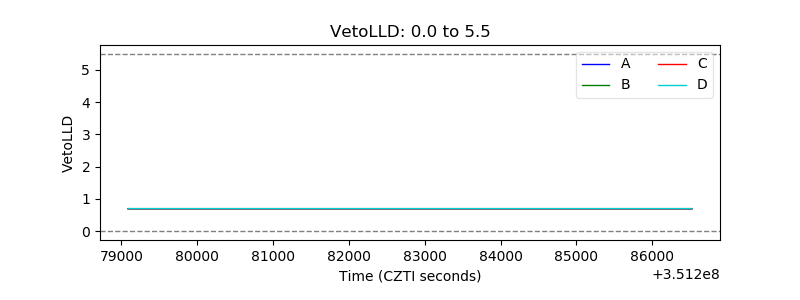 |
| Alpha Counter | 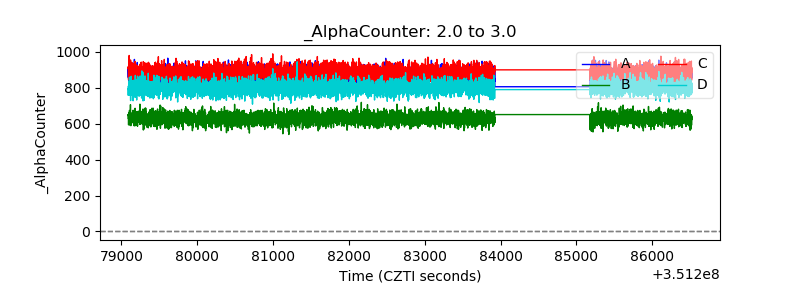 |
| _CPM_Rate | 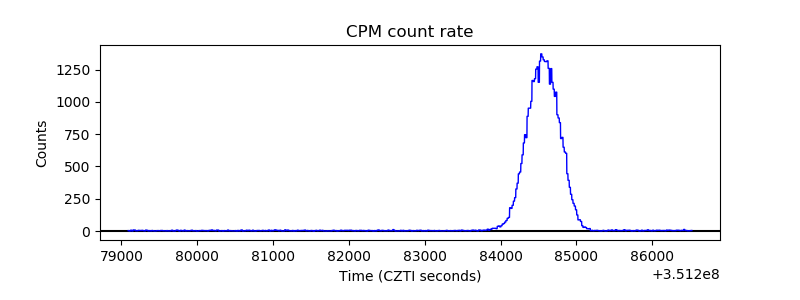 |
| CZT Counter | 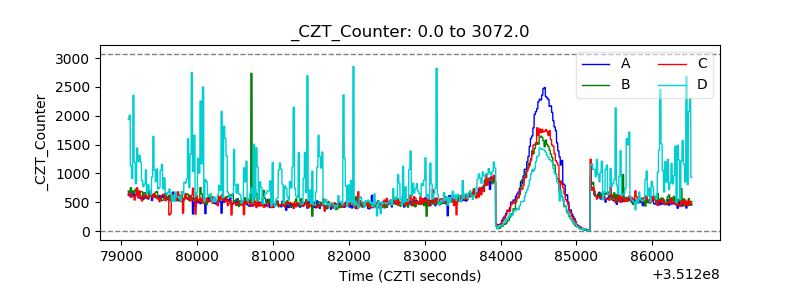 |
| +2.5 Volts monitor |  |
| +5 Volts monitor |  |
| _ROLL_ROT | 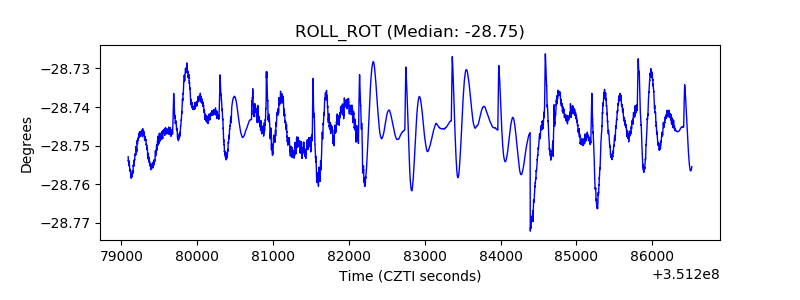 |
| _Roll_DEC |  |
| _Roll_RA | 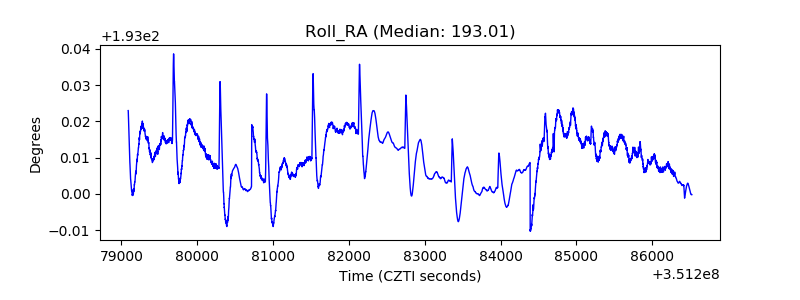 |
| Veto Counter |  |