| Param | Original file | Final file |
|---|---|---|
| Filename | modeM0/AS1A10_102T02_9000004200_29210cztM0_level2.evt | modeM0/AS1A10_102T02_9000004200_29210cztM0_level2_quad_clean.evt |
| Size (bytes) | 251,210,880 | 53,331,840 |
| Size | 239.6 MB | 50.9 MB |
| Events in quadrant A | 1,620,560 | 359,904 |
| Events in quadrant B | 1,680,417 | 366,289 |
| Events in quadrant C | 1,783,219 | 350,784 |
| Events in quadrant D | 2,328,587 | 334,027 |
| Mode SS | |||
|---|---|---|---|
| Quadrant | BADHDUFLAG | Total packets | Discarded packets |
| A | 0 | 60 | 0 |
| B | 0 | 60 | 0 |
| C | 0 | 60 | 0 |
| D | 0 | 60 | 0 |
| Mode M0 | |||
|---|---|---|---|
| Quadrant | BADHDUFLAG | Total packets | Discarded packets |
| A | 0 | 6809 | 1 |
| B | 0 | 6911 | 1 |
| C | 0 | 7288 | 1 |
| D | 0 | 8908 | 1 |
| Mode M9 | |||
|---|---|---|---|
| Quadrant | BADHDUFLAG | Total packets | Discarded packets |
| A | 0 | 13 | 0 |
| B | 0 | 13 | 0 |
| C | 0 | 13 | 0 |
| D | 0 | 13 | 0 |
| Quadrant | Total seconds | Saturated seconds | Saturation percentage |
|---|---|---|---|
| A | 2850 | 84 | 2.947368% |
| B | 2850 | 87 | 3.052632% |
| C | 2850 | 102 | 3.578947% |
| D | 2850 | 215 | 7.543860% |
Noise dominated data is calculated using 1-second bins in cleaned event files. If a bin has >2000 counts, and if more than 50% of those come from <1% of pixels, then it is considered to be noise-dominated and hence unusable.
| Quadrant | # 1 sec bins | Bins with >0 counts | Bins with >2000 counts | High rate bins dominated by noise | Noise dominated (total time) | Noise dominated (detector-on time) | Marked lightcurve |
|---|---|---|---|---|---|---|---|
| A | 4145 | 2851 | 0 | 0 | 0.00% | 0.00% | 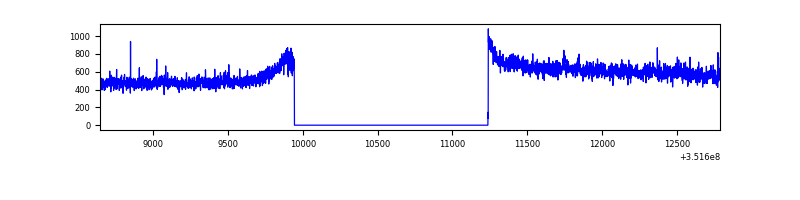 |
| B | 4145 | 2851 | 1 | 1 | 0.02% | 0.04% | 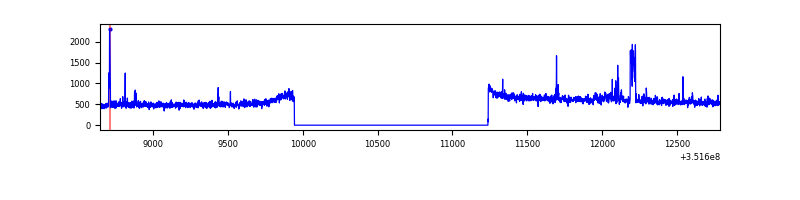 |
| C | 4145 | 2851 | 0 | 0 | 0.00% | 0.00% | 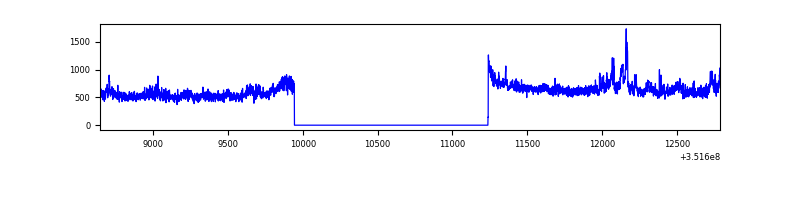 |
| D | 4145 | 2851 | 115 | 115 | 2.77% | 4.03% | 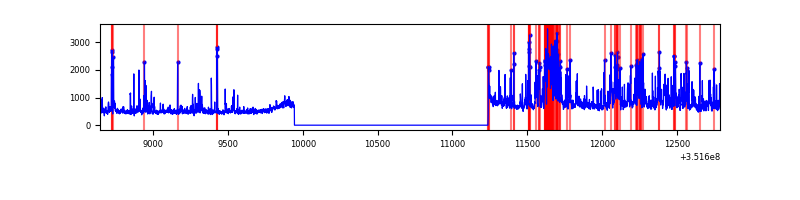 |
Top three noisy pixels from each quadrant. If the there are fewer than three noisy pixels in the level2.evt file, extra rows are filled as -1
| Pixel properties | Quadrant properties | ||||||
|---|---|---|---|---|---|---|---|
| Quadrant | DetID | PixID | Counts | Sigma | Mean | Median | Sigma |
| A | 0 | 13 | 35766 | 432.65 | 410 | 403 | 81.7 |
| A | 13 | 254 | 5944 | 67.79 | 410 | 403 | 81.7 |
| A | 3 | 137 | 3604 | 39.16 | 410 | 403 | 81.7 |
| B | 0 | 190 | 37868 | 495.46 | 403 | 394 | 75.6 |
| B | 0 | 183 | 34791 | 454.78 | 403 | 394 | 75.6 |
| B | 10 | 245 | 20890 | 270.99 | 403 | 394 | 75.6 |
| C | 3 | 233 | 181218 | 2009.5 | 392 | 395 | 90.0 |
| C | 14 | 238 | 65278 | 721.05 | 392 | 395 | 90.0 |
| C | 2 | 114 | 6737 | 70.48 | 392 | 395 | 90.0 |
| D | 1 | 52 | 637336 | 6943.9 | 391 | 382 | 91.7 |
| D | 8 | 195 | 160687 | 1747.6 | 391 | 382 | 91.7 |
| D | 13 | 104 | 18617 | 198.79 | 391 | 382 | 91.7 |
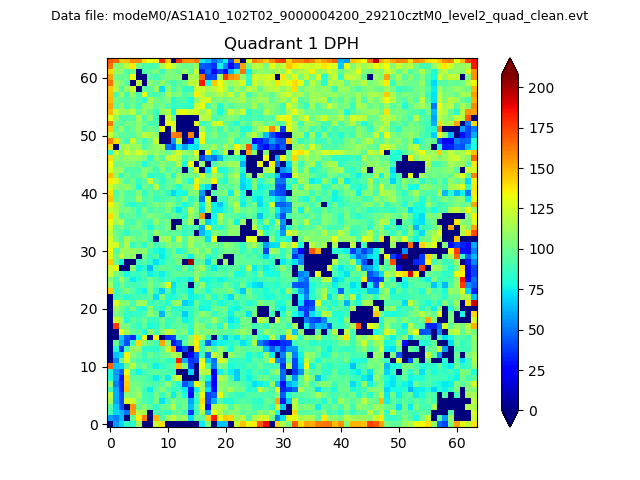
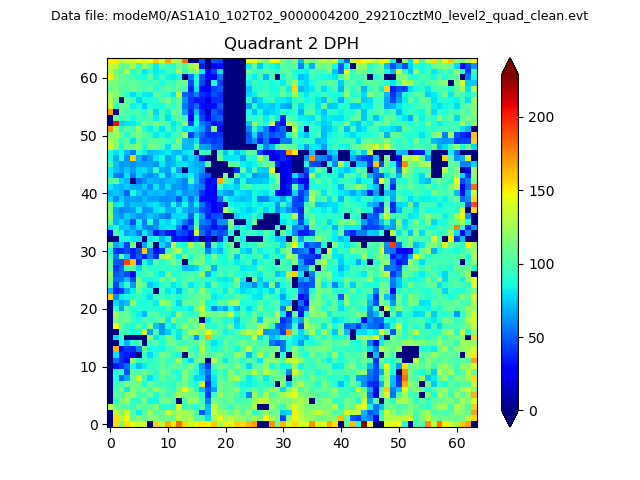
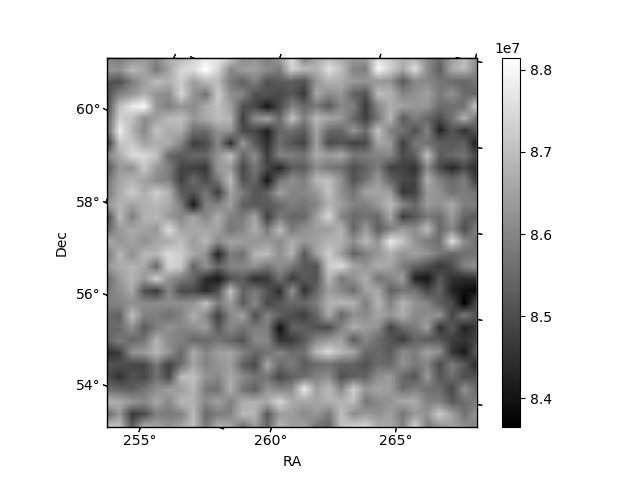
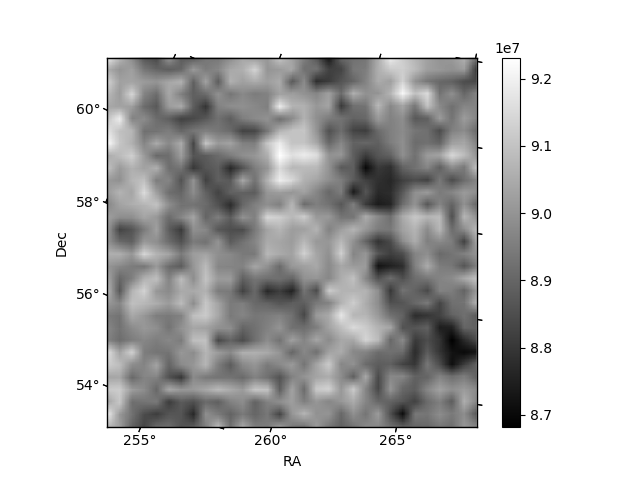
Histogram calculated using DETX and DETY for each event in the final _common_clean file
| Quadrant A |  |
 |
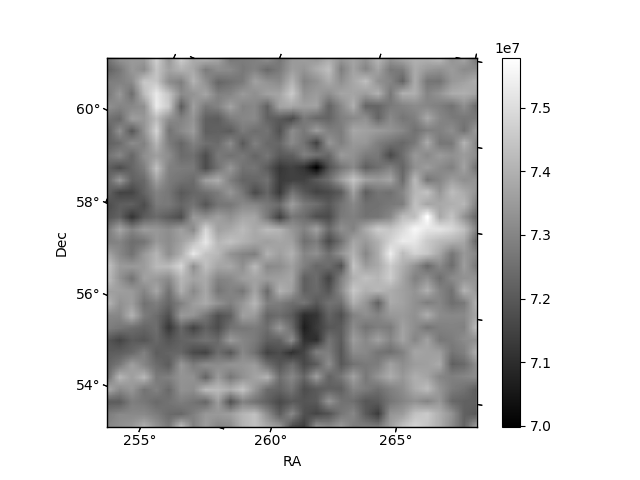
Quadrant B |
|---|---|---|---|
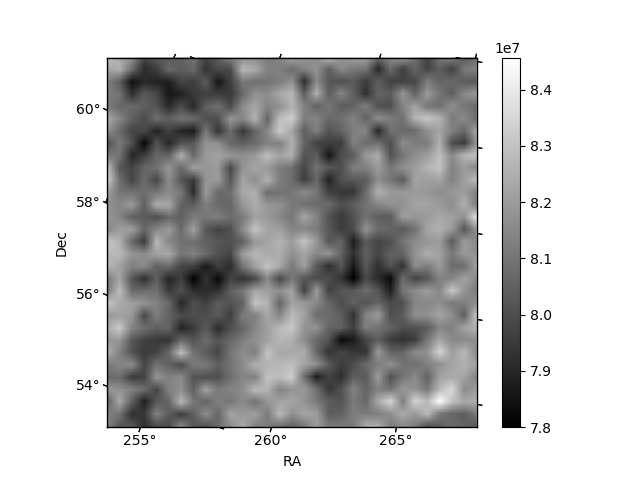
| Quadrant D | 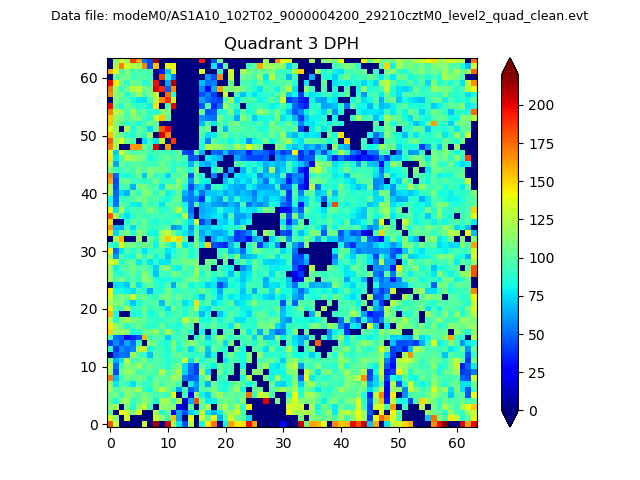 |
 |
Quadrant C |
| Plot type | Count rate plots | Images |
|---|---|---|
| Comparison with Poisson distribution Blue bars denote a histogram of data divided into 1 sec bins. Red curve is a Poisson curve with rate = median count rate of data. |
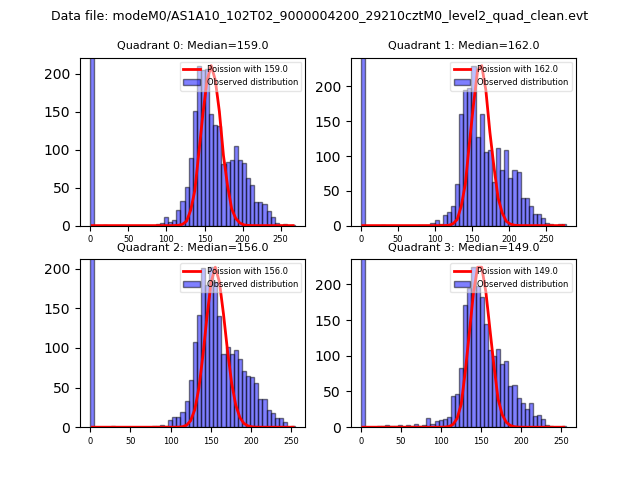 |
 |
| Quadrant-wise count rates Data is divided into 100 sec bins |
 |
|
| Module-wise count rates for Quadrant A Data is divided into 100 sec bins |
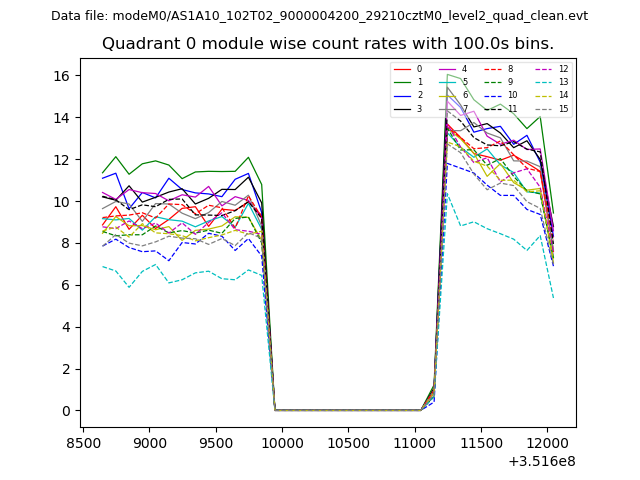 |
 |
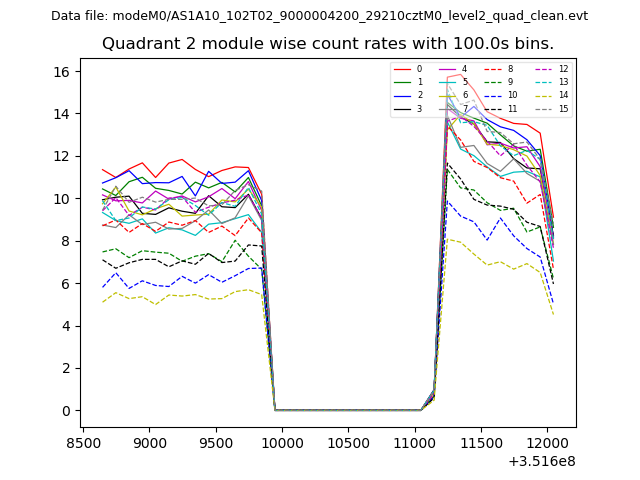
| Module-wise count rates for Quadrant B Data is divided into 100 sec bins |
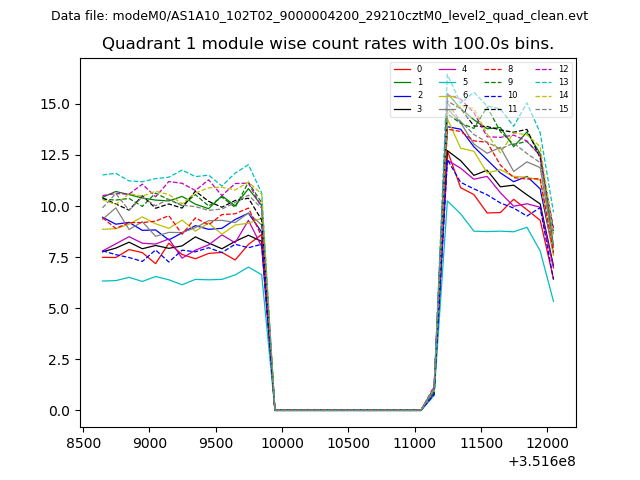 |
 |
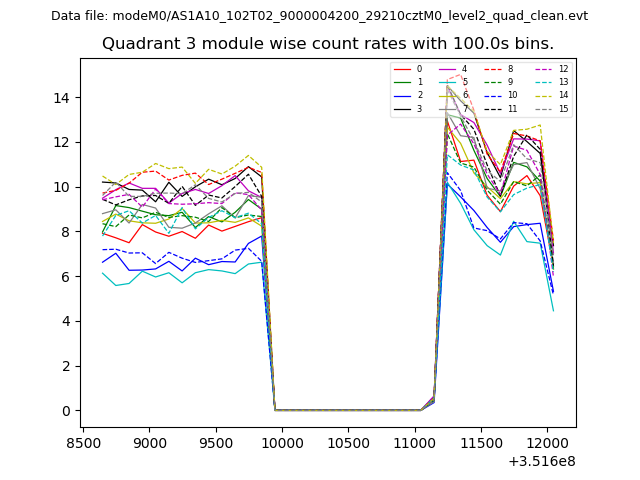
| Module-wise count rates for Quadrant C Data is divided into 100 sec bins |
 |
 |
| Module-wise count rates for Quadrant D Data is divided into 100 sec bins |
 |
 |
| Parameter | Plot |
|---|---|
| CZT HV Monitor | 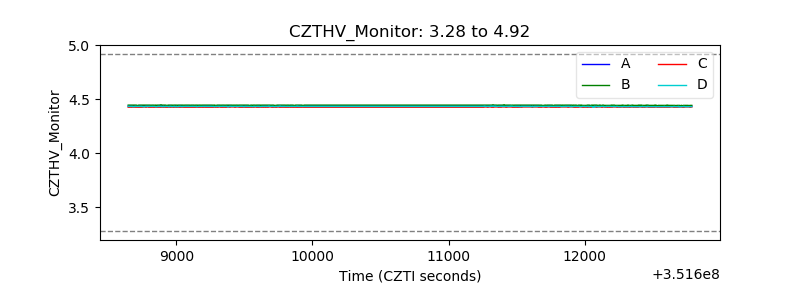 |
| D_VDD | 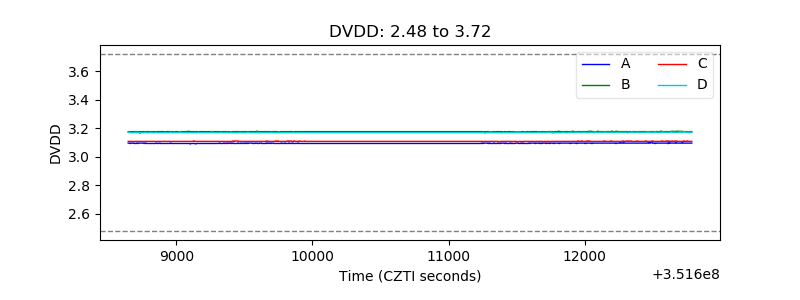 |
| Temperature 1 | 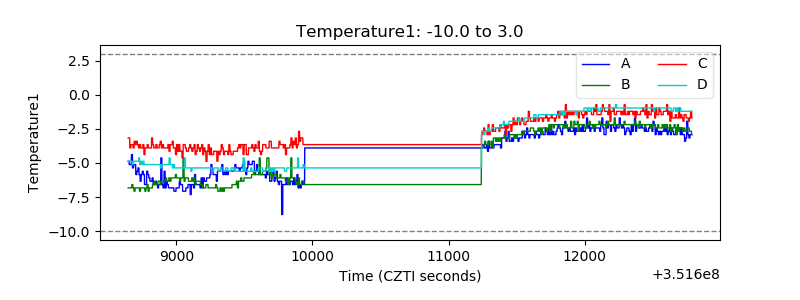 |
| Veto HV Monitor |  |
| Veto LLD | 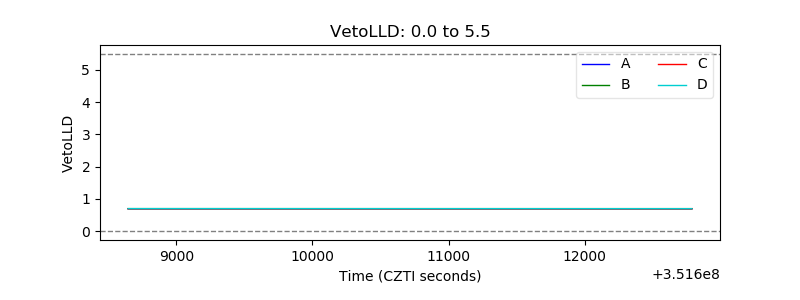 |
| Alpha Counter | 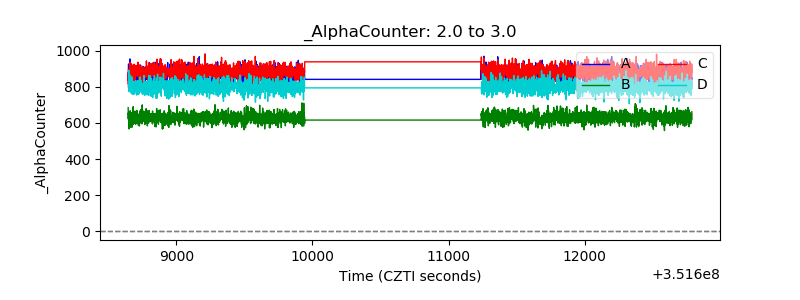 |
| _CPM_Rate | 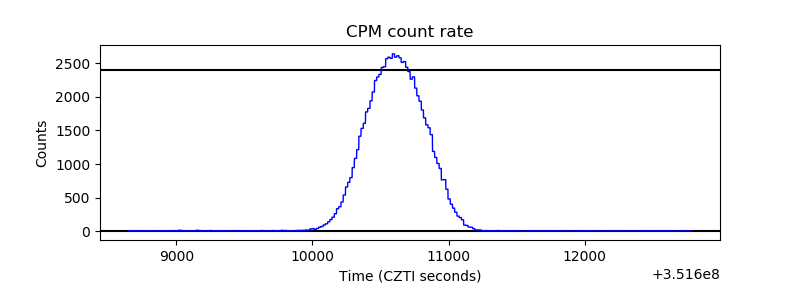 |
| CZT Counter | 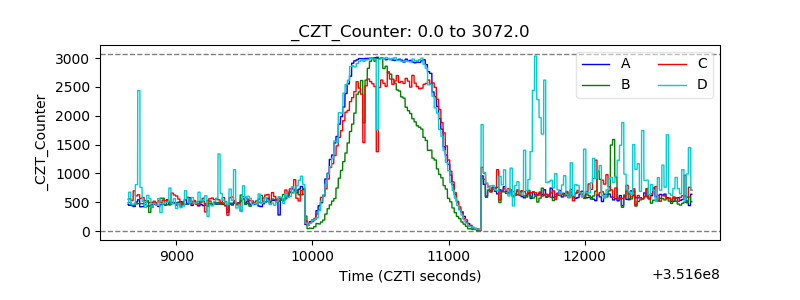 |
| +2.5 Volts monitor |  |
| +5 Volts monitor |  |
| _ROLL_ROT | 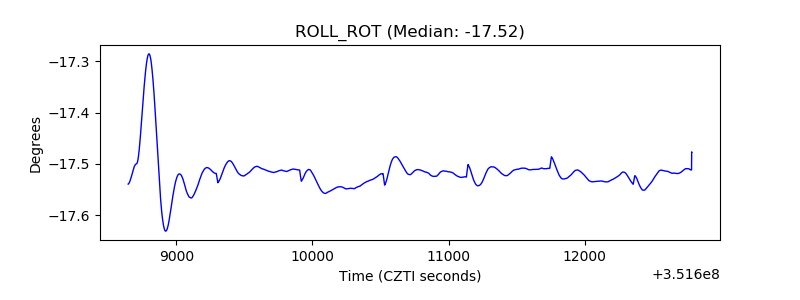 |
| _Roll_DEC | 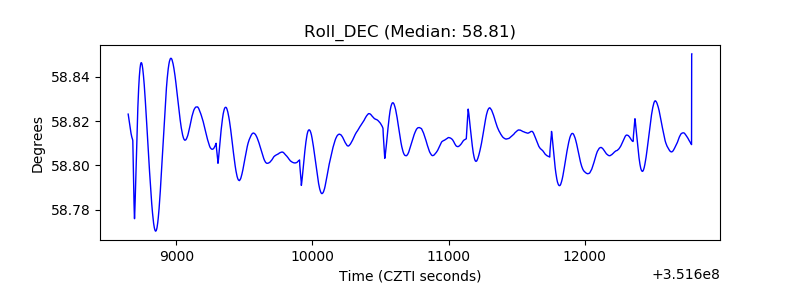 |
| _Roll_RA |  |
| Veto Counter | 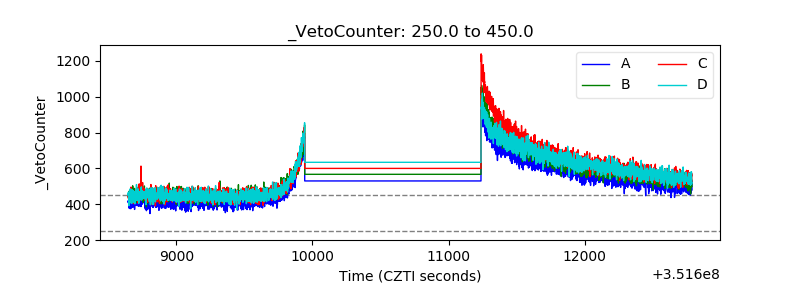 |