| Param | Original file | Final file |
|---|---|---|
| Filename | modeM0/AS1A10_094T10_9000004262_29555cztM0_level2.evt | modeM0/AS1A10_094T10_9000004262_29555cztM0_level2_quad_clean.evt |
| Size (bytes) | 454,380,480 | 70,153,920 |
| Size | 433.3 MB | 66.9 MB |
| Events in quadrant A | 2,183,065 | 467,921 |
| Events in quadrant B | 2,240,513 | 481,909 |
| Events in quadrant C | 2,344,504 | 446,980 |
| Events in quadrant D | 6,684,781 | 407,811 |
| Mode SS | |||
|---|---|---|---|
| Quadrant | BADHDUFLAG | Total packets | Discarded packets |
| A | 0 | 94 | 0 |
| B | 0 | 94 | 0 |
| C | 0 | 94 | 0 |
| D | 0 | 94 | 0 |
| Mode M0 | |||
|---|---|---|---|
| Quadrant | BADHDUFLAG | Total packets | Discarded packets |
| A | 0 | 9377 | 1 |
| B | 0 | 9563 | 1 |
| C | 0 | 9804 | 1 |
| D | 0 | 23084 | 1 |
| Mode M9 | |||
|---|---|---|---|
| Quadrant | BADHDUFLAG | Total packets | Discarded packets |
| A | 0 | 11 | 0 |
| B | 0 | 11 | 0 |
| C | 0 | 11 | 0 |
| D | 0 | 11 | 0 |
| Quadrant | Total seconds | Saturated seconds | Saturation percentage |
|---|---|---|---|
| A | 4541 | 8 | 0.176173% |
| B | 4541 | 17 | 0.374367% |
| C | 4541 | 192 | 4.228144% |
| D | 4541 | 447 | 9.843647% |
Noise dominated data is calculated using 1-second bins in cleaned event files. If a bin has >2000 counts, and if more than 50% of those come from <1% of pixels, then it is considered to be noise-dominated and hence unusable.
| Quadrant | # 1 sec bins | Bins with >0 counts | Bins with >2000 counts | High rate bins dominated by noise | Noise dominated (total time) | Noise dominated (detector-on time) | Marked lightcurve |
|---|---|---|---|---|---|---|---|
| A | 5676 | 4542 | 0 | 0 | 0.00% | 0.00% | 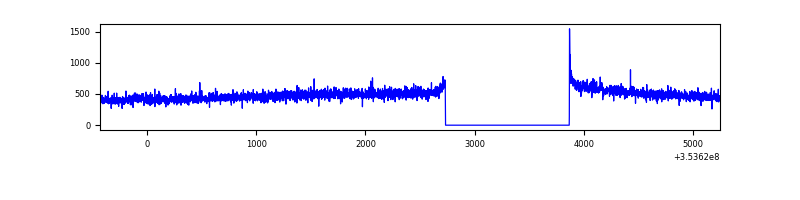 |
| B | 5676 | 4542 | 2 | 2 | 0.04% | 0.04% | 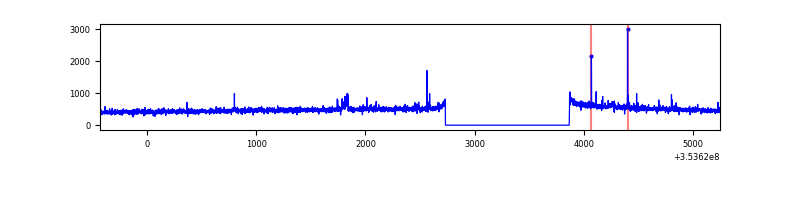 |
| C | 5676 | 4542 | 0 | 0 | 0.00% | 0.00% | 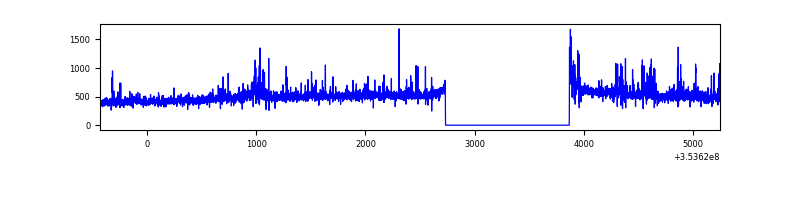 |
| D | 5676 | 4542 | 434 | 434 | 7.65% | 9.56% | 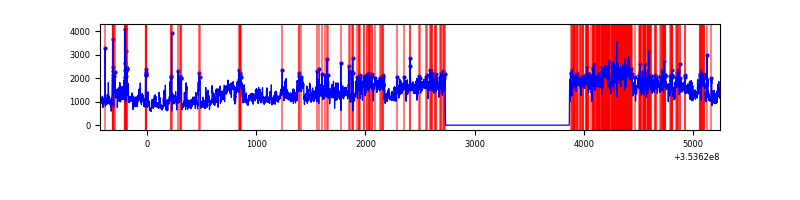 |
Top three noisy pixels from each quadrant. If the there are fewer than three noisy pixels in the level2.evt file, extra rows are filled as -1
| Pixel properties | Quadrant properties | ||||||
|---|---|---|---|---|---|---|---|
| Quadrant | DetID | PixID | Counts | Sigma | Mean | Median | Sigma |
| A | 0 | 13 | 14848 | 125.85 | 559 | 547 | 113.6 |
| A | 13 | 254 | 9228 | 76.4 | 559 | 547 | 113.6 |
| A | 3 | 137 | 5594 | 44.42 | 559 | 547 | 113.6 |
| B | 0 | 230 | 14718 | 133.42 | 559 | 545 | 106.2 |
| B | 12 | 111 | 12665 | 114.09 | 559 | 545 | 106.2 |
| B | 11 | 111 | 11482 | 102.96 | 559 | 545 | 106.2 |
| C | 14 | 238 | 137394 | 1105.2 | 528 | 532 | 123.8 |
| C | 14 | 254 | 70759 | 567.1 | 528 | 532 | 123.8 |
| C | 3 | 233 | 57250 | 458.02 | 528 | 532 | 123.8 |
| D | 8 | 195 | 4453722 | 35697.83 | 525 | 511 | 124.7 |
| D | 13 | 153 | 68189 | 542.52 | 525 | 511 | 124.7 |
| D | 2 | 250 | 48581 | 385.34 | 525 | 511 | 124.7 |
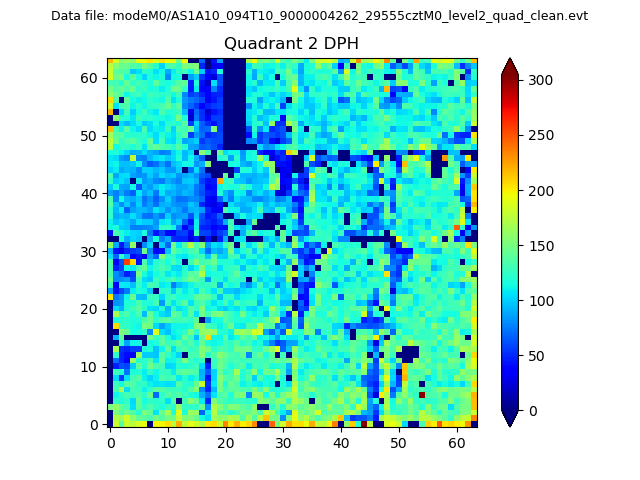
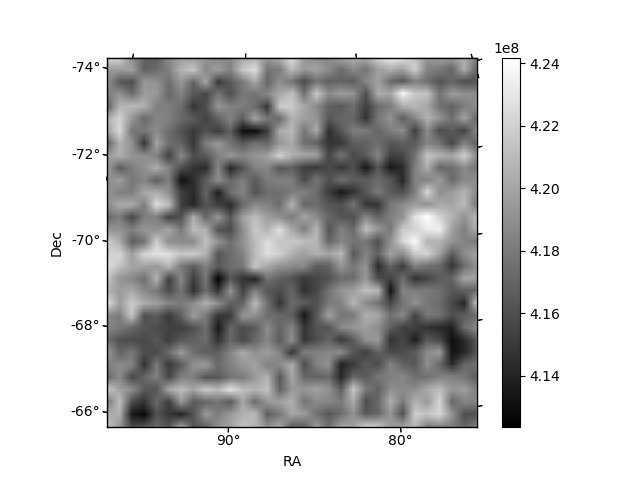
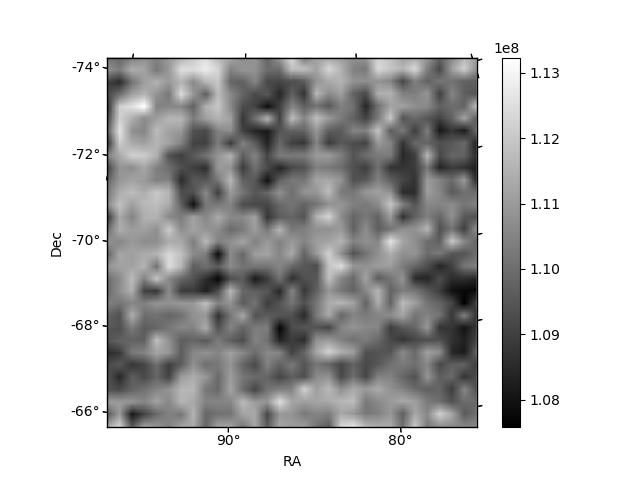
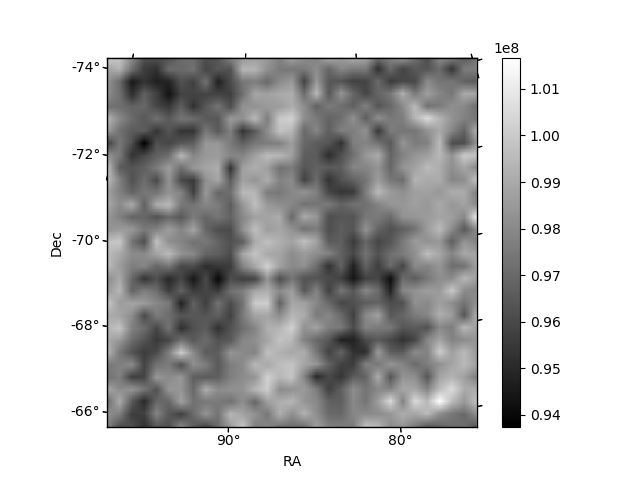
Histogram calculated using DETX and DETY for each event in the final _common_clean file
| Quadrant A | 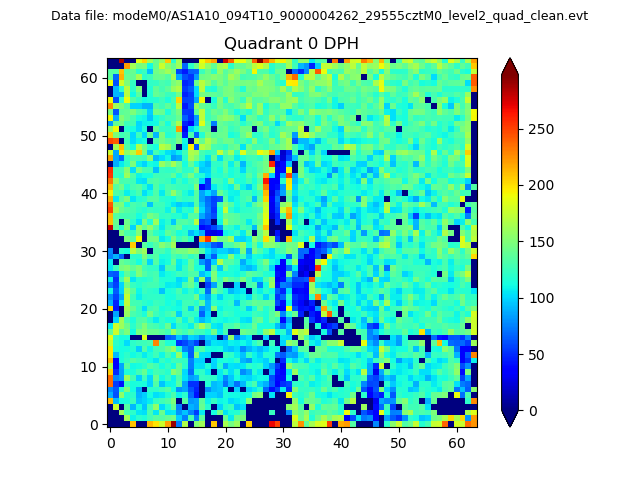 |
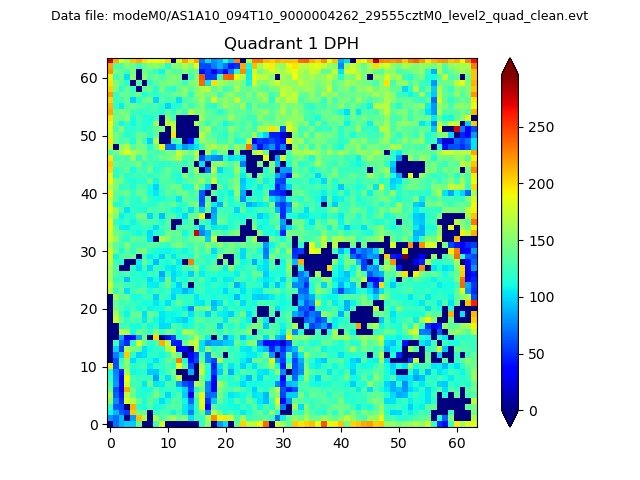 |
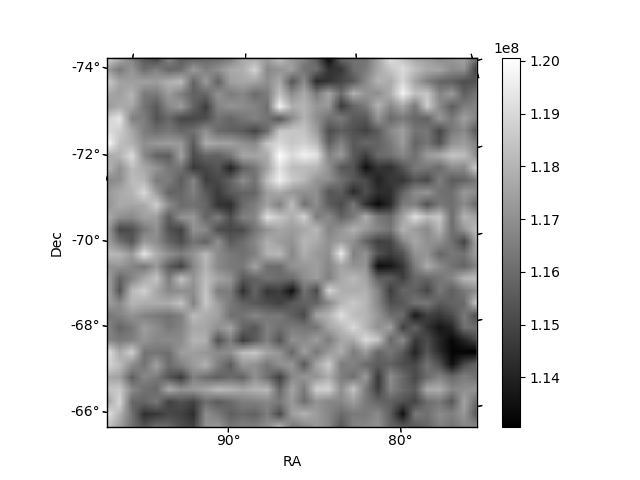
Quadrant B |
|---|---|---|---|
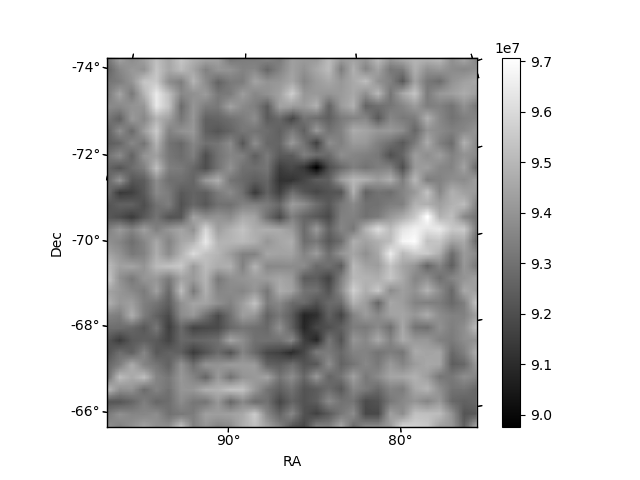
| Quadrant D | 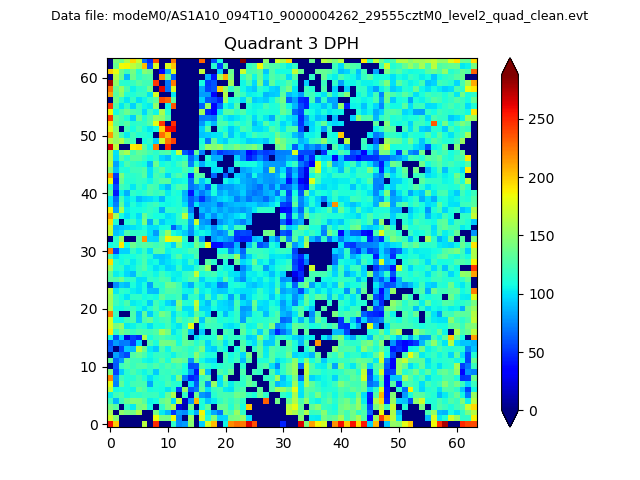 |
 |
Quadrant C |
| Plot type | Count rate plots | Images |
|---|---|---|
| Comparison with Poisson distribution Blue bars denote a histogram of data divided into 1 sec bins. Red curve is a Poisson curve with rate = median count rate of data. |
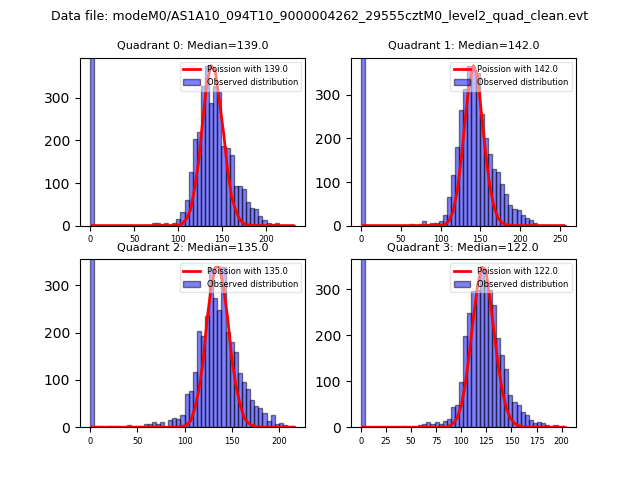 |
 |
| Quadrant-wise count rates Data is divided into 100 sec bins |
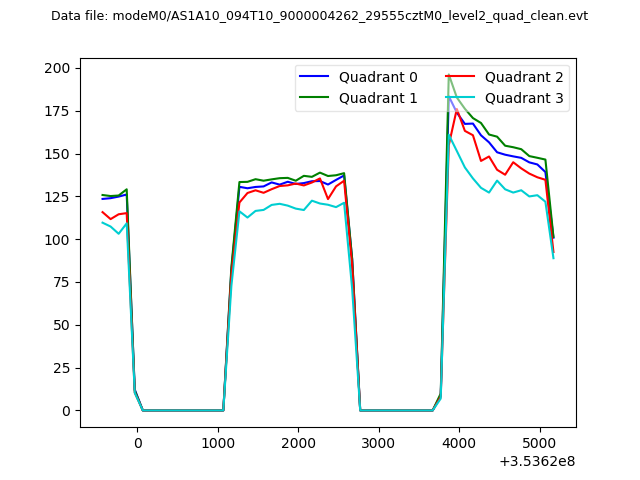 |
|
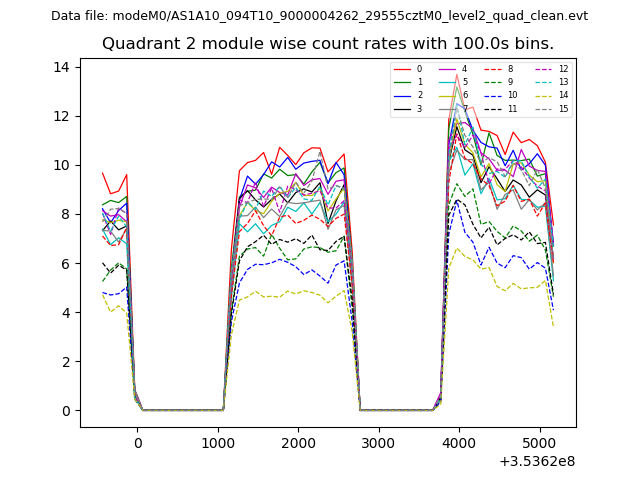
| Module-wise count rates for Quadrant A Data is divided into 100 sec bins |
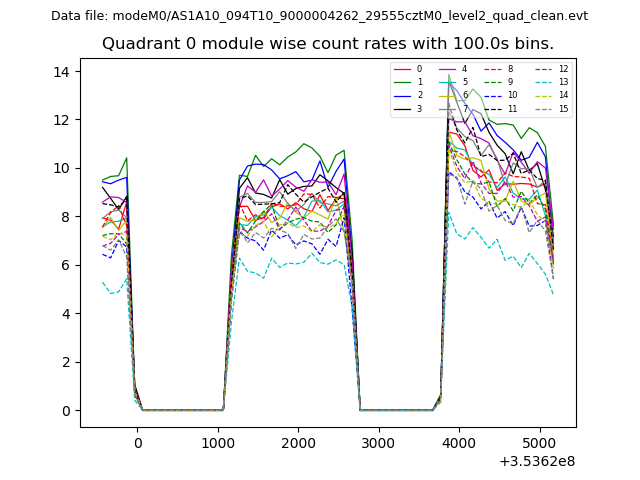 |
 |
| Module-wise count rates for Quadrant B Data is divided into 100 sec bins |
 |
 |
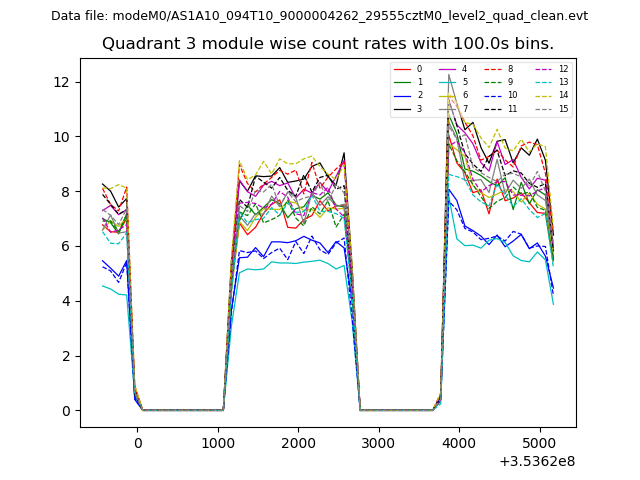
| Module-wise count rates for Quadrant C Data is divided into 100 sec bins |
 |
 |
| Module-wise count rates for Quadrant D Data is divided into 100 sec bins |
 |
 |
| Parameter | Plot |
|---|---|
| CZT HV Monitor | 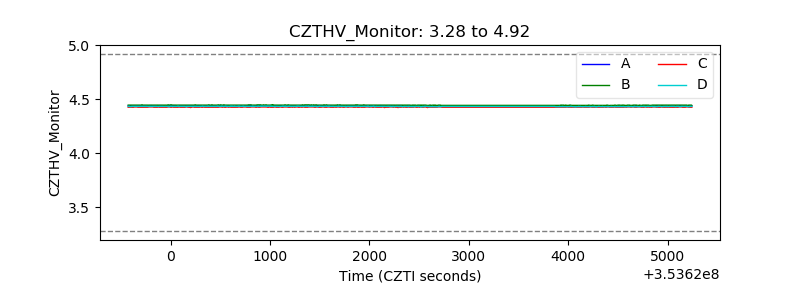 |
| D_VDD | 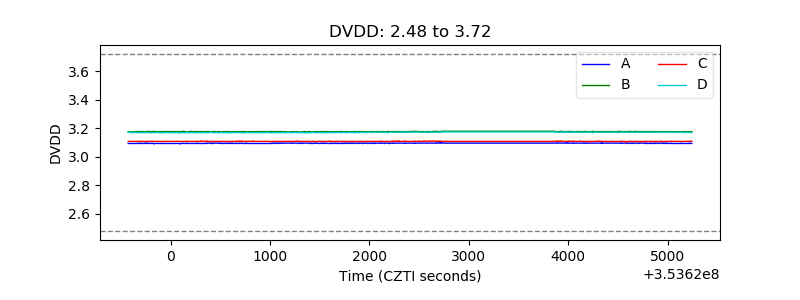 |
| Temperature 1 |  |
| Veto HV Monitor | 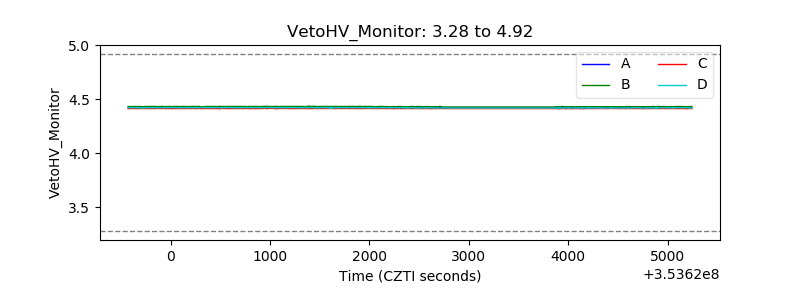 |
| Veto LLD | 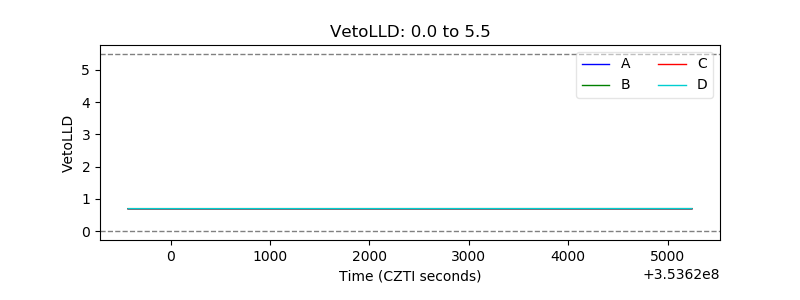 |
| Alpha Counter | 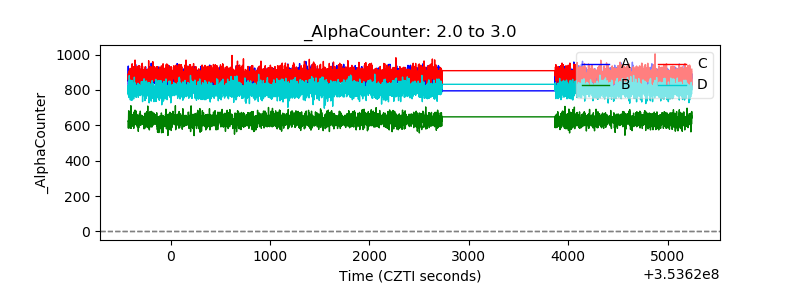 |
| _CPM_Rate | 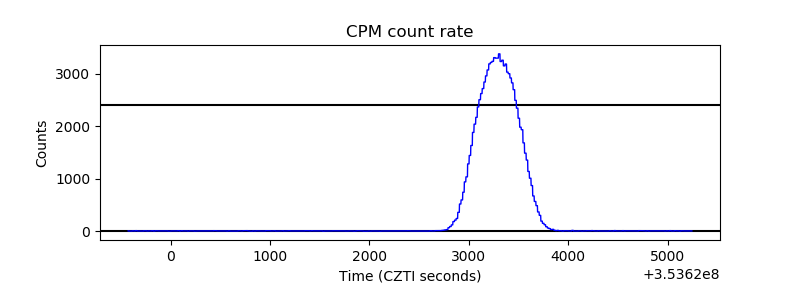 |
| CZT Counter | 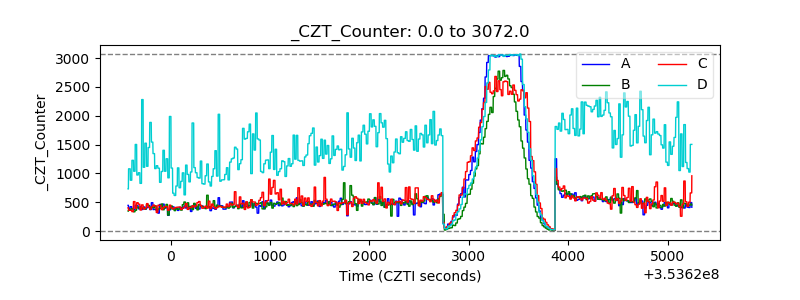 |
| +2.5 Volts monitor |  |
| +5 Volts monitor |  |
| _ROLL_ROT |  |
| _Roll_DEC | 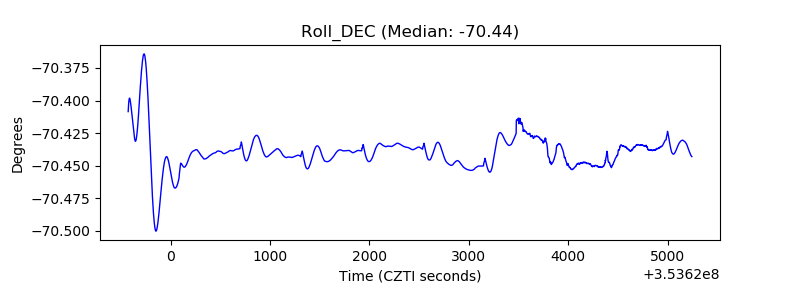 |
| _Roll_RA | 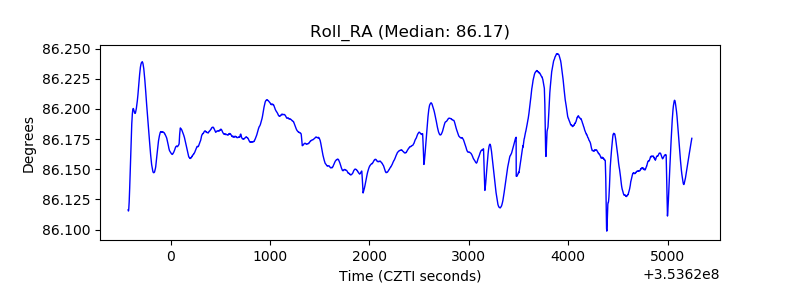 |
| Veto Counter | 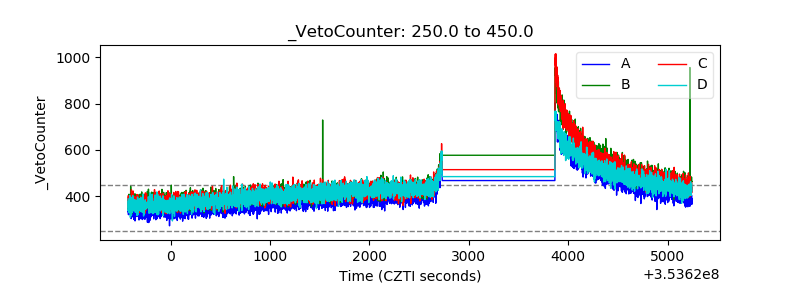 |