| Param | Original file | Final file |
|---|---|---|
| Filename | modeM0/AS1A10_093T01_9000004274_29685cztM0_level2.evt | modeM0/AS1A10_093T01_9000004274_29685cztM0_level2_quad_clean.evt |
| Size (bytes) | 489,432,960 | 82,756,800 |
| Size | 466.8 MB | 78.9 MB |
| Events in quadrant A | 2,824,318 | 548,882 |
| Events in quadrant B | 3,098,397 | 553,736 |
| Events in quadrant C | 3,117,544 | 507,098 |
| Events in quadrant D | 5,385,630 | 487,709 |
| Mode SS | |||
|---|---|---|---|
| Quadrant | BADHDUFLAG | Total packets | Discarded packets |
| A | 0 | 118 | 0 |
| B | 0 | 118 | 0 |
| C | 0 | 118 | 0 |
| D | 0 | 118 | 0 |
| Mode M9 | |||
|---|---|---|---|
| Quadrant | BADHDUFLAG | Total packets | Discarded packets |
| A | 0 | 11 | 0 |
| B | 0 | 11 | 0 |
| C | 0 | 11 | 0 |
| D | 0 | 11 | 0 |
| Mode M0 | |||
|---|---|---|---|
| Quadrant | BADHDUFLAG | Total packets | Discarded packets |
| A | 0 | 12382 | 1 |
| B | 0 | 13075 | 1 |
| C | 0 | 13114 | 1 |
| D | 0 | 20061 | 1 |
| Quadrant | Total seconds | Saturated seconds | Saturation percentage |
|---|---|---|---|
| A | 5846 | 48 | 0.821074% |
| B | 5847 | 113 | 1.932615% |
| C | 5847 | 322 | 5.507098% |
| D | 5847 | 492 | 8.414572% |
Noise dominated data is calculated using 1-second bins in cleaned event files. If a bin has >2000 counts, and if more than 50% of those come from <1% of pixels, then it is considered to be noise-dominated and hence unusable.
| Quadrant | # 1 sec bins | Bins with >0 counts | Bins with >2000 counts | High rate bins dominated by noise | Noise dominated (total time) | Noise dominated (detector-on time) | Marked lightcurve |
|---|---|---|---|---|---|---|---|
| A | 6926 | 5846 | 0 | 0 | 0.00% | 0.00% | 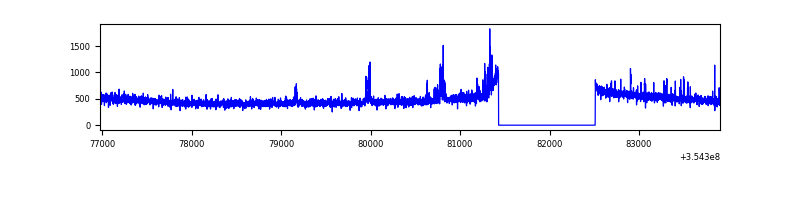 |
| B | 6927 | 5847 | 52 | 52 | 0.75% | 0.89% | 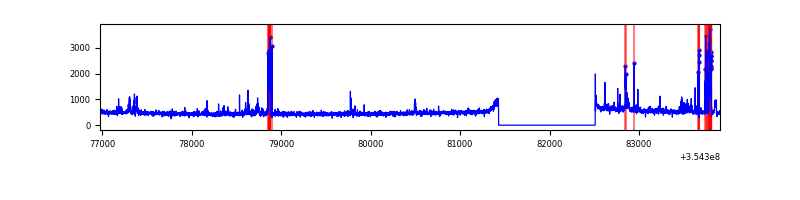 |
| C | 6927 | 5847 | 0 | 0 | 0.00% | 0.00% | 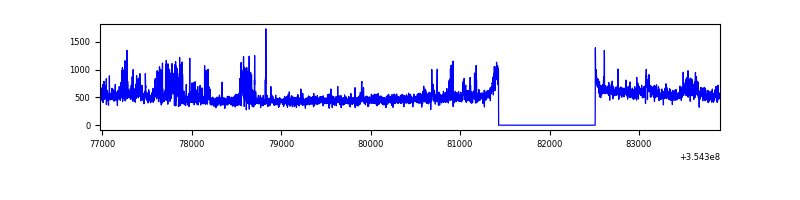 |
| D | 6927 | 5847 | 405 | 405 | 5.85% | 6.93% | 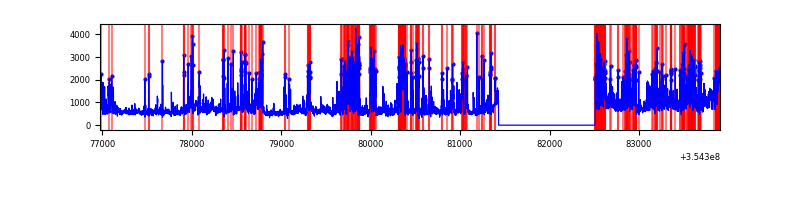 |
Top three noisy pixels from each quadrant. If the there are fewer than three noisy pixels in the level2.evt file, extra rows are filled as -1
| Pixel properties | Quadrant properties | ||||||
|---|---|---|---|---|---|---|---|
| Quadrant | DetID | PixID | Counts | Sigma | Mean | Median | Sigma |
| A | 12 | 16 | 65818 | 456.56 | 708 | 693 | 142.6 |
| A | 12 | 194 | 15368 | 102.88 | 708 | 693 | 142.6 |
| A | 11 | 29 | 12269 | 81.15 | 708 | 693 | 142.6 |
| B | 0 | 229 | 242428 | 1811.49 | 703 | 685 | 133.5 |
| B | 15 | 32 | 28616 | 209.3 | 703 | 685 | 133.5 |
| B | 4 | 171 | 24599 | 179.2 | 703 | 685 | 133.5 |
| C | 14 | 238 | 203304 | 1299.33 | 672 | 677 | 155.9 |
| C | 14 | 254 | 133020 | 848.64 | 672 | 677 | 155.9 |
| C | 3 | 233 | 127220 | 811.44 | 672 | 677 | 155.9 |
| D | 7 | 80 | 1766960 | 11109.86 | 669 | 653 | 159.0 |
| D | 8 | 195 | 558388 | 3508.09 | 669 | 653 | 159.0 |
| D | 13 | 104 | 208501 | 1307.34 | 669 | 653 | 159.0 |
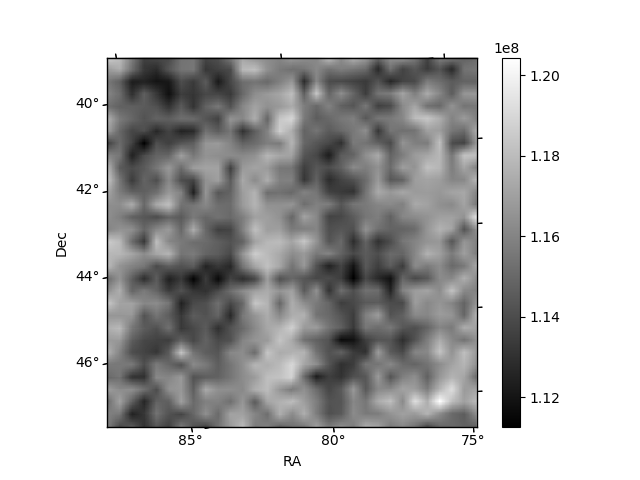
Histogram calculated using DETX and DETY for each event in the final _common_clean file
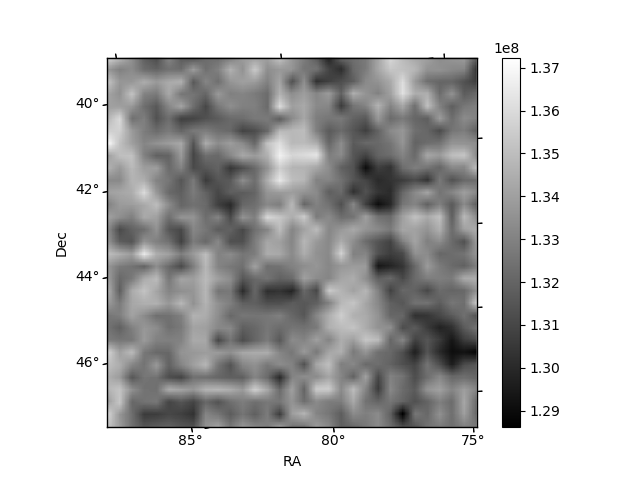
| Quadrant A | 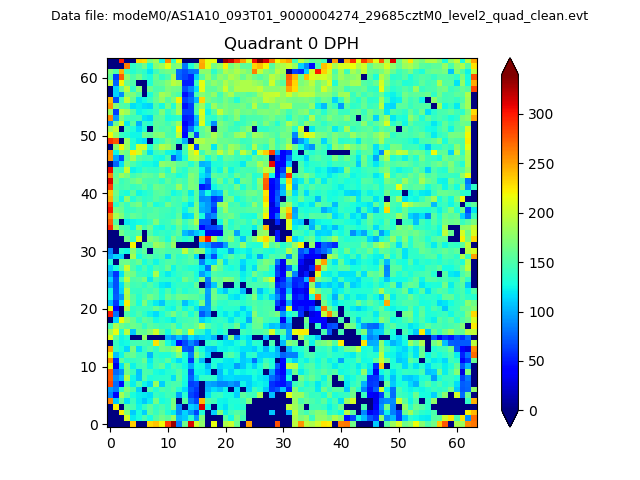 |
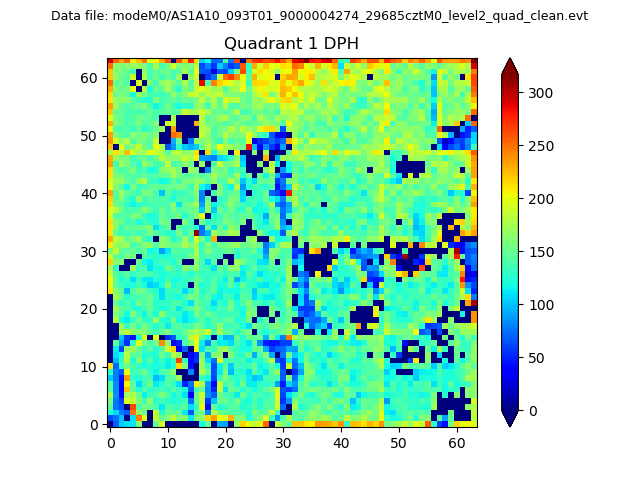 |
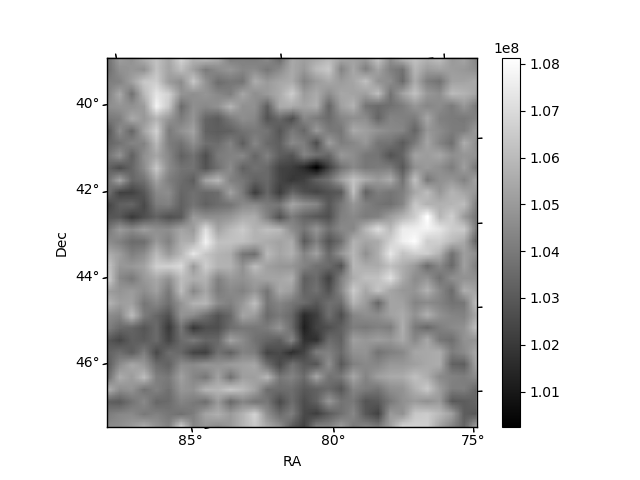
Quadrant B |
|---|---|---|---|
| Quadrant D | 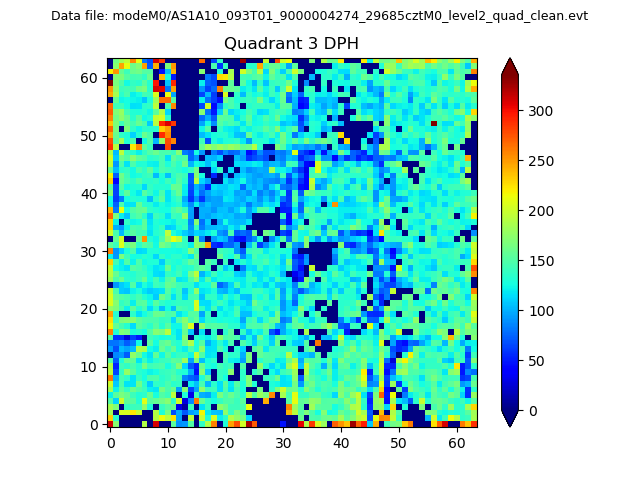 |
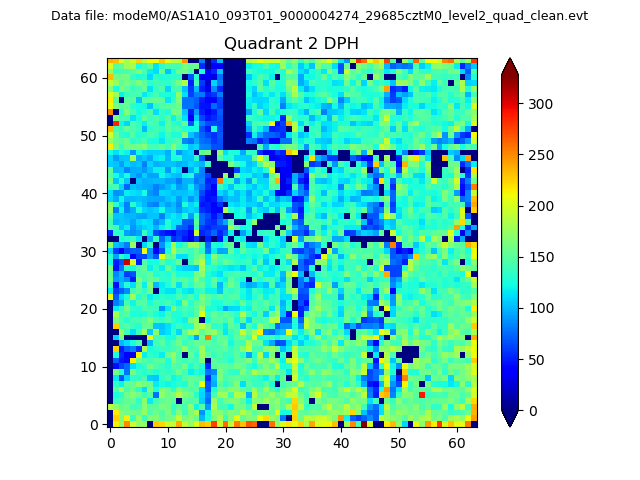 |
Quadrant C |
| Plot type | Count rate plots | Images |
|---|---|---|
| Comparison with Poisson distribution Blue bars denote a histogram of data divided into 1 sec bins. Red curve is a Poisson curve with rate = median count rate of data. |
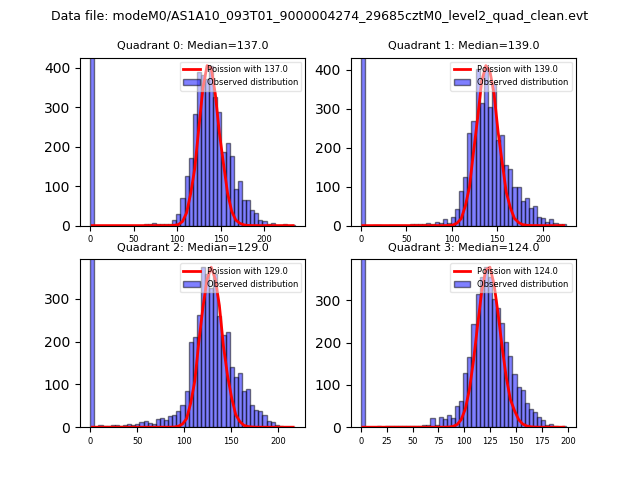 |
 |
| Quadrant-wise count rates Data is divided into 100 sec bins |
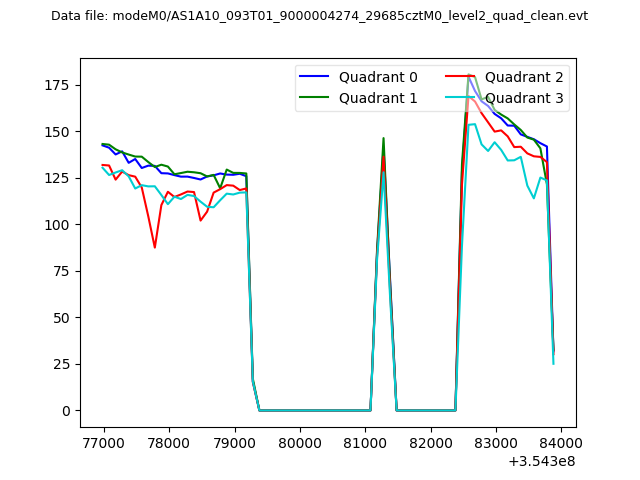 |
|
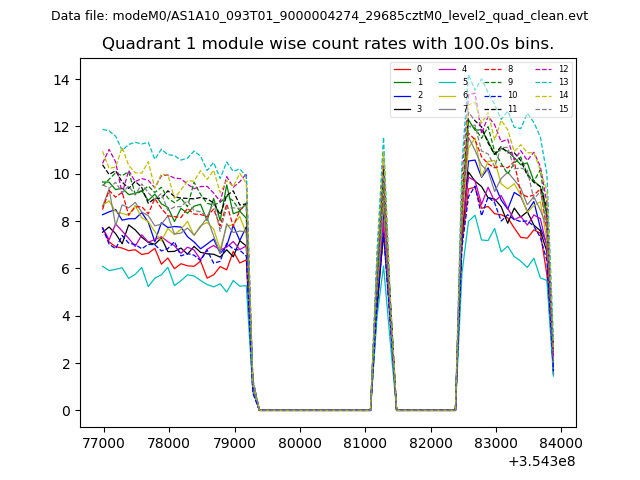
| Module-wise count rates for Quadrant A Data is divided into 100 sec bins |
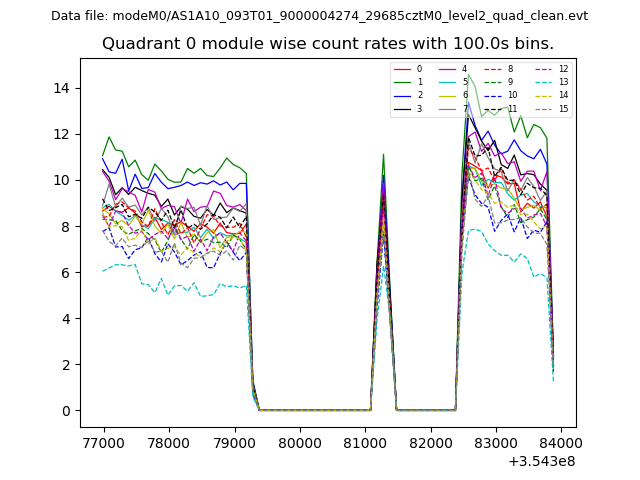 |
 |
| Module-wise count rates for Quadrant B Data is divided into 100 sec bins |
 |
 |
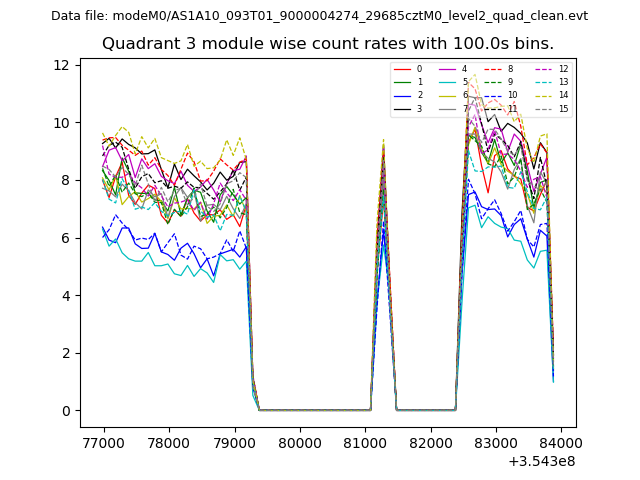
| Module-wise count rates for Quadrant C Data is divided into 100 sec bins |
 |
 |
| Module-wise count rates for Quadrant D Data is divided into 100 sec bins |
 |
 |
| Parameter | Plot |
|---|---|
| CZT HV Monitor |  |
| D_VDD | 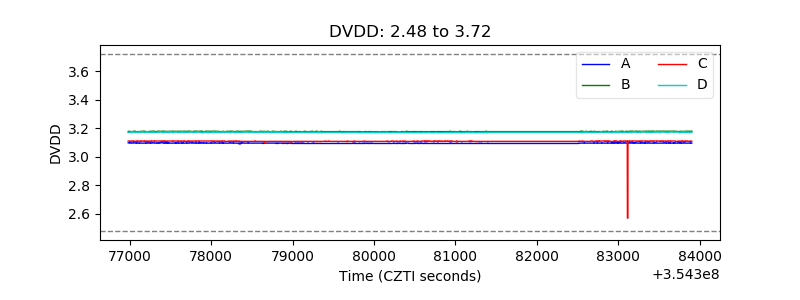 |
| Temperature 1 | 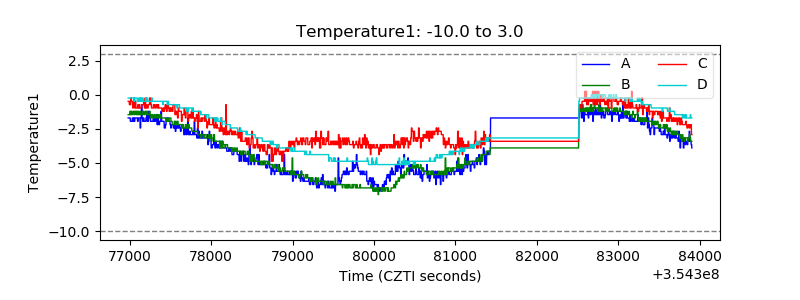 |
| Veto HV Monitor | 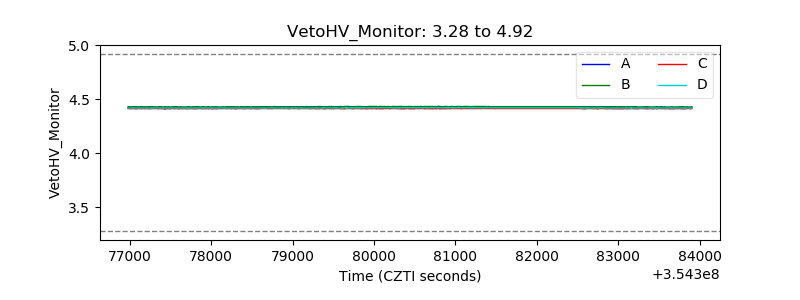 |
| Veto LLD | 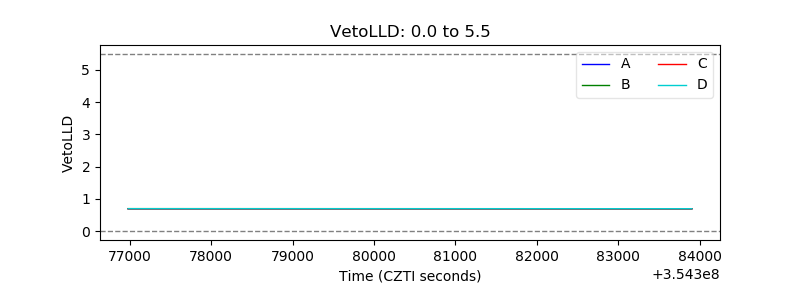 |
| Alpha Counter | 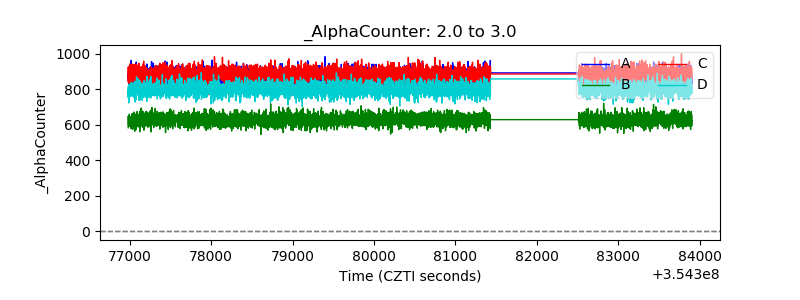 |
| _CPM_Rate | 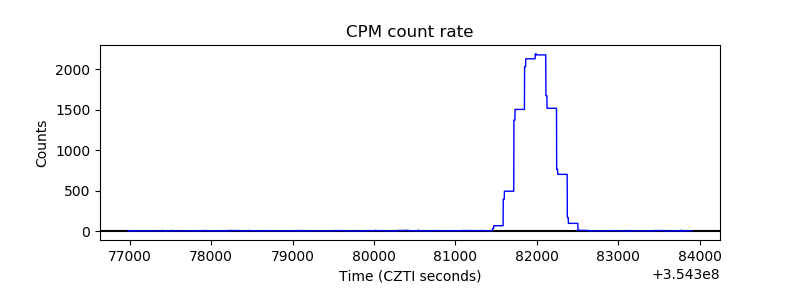 |
| CZT Counter |  |
| +2.5 Volts monitor | 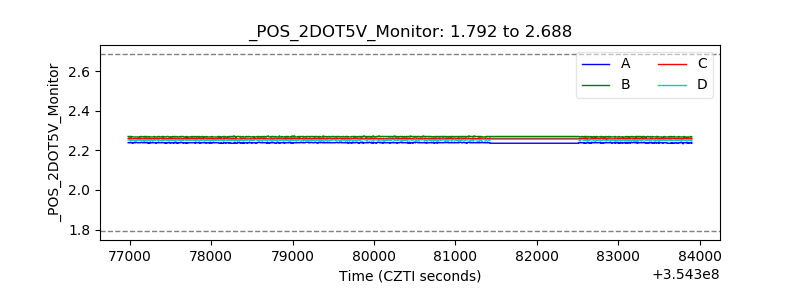 |
| +5 Volts monitor | 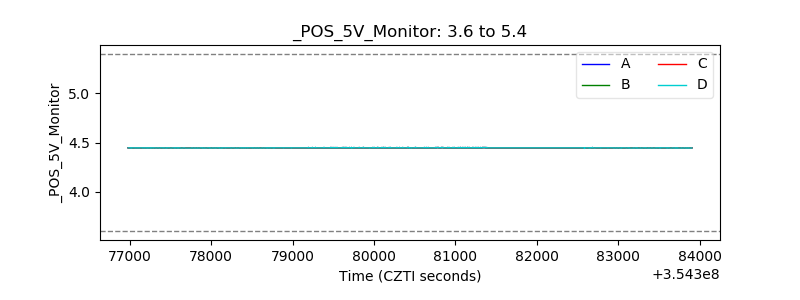 |
| _ROLL_ROT | 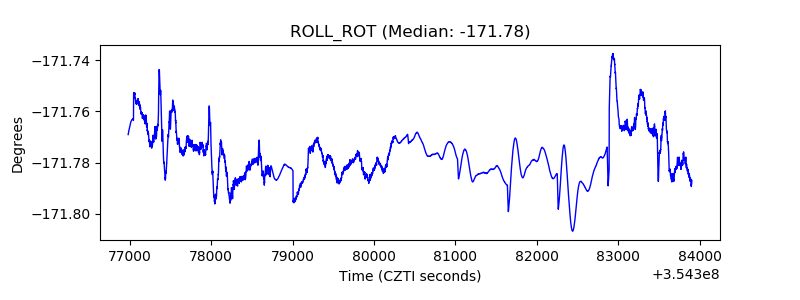 |
| _Roll_DEC | 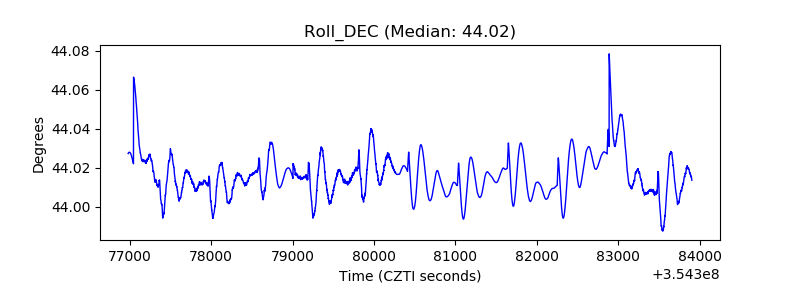 |
| _Roll_RA |  |
| Veto Counter | 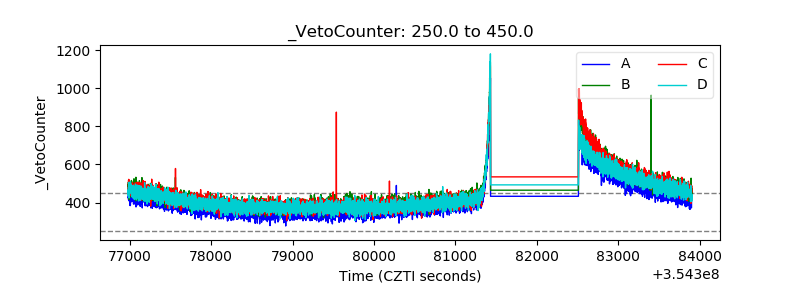 |