| Param | Original file | Final file |
|---|---|---|
| Filename | modeM0/AS1A10_102T04_9000004286cztM0_level2.fits | modeM0/AS1A10_102T04_9000004286cztM0_level2_quad_clean.evt |
| Size (bytes) | 144,492,480 | 116,254,080 |
| Size | 137.8 MB | 110.9 MB |
| Events in quadrant A | 891,620 | 651,897 |
| Events in quadrant B | 840,452 | 648,695 |
| Events in quadrant C | 849,278 | 624,871 |
| Events in quadrant D | 753,174 | 552,981 |
| Mode SS | |||
|---|---|---|---|
| Quadrant | BADHDUFLAG | Total packets | Discarded packets |
| A | 0 | 304 | 0 |
| B | 0 | 304 | 0 |
| C | 0 | 304 | 0 |
| D | 0 | 304 | 0 |
| Mode M9 | |||
|---|---|---|---|
| Quadrant | BADHDUFLAG | Total packets | Discarded packets |
| A | 0 | 19 | 0 |
| B | 0 | 19 | 0 |
| C | 0 | 19 | 0 |
| D | 0 | 19 | 0 |
| Mode M0 | |||
|---|---|---|---|
| Quadrant | BADHDUFLAG | Total packets | Discarded packets |
| A | 0 | 30789 | 0 |
| B | 0 | 45419 | 0 |
| C | 0 | 43001 | 0 |
| D | 0 | 40111 | 0 |
| Quadrant | Total seconds | Saturated seconds | Saturation percentage |
|---|---|---|---|
| A | 15102 | 119 | 0.787975% |
| B | 15102 | 200 | 1.324328% |
| C | 15102 | 487 | 3.224738% |
| D | 15102 | 616 | 4.078930% |
Noise dominated data is calculated using 1-second bins in cleaned event files. If a bin has >2000 counts, and if more than 50% of those come from <1% of pixels, then it is considered to be noise-dominated and hence unusable.
| Quadrant | # 1 sec bins | Bins with >0 counts | Bins with >2000 counts | High rate bins dominated by noise | Noise dominated (total time) | Noise dominated (detector-on time) | Marked lightcurve |
|---|---|---|---|---|---|---|---|
| A | 16397 | 15102 | 0 | 0 | 0.00% | 0.00% | 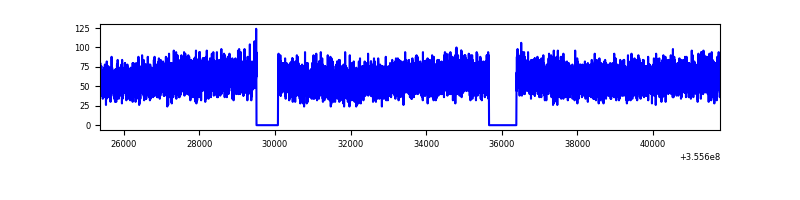 |
| B | 16397 | 15102 | 0 | 0 | 0.00% | 0.00% | 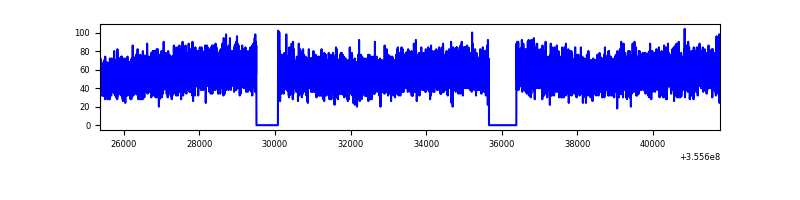 |
| C | 16397 | 15102 | 0 | 0 | 0.00% | 0.00% | 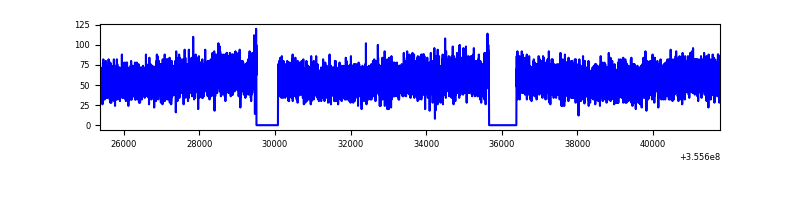 |
| D | 16397 | 15098 | 0 | 0 | 0.00% | 0.00% | 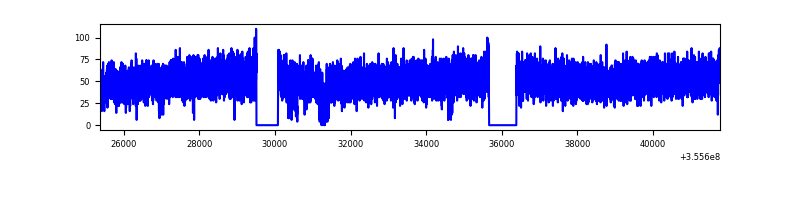 |
Top three noisy pixels from each quadrant. If the there are fewer than three noisy pixels in the level2.evt file, extra rows are filled as -1
| Pixel properties | Quadrant properties | ||||||
|---|---|---|---|---|---|---|---|
| Quadrant | DetID | PixID | Counts | Sigma | Mean | Median | Sigma |
| A | 0 | 29 | 748 | 8.89 | 232 | 217 | 59.7 |
| A | 15 | 236 | 693 | 7.97 | 232 | 217 | 59.7 |
| A | 7 | 110 | 681 | 7.77 | 232 | 217 | 59.7 |
| B | 2 | 9 | 678 | 10.02 | 221 | 210 | 46.7 |
| B | 3 | 17 | 561 | 7.52 | 221 | 210 | 46.7 |
| B | 14 | 254 | 555 | 7.39 | 221 | 210 | 46.7 |
| C | 1 | 80 | 674 | 7.9 | 224 | 209 | 58.8 |
| C | 1 | 81 | 653 | 7.55 | 224 | 209 | 58.8 |
| C | 12 | 241 | 630 | 7.16 | 224 | 209 | 58.8 |
| D | 4 | 246 | 556 | 6.17 | 214 | 195 | 58.5 |
| D | 15 | 46 | 532 | 5.76 | 214 | 195 | 58.5 |
| D | 7 | 3 | 524 | 5.63 | 214 | 195 | 58.5 |
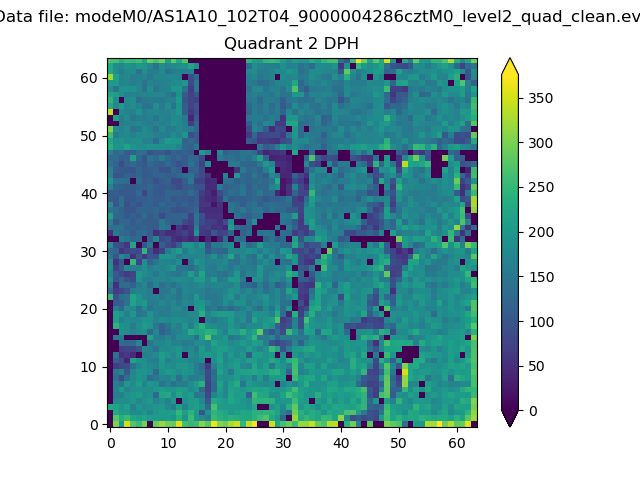
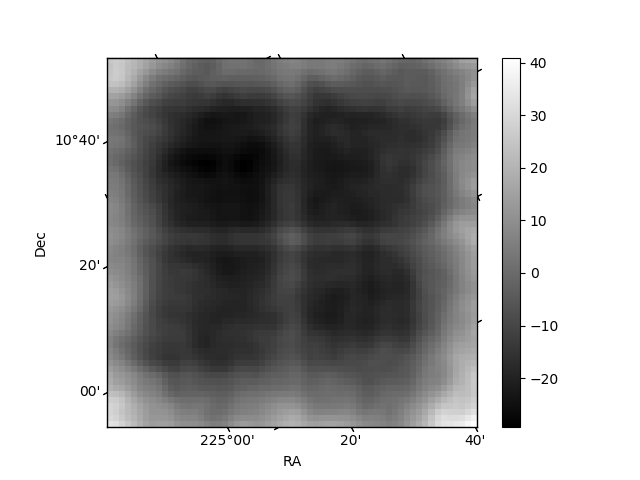
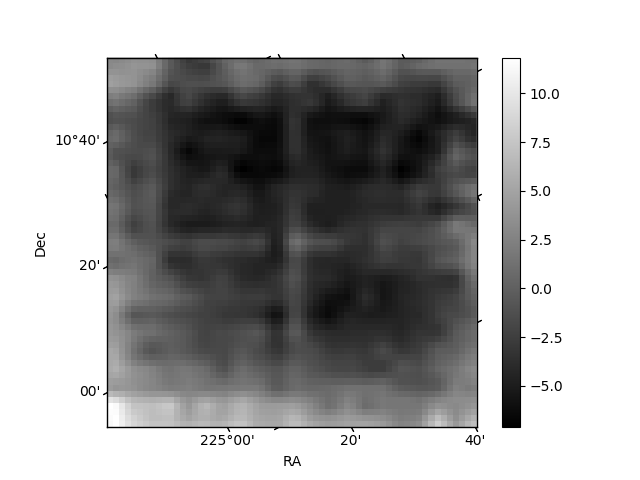
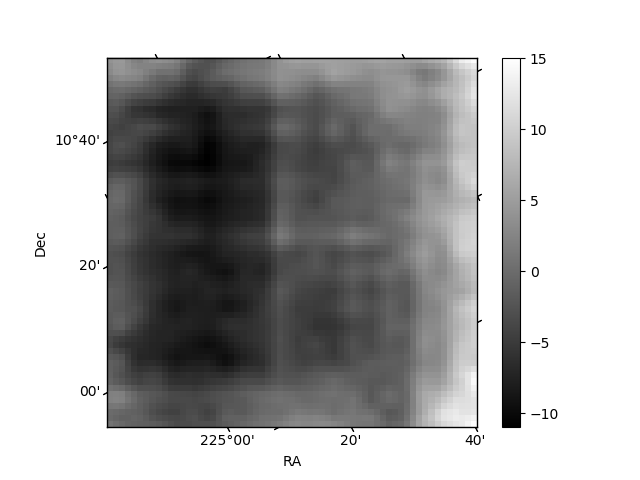
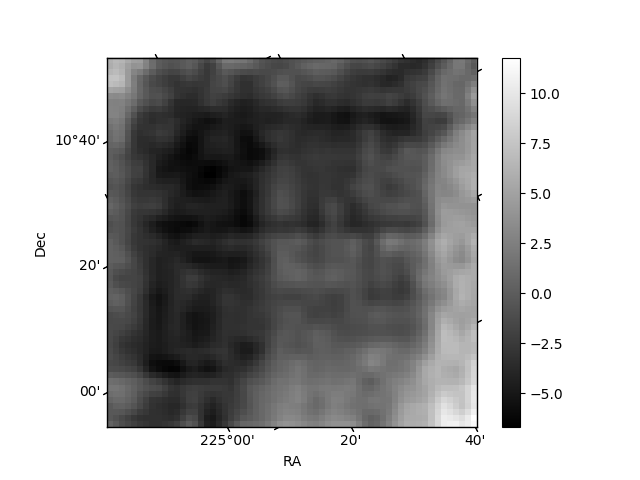
Histogram calculated using DETX and DETY for each event in the final _common_clean file
| Quadrant A | 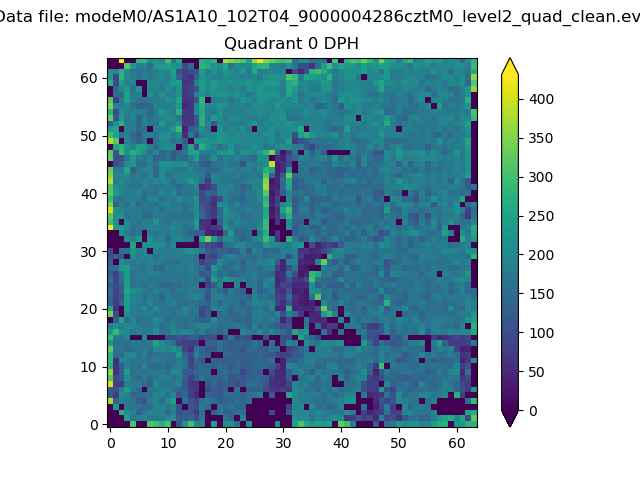 |
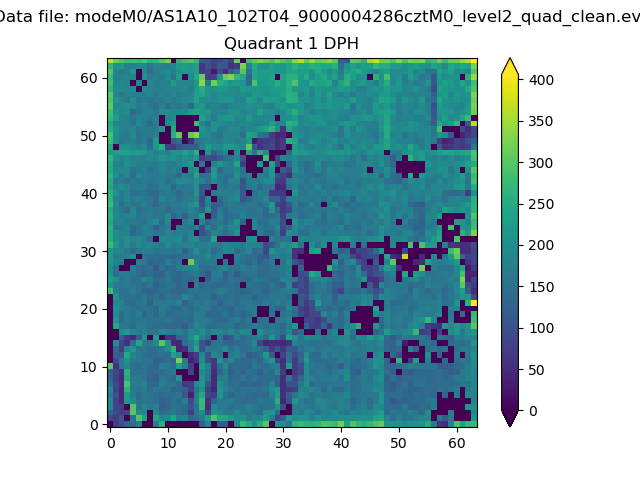 |
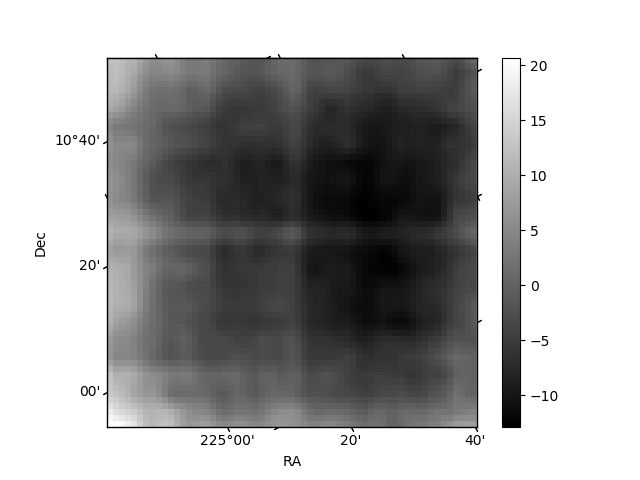
Quadrant B |
|---|---|---|---|
| Quadrant D | 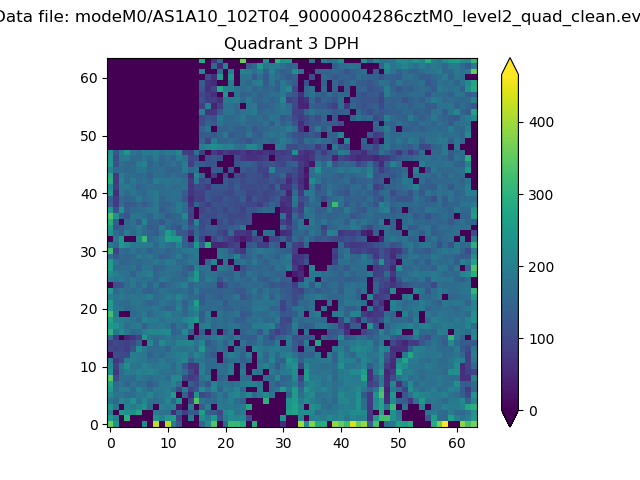 |
 |
Quadrant C |
| Plot type | Count rate plots | Images |
|---|---|---|
| Comparison with Poisson distribution Blue bars denote a histogram of data divided into 1 sec bins. Red curve is a Poisson curve with rate = median count rate of data. |
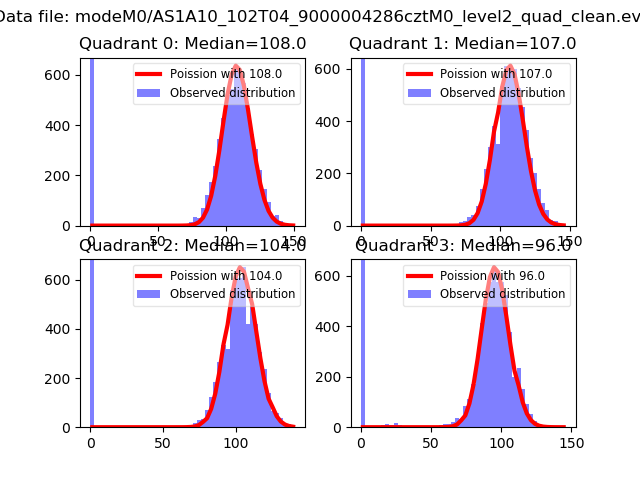 |
 |
| Quadrant-wise count rates Data is divided into 100 sec bins |
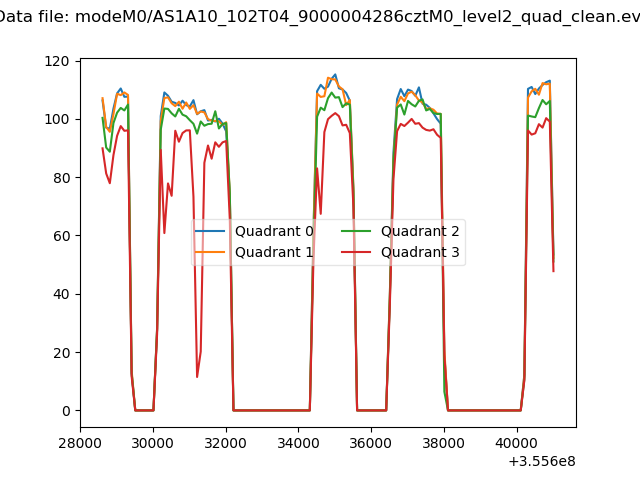 |
|
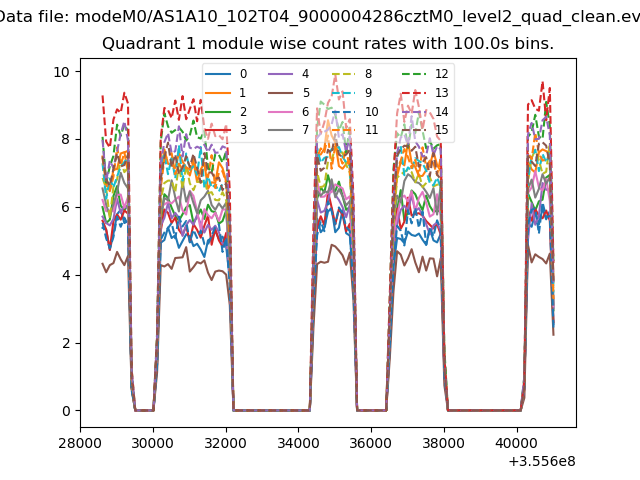
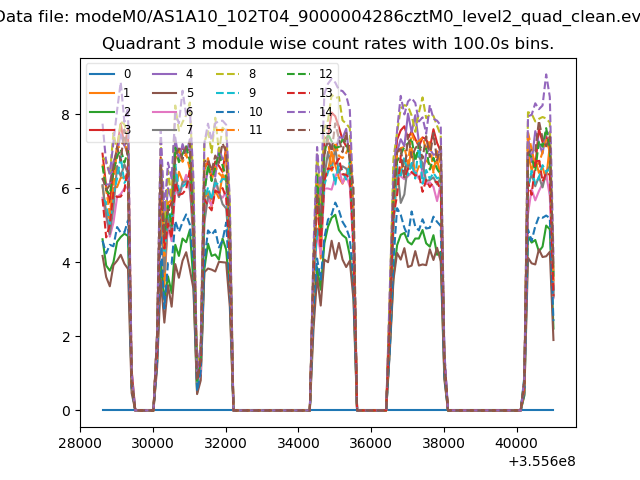
| Module-wise count rates for Quadrant A Data is divided into 100 sec bins |
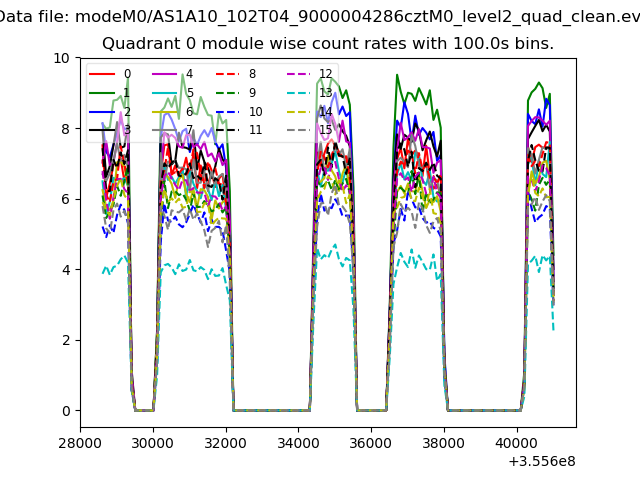 |
 |
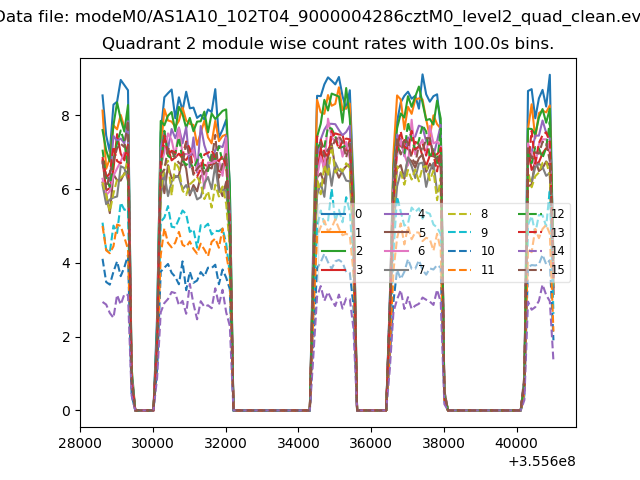
| Module-wise count rates for Quadrant B Data is divided into 100 sec bins |
 |
 |
| Module-wise count rates for Quadrant C Data is divided into 100 sec bins |
 |
 |
| Module-wise count rates for Quadrant D Data is divided into 100 sec bins |
 |
 |
| Parameter | Plot |
|---|---|
| CZT HV Monitor | 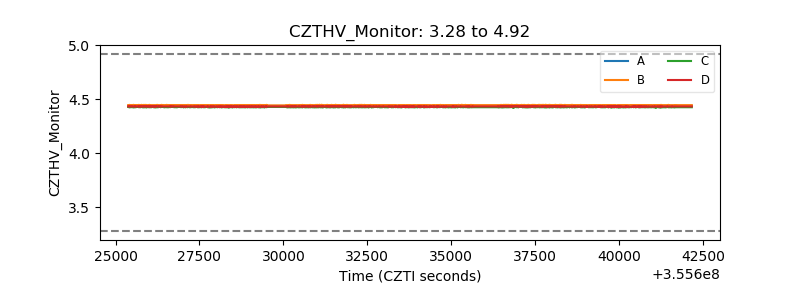 |
| D_VDD | 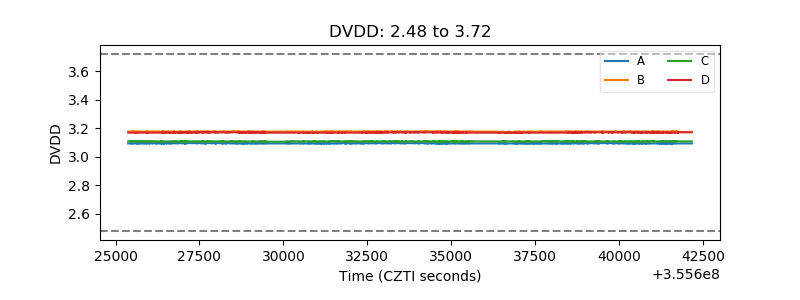 |
| Temperature 1 | 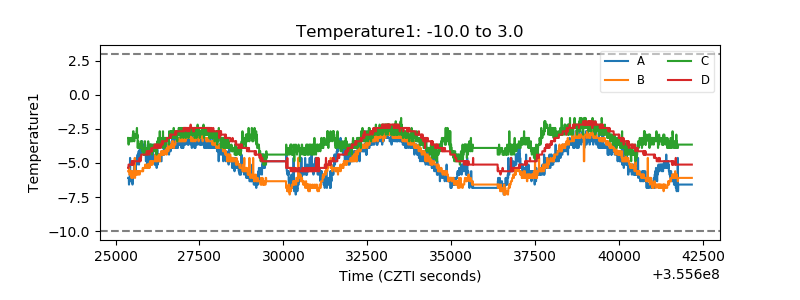 |
| Veto HV Monitor | 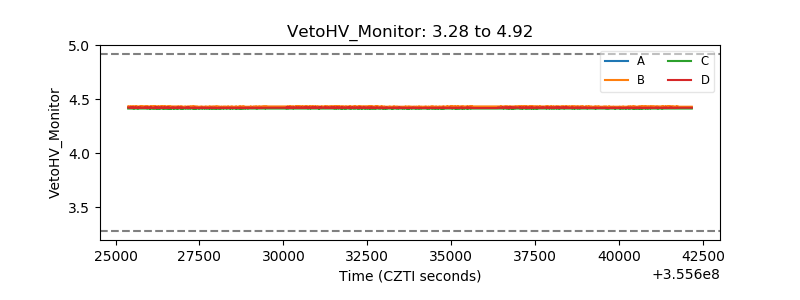 |
| Veto LLD | 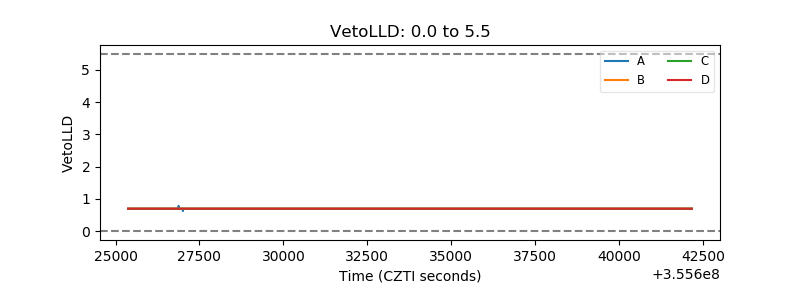 |
| Alpha Counter | 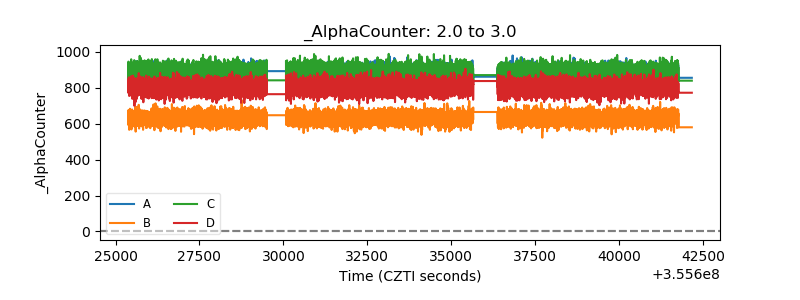 |
| _CPM_Rate | 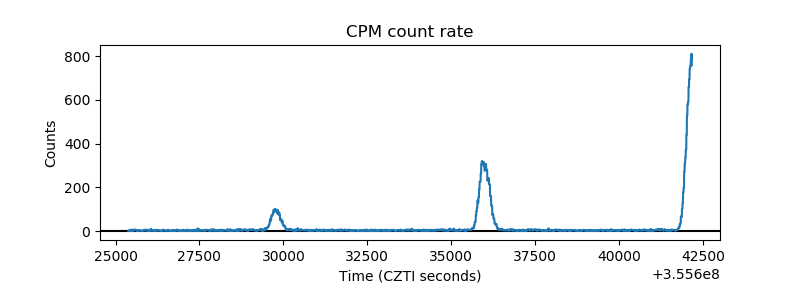 |
| CZT Counter | 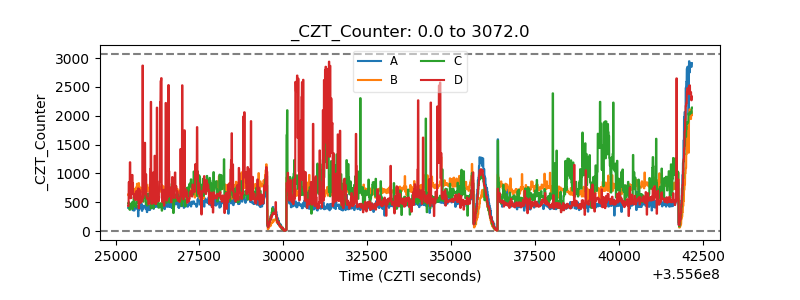 |
| +2.5 Volts monitor | 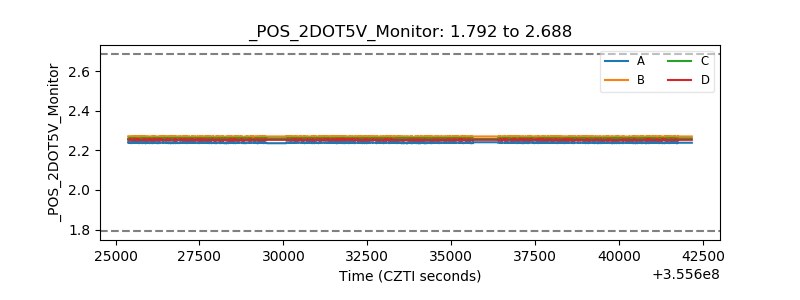 |
| +5 Volts monitor | 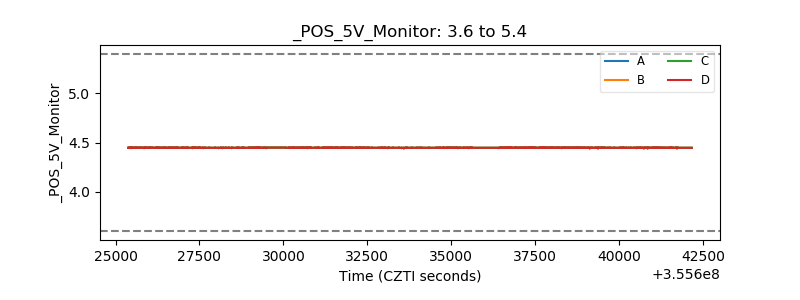 |
| _ROLL_ROT | 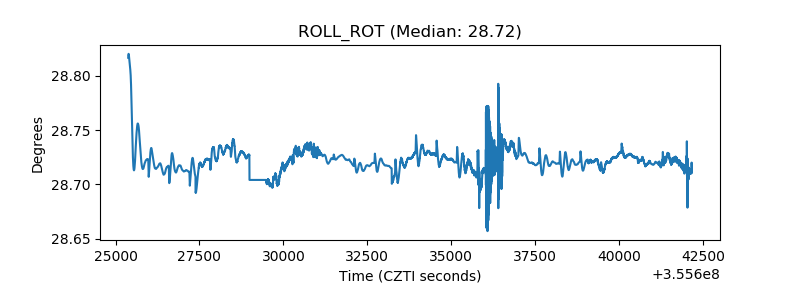 |
| _Roll_DEC | 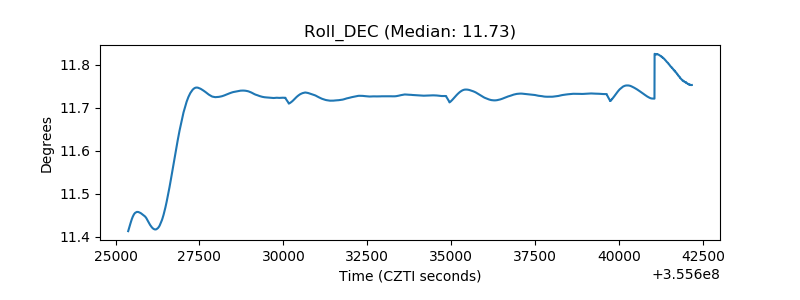 |
| _Roll_RA | 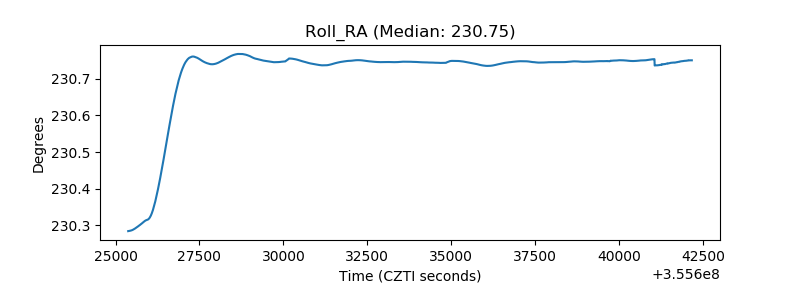 |
| Veto Counter | 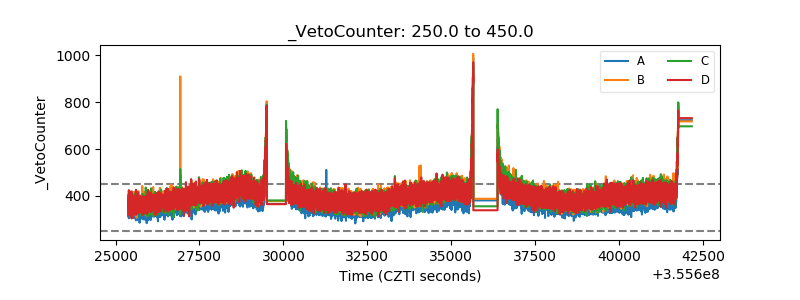 |