| Param | Original file | Final file |
|---|---|---|
| Filename | modeM0/AS1A10_083T01_9000004306cztM0_level2.fits | modeM0/AS1A10_083T01_9000004306cztM0_level2_quad_clean.evt |
| Size (bytes) | 152,758,080 | 171,167,040 |
| Size | 145.7 MB | 163.2 MB |
| Events in quadrant A | 940,972 | 1,081,144 |
| Events in quadrant B | 874,654 | 1,057,161 |
| Events in quadrant C | 906,104 | 1,005,323 |
| Events in quadrant D | 807,906 | 942,941 |
| Mode M9 | |||
|---|---|---|---|
| Quadrant | BADHDUFLAG | Total packets | Discarded packets |
| A | 0 | 10 | 0 |
| B | 0 | 10 | 0 |
| C | 0 | 10 | 0 |
| D | 0 | 10 | 0 |
| Mode M0 | |||
|---|---|---|---|
| Quadrant | BADHDUFLAG | Total packets | Discarded packets |
| A | 0 | 32810 | 0 |
| B | 0 | 48162 | 0 |
| C | 0 | 33014 | 0 |
| D | 0 | 34212 | 0 |
| Mode SS | |||
|---|---|---|---|
| Quadrant | BADHDUFLAG | Total packets | Discarded packets |
| A | 0 | 324 | 0 |
| B | 0 | 324 | 0 |
| C | 0 | 324 | 0 |
| D | 0 | 324 | 0 |
| Quadrant | Total seconds | Saturated seconds | Saturation percentage |
|---|---|---|---|
| A | 15900 | 181 | 1.138365% |
| B | 15900 | 371 | 2.333333% |
| C | 15900 | 219 | 1.377358% |
| D | 15900 | 106 | 0.666667% |
Noise dominated data is calculated using 1-second bins in cleaned event files. If a bin has >2000 counts, and if more than 50% of those come from <1% of pixels, then it is considered to be noise-dominated and hence unusable.
| Quadrant | # 1 sec bins | Bins with >0 counts | Bins with >2000 counts | High rate bins dominated by noise | Noise dominated (total time) | Noise dominated (detector-on time) | Marked lightcurve |
|---|---|---|---|---|---|---|---|
| A | 16930 | 15900 | 0 | 0 | 0.00% | 0.00% | 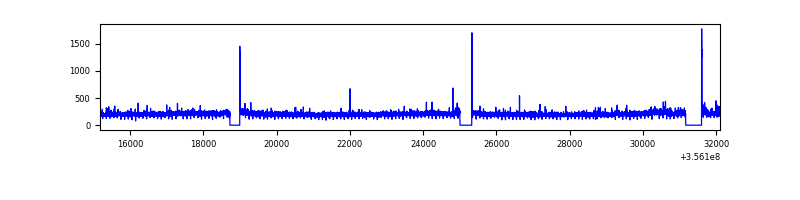 |
| B | 16930 | 15900 | 0 | 0 | 0.00% | 0.00% | 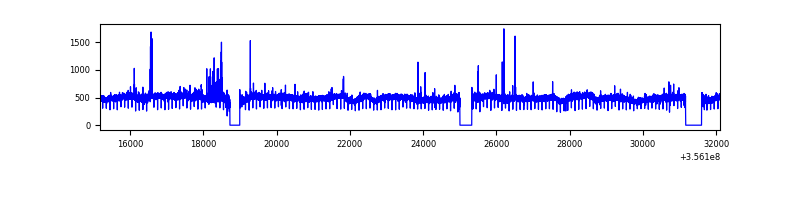 |
| C | 16930 | 15900 | 0 | 0 | 0.00% | 0.00% | 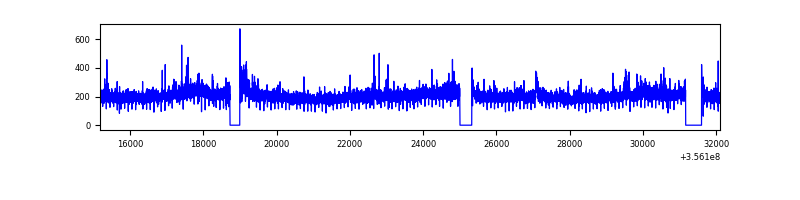 |
| D | 16930 | 15899 | 0 | 0 | 0.00% | 0.00% | 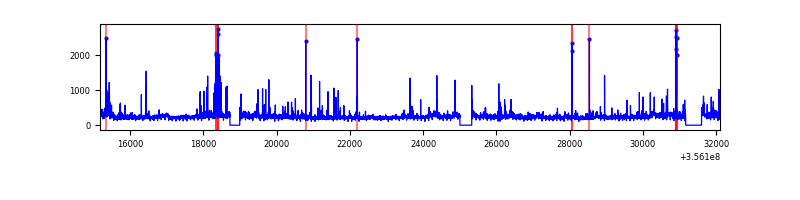 |
Top three noisy pixels from each quadrant. If the there are fewer than three noisy pixels in the level2.evt file, extra rows are filled as -1
| Pixel properties | Quadrant properties | ||||||
|---|---|---|---|---|---|---|---|
| Quadrant | DetID | PixID | Counts | Sigma | Mean | Median | Sigma |
| A | 0 | 29 | 918 | 11.04 | 245 | 231 | 62.2 |
| A | 7 | 110 | 744 | 8.25 | 245 | 231 | 62.2 |
| A | 0 | 30 | 721 | 7.88 | 245 | 231 | 62.2 |
| B | 2 | 9 | 753 | 11.15 | 231 | 220 | 47.8 |
| B | 3 | 17 | 617 | 8.31 | 231 | 220 | 47.8 |
| B | 2 | 8 | 602 | 7.99 | 231 | 220 | 47.8 |
| C | 1 | 80 | 715 | 7.9 | 239 | 223 | 62.3 |
| C | 1 | 81 | 710 | 7.82 | 239 | 223 | 62.3 |
| C | 12 | 241 | 649 | 6.84 | 239 | 223 | 62.3 |
| D | 15 | 46 | 608 | 6.33 | 230 | 209 | 62.9 |
| D | 10 | 189 | 572 | 5.76 | 230 | 209 | 62.9 |
| D | 1 | 31 | 571 | 5.74 | 230 | 209 | 62.9 |
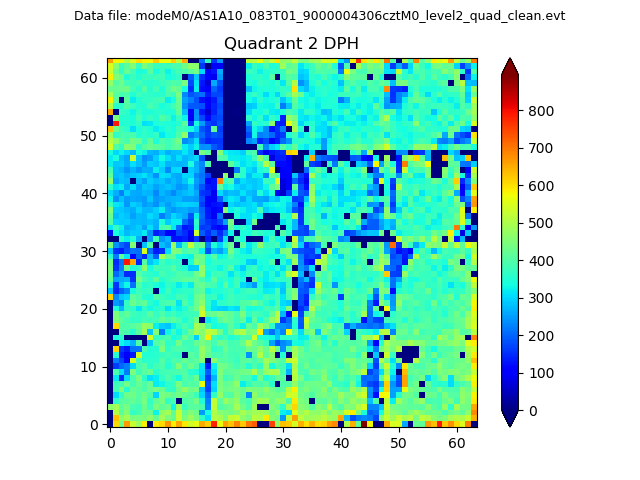
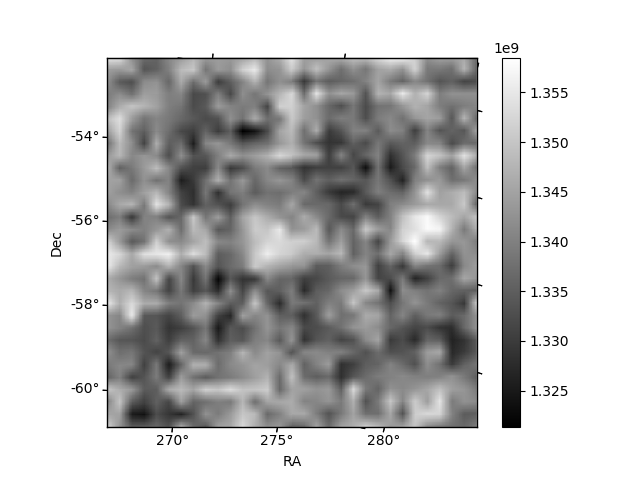
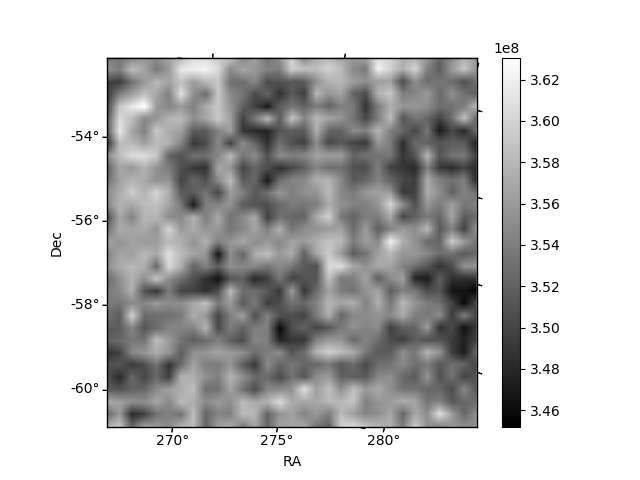
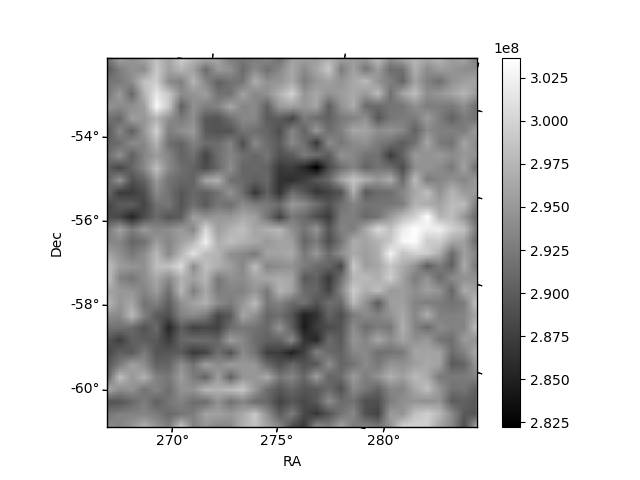
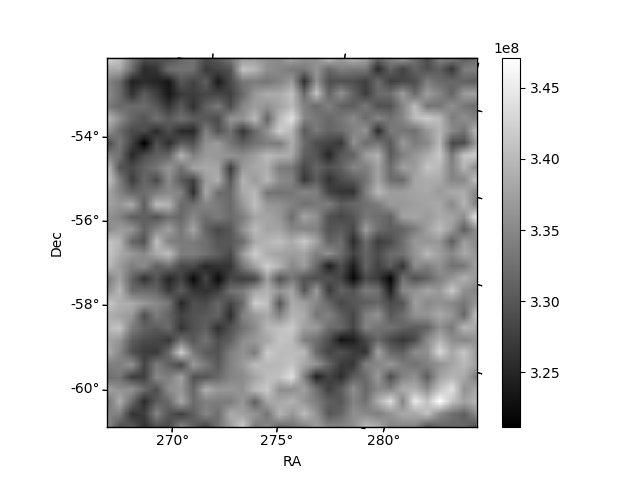
Histogram calculated using DETX and DETY for each event in the final _common_clean file
| Quadrant A | 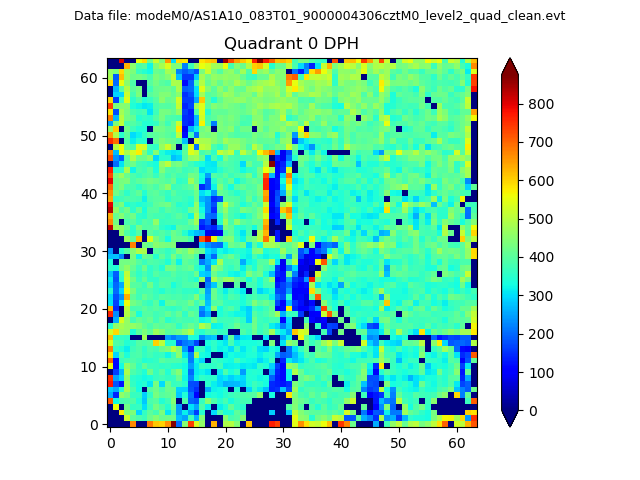 |
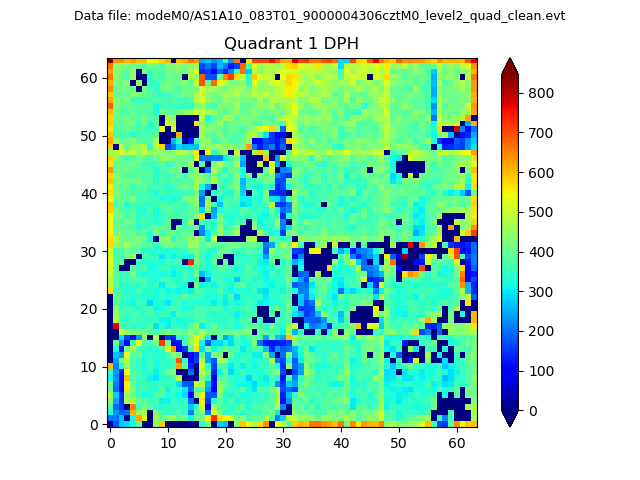 |
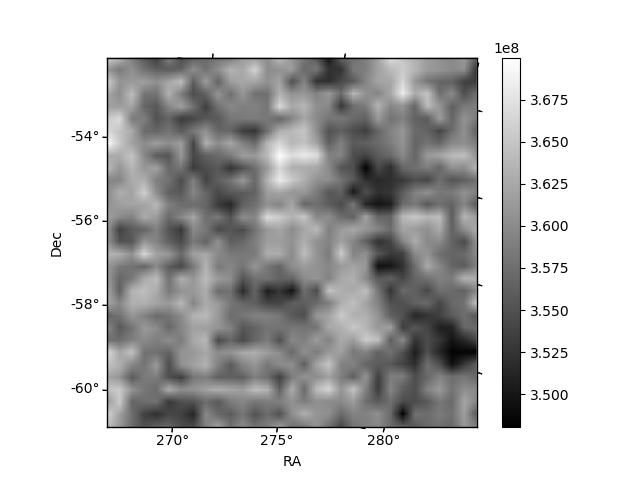
Quadrant B |
|---|---|---|---|
| Quadrant D | 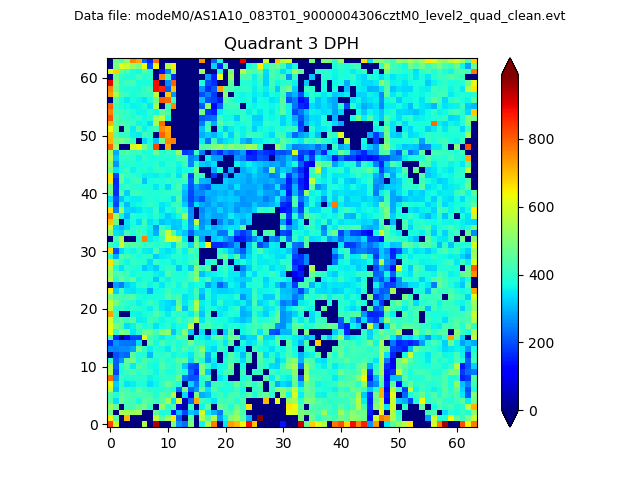 |
 |
Quadrant C |
| Plot type | Count rate plots | Images |
|---|---|---|
| Comparison with Poisson distribution Blue bars denote a histogram of data divided into 1 sec bins. Red curve is a Poisson curve with rate = median count rate of data. |
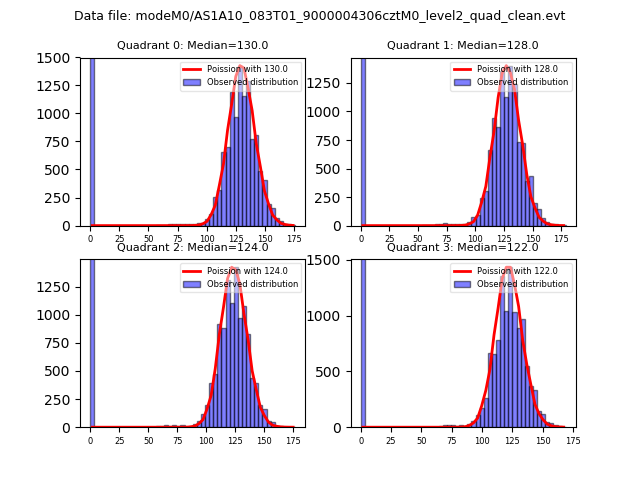 |
 |
| Quadrant-wise count rates Data is divided into 100 sec bins |
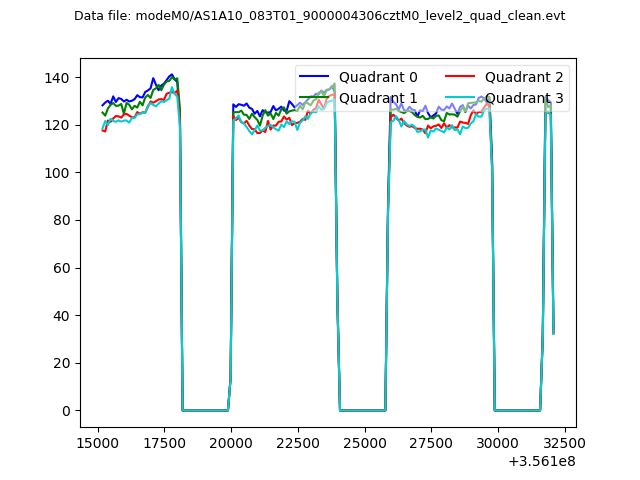 |
|
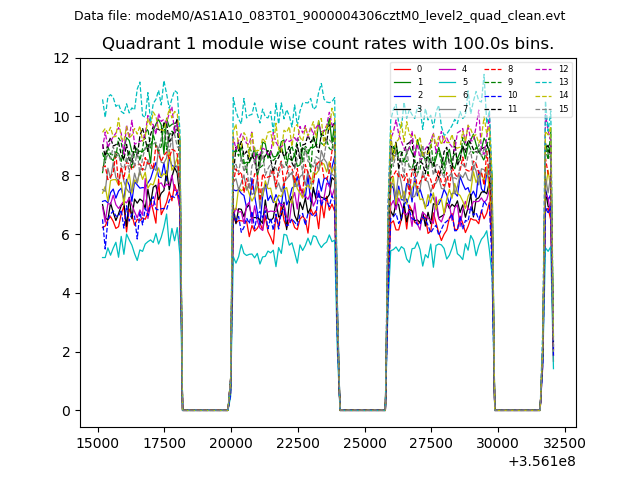
| Module-wise count rates for Quadrant A Data is divided into 100 sec bins |
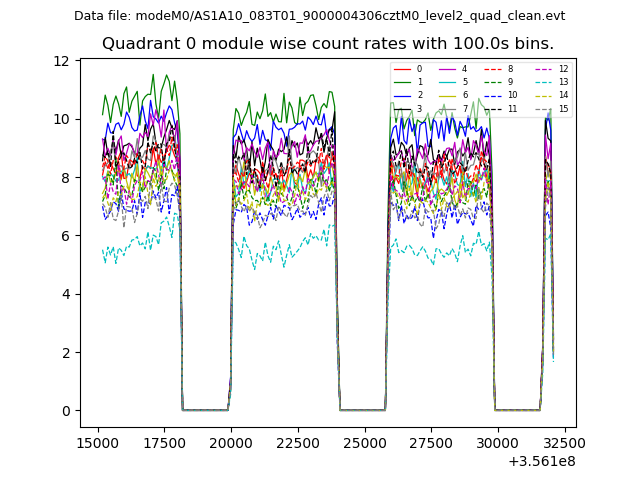 |
 |
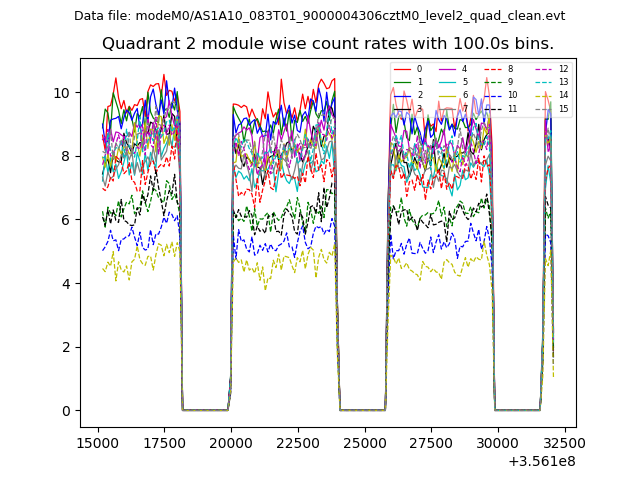
| Module-wise count rates for Quadrant B Data is divided into 100 sec bins |
 |
 |
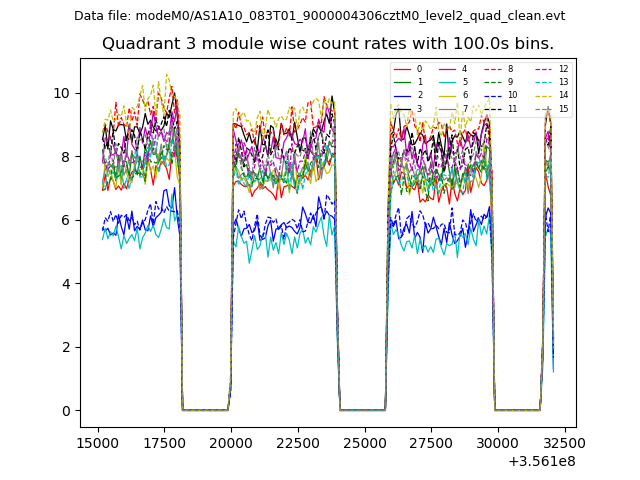
| Module-wise count rates for Quadrant C Data is divided into 100 sec bins |
 |
 |
| Module-wise count rates for Quadrant D Data is divided into 100 sec bins |
 |
 |
| Parameter | Plot |
|---|---|
| CZT HV Monitor | 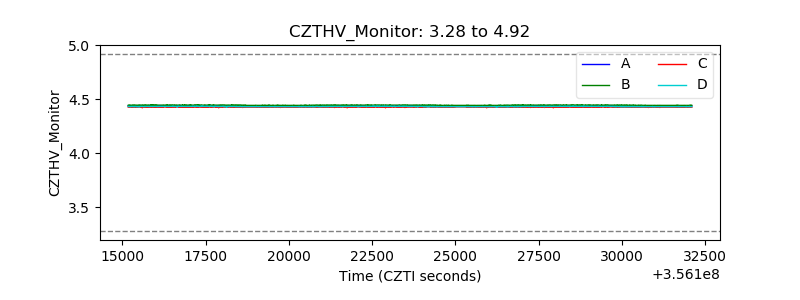 |
| D_VDD | 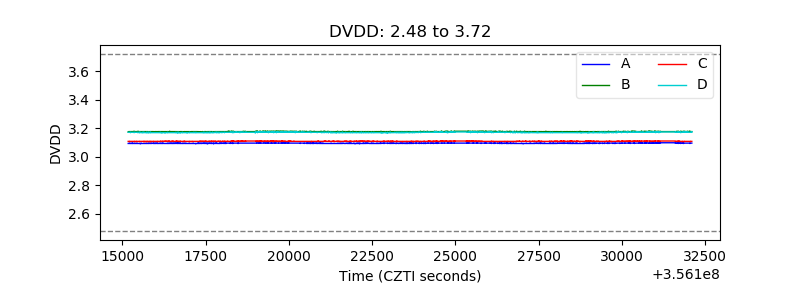 |
| Temperature 1 | 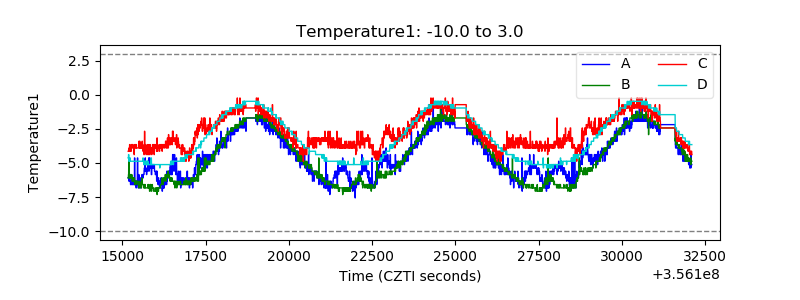 |
| Veto HV Monitor |  |
| Veto LLD | 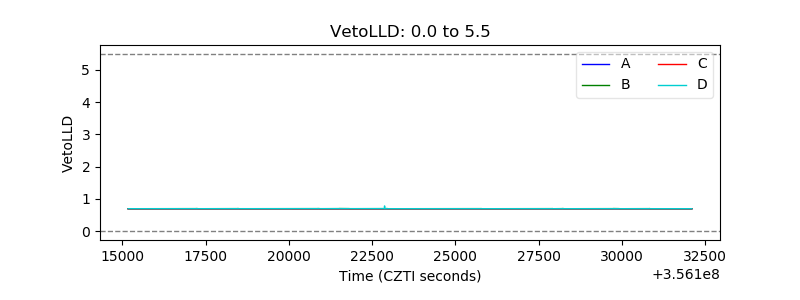 |
| Alpha Counter | 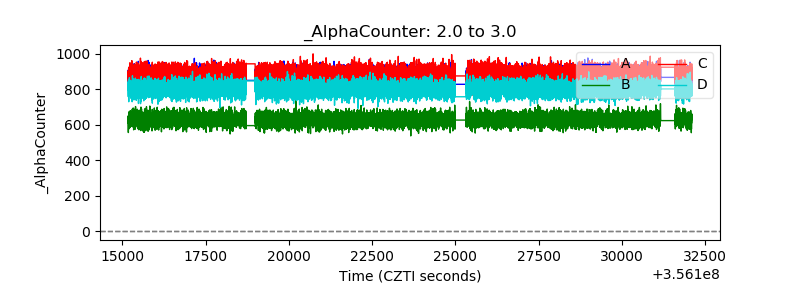 |
| _CPM_Rate | 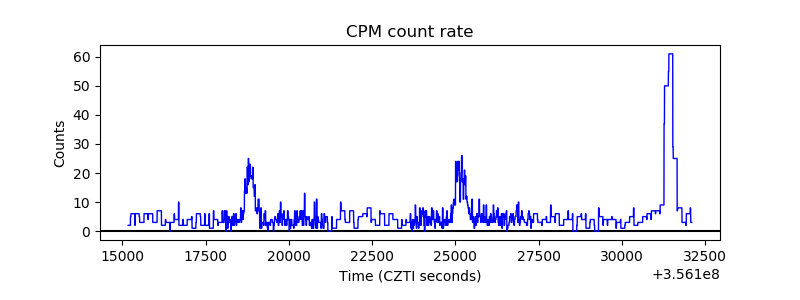 |
| CZT Counter | 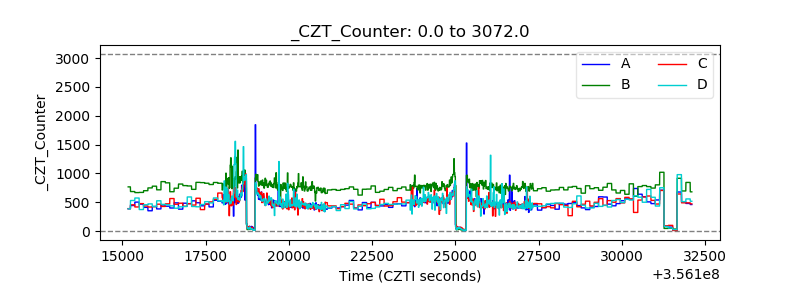 |
| +2.5 Volts monitor | 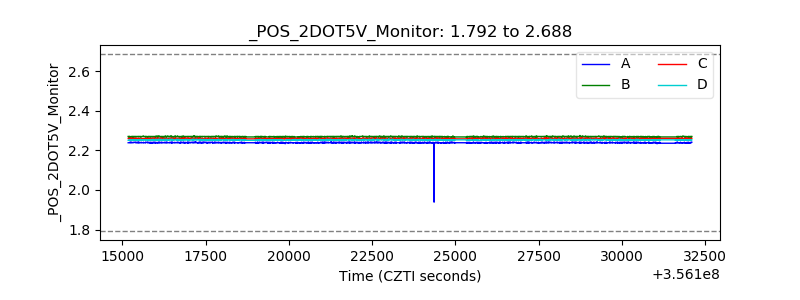 |
| +5 Volts monitor | 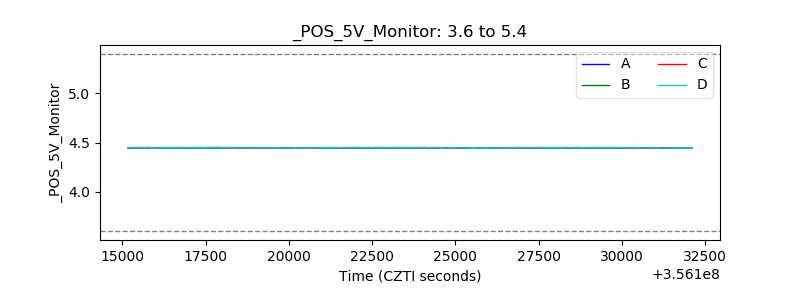 |
| _ROLL_ROT | 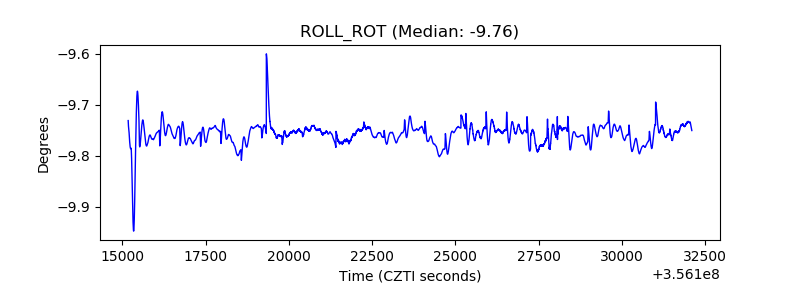 |
| _Roll_DEC | 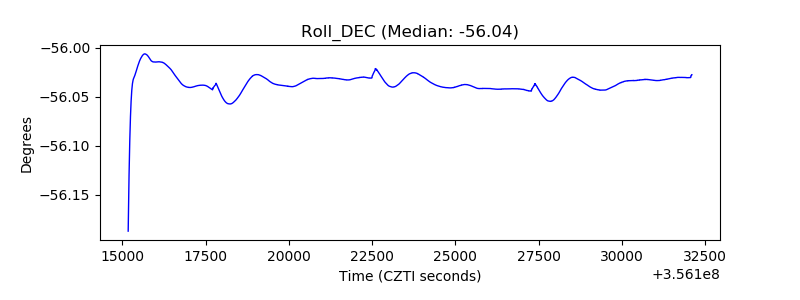 |
| _Roll_RA | 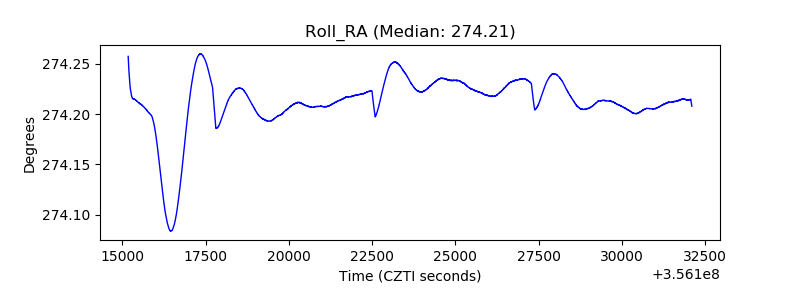 |
| Veto Counter | 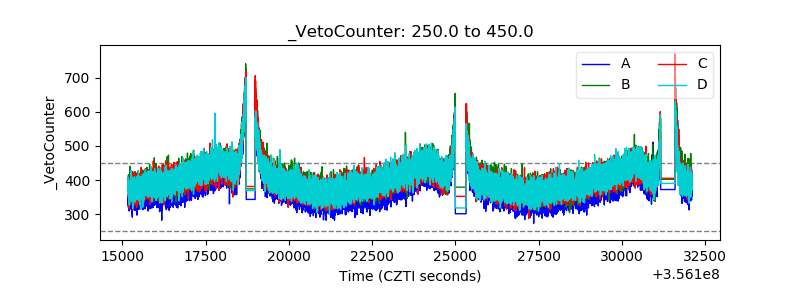 |