| Param | Original file | Final file |
|---|---|---|
| Filename | modeM0/AS1A10_021T09_9000004410_30606cztM0_level2.evt | modeM0/AS1A10_021T09_9000004410_30606cztM0_level2_quad_clean.evt |
| Size (bytes) | 32,734,080 | 6,552,000 |
| Size | 31.2 MB | 6.2 MB |
| Events in quadrant A | 146,378 | 43,060 |
| Events in quadrant B | 253,610 | 42,379 |
| Events in quadrant C | 160,326 | 40,669 |
| Events in quadrant D | 404,059 | 39,454 |
| Mode M0 | |||
|---|---|---|---|
| Quadrant | BADHDUFLAG | Total packets | Discarded packets |
| A | 0 | 684 | 0 |
| B | 0 | 1040 | 0 |
| C | 0 | 712 | 0 |
| D | 0 | 1453 | 0 |
| Mode SS | |||
|---|---|---|---|
| Quadrant | BADHDUFLAG | Total packets | Discarded packets |
| A | 0 | 8 | 0 |
| B | 0 | 8 | 0 |
| C | 0 | 8 | 0 |
| D | 0 | 8 | 0 |
| Quadrant | Total seconds | Saturated seconds | Saturation percentage |
|---|---|---|---|
| A | 342 | 0 | 0.000000% |
| B | 341 | 1 | 0.293255% |
| C | 341 | 0 | 0.000000% |
| D | 341 | 5 | 1.466276% |
Noise dominated data is calculated using 1-second bins in cleaned event files. If a bin has >2000 counts, and if more than 50% of those come from <1% of pixels, then it is considered to be noise-dominated and hence unusable.
| Quadrant | # 1 sec bins | Bins with >0 counts | Bins with >2000 counts | High rate bins dominated by noise | Noise dominated (total time) | Noise dominated (detector-on time) | Marked lightcurve |
|---|---|---|---|---|---|---|---|
| A | 342 | 342 | 0 | 0 | 0.00% | 0.00% | 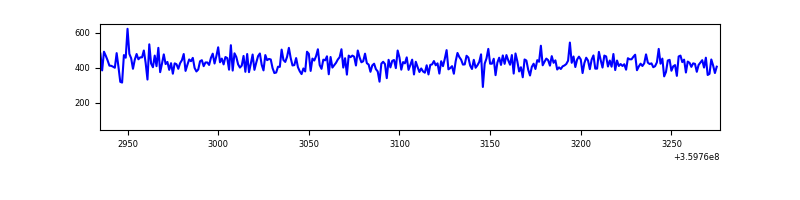 |
| B | 341 | 341 | 0 | 0 | 0.00% | 0.00% | 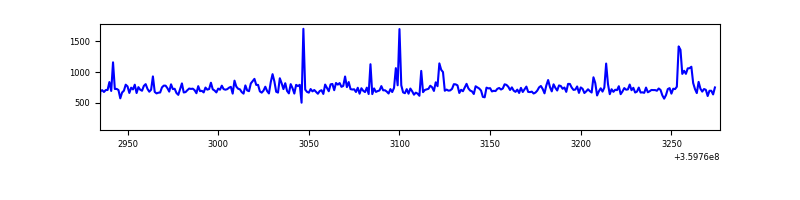 |
| C | 341 | 341 | 0 | 0 | 0.00% | 0.00% | 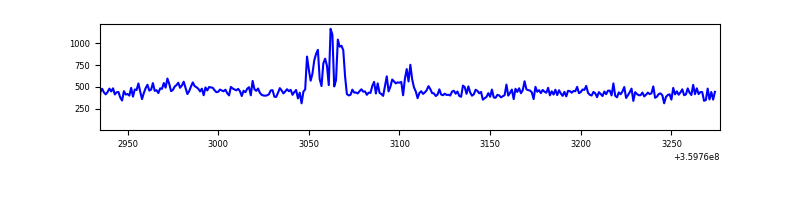 |
| D | 341 | 341 | 25 | 25 | 7.33% | 7.33% | 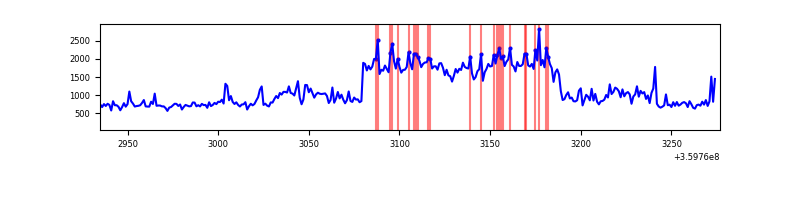 |
Top three noisy pixels from each quadrant. If the there are fewer than three noisy pixels in the level2.evt file, extra rows are filled as -1
| Pixel properties | Quadrant properties | ||||||
|---|---|---|---|---|---|---|---|
| Quadrant | DetID | PixID | Counts | Sigma | Mean | Median | Sigma |
| A | 13 | 254 | 718 | 69.37 | 37 | 36 | 9.8 |
| A | 3 | 137 | 369 | 33.87 | 37 | 36 | 9.8 |
| A | 0 | 226 | 322 | 29.09 | 37 | 36 | 9.8 |
| B | 6 | 159 | 88591 | 9458.58 | 37 | 36 | 9.4 |
| B | 0 | 229 | 11972 | 1274.89 | 37 | 36 | 9.4 |
| B | 15 | 185 | 4622 | 489.83 | 37 | 36 | 9.4 |
| C | 15 | 208 | 13172 | 1250.02 | 35 | 35 | 10.5 |
| C | 14 | 238 | 5642 | 533.52 | 35 | 35 | 10.5 |
| C | 3 | 233 | 1039 | 95.53 | 35 | 35 | 10.5 |
| D | 8 | 195 | 194332 | 18353.49 | 36 | 34 | 10.6 |
| D | 5 | 222 | 51622 | 4873.03 | 36 | 34 | 10.6 |
| D | 12 | 218 | 10827 | 1019.51 | 36 | 34 | 10.6 |
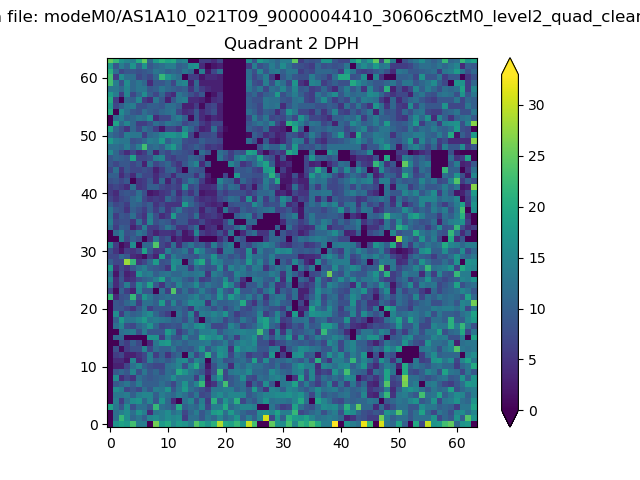
Histogram calculated using DETX and DETY for each event in the final _common_clean file
| Quadrant A | 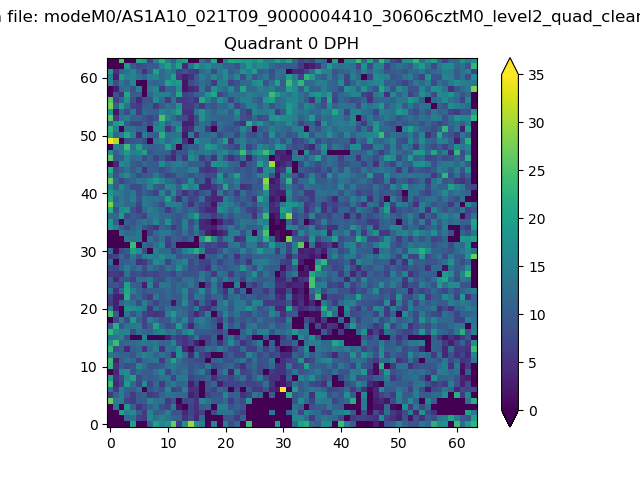 |
 |
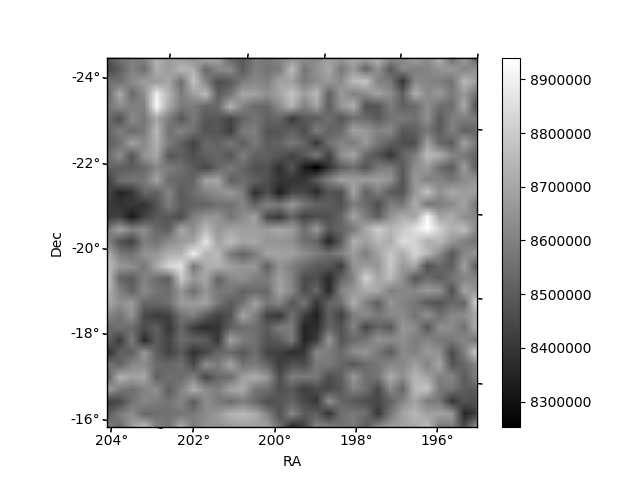
Quadrant B |
|---|---|---|---|
| Quadrant D |  |
 |
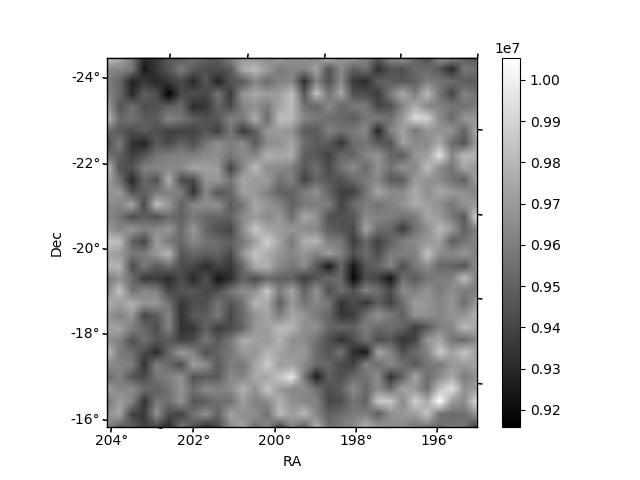
Quadrant C |
| Plot type | Count rate plots | Images |
|---|---|---|
| Comparison with Poisson distribution Blue bars denote a histogram of data divided into 1 sec bins. Red curve is a Poisson curve with rate = median count rate of data. |
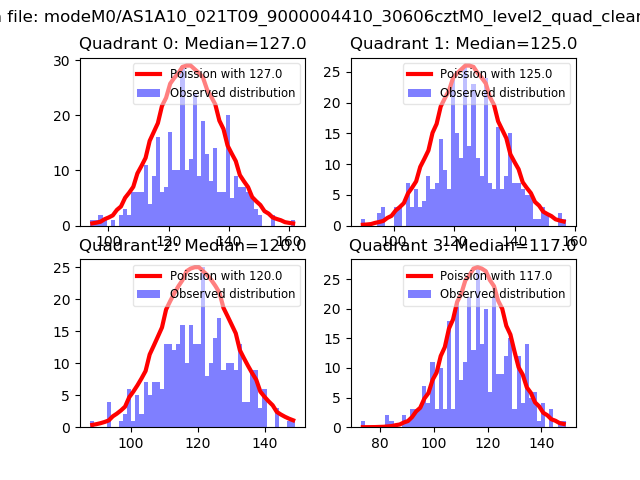 |
 |
| Quadrant-wise count rates Data is divided into 100 sec bins |
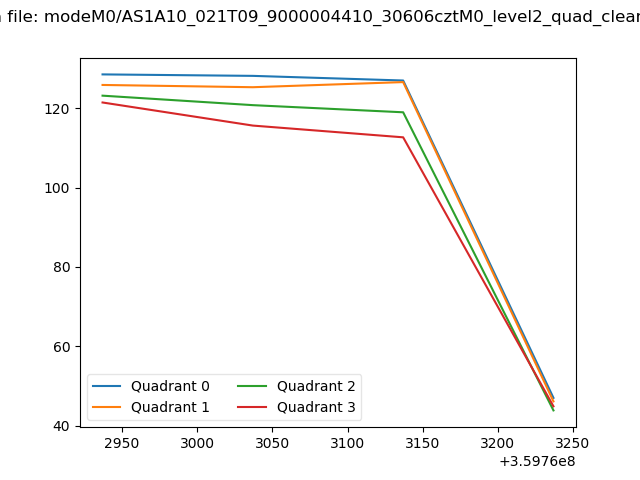 |
|
| Module-wise count rates for Quadrant A Data is divided into 100 sec bins |
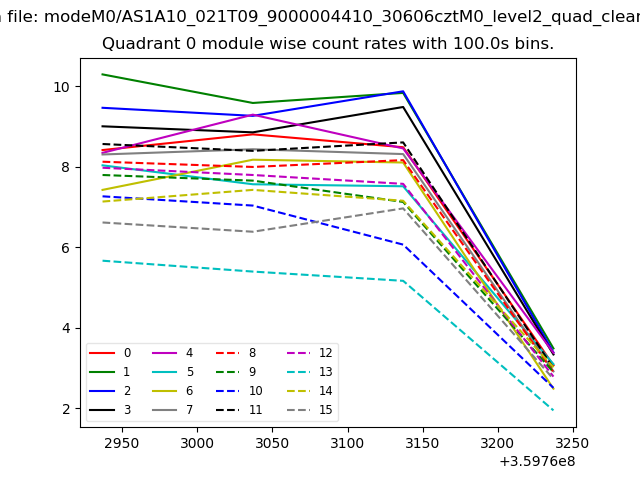 |
 |
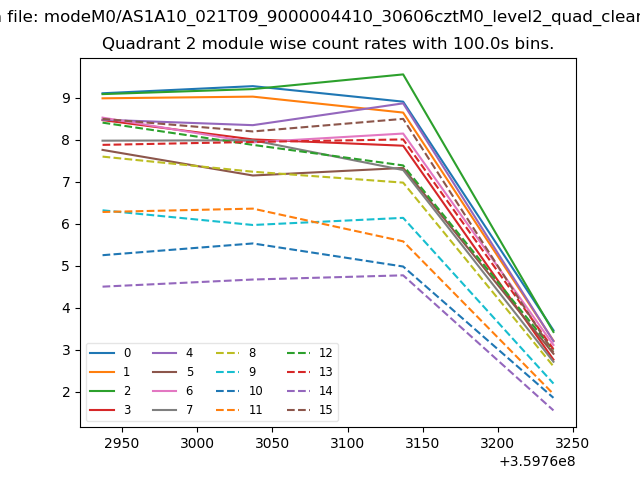
| Module-wise count rates for Quadrant B Data is divided into 100 sec bins |
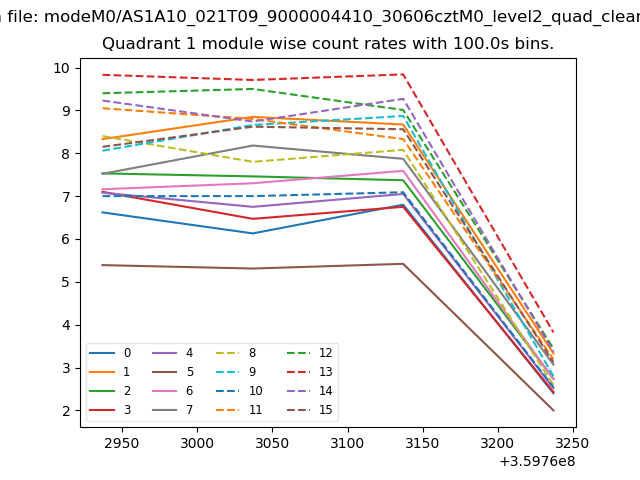 |
 |
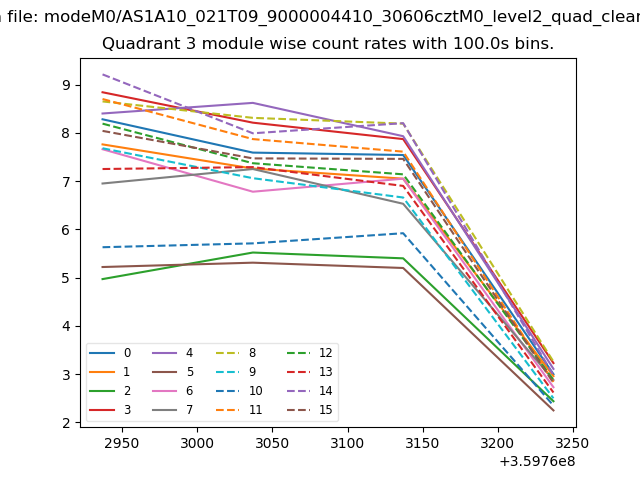
| Module-wise count rates for Quadrant C Data is divided into 100 sec bins |
 |
 |
| Module-wise count rates for Quadrant D Data is divided into 100 sec bins |
 |
 |
| Parameter | Plot |
|---|---|
| CZT HV Monitor |  |
| D_VDD | 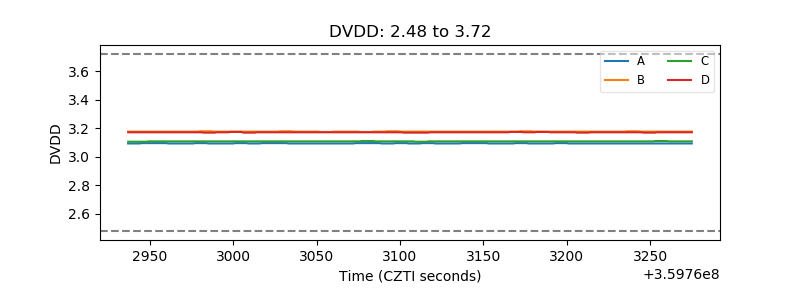 |
| Temperature 1 |  |
| Veto HV Monitor | 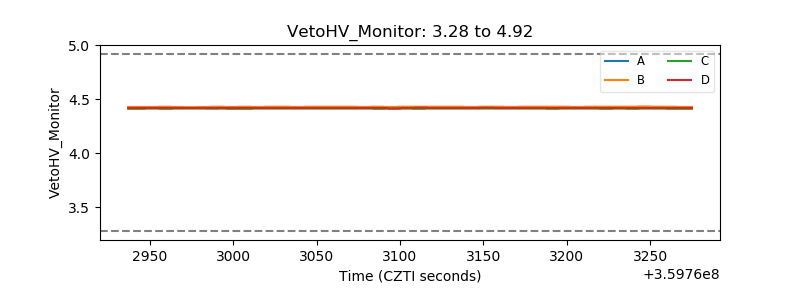 |
| Veto LLD | 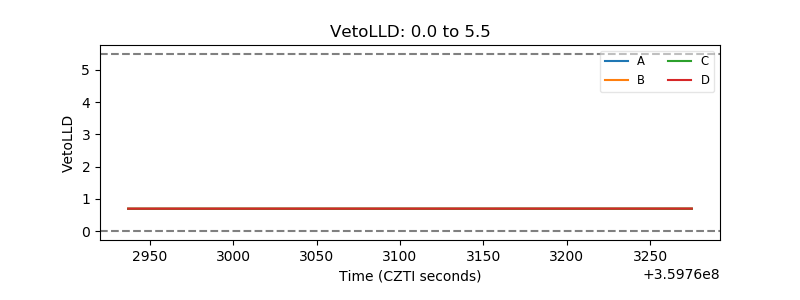 |
| Alpha Counter | 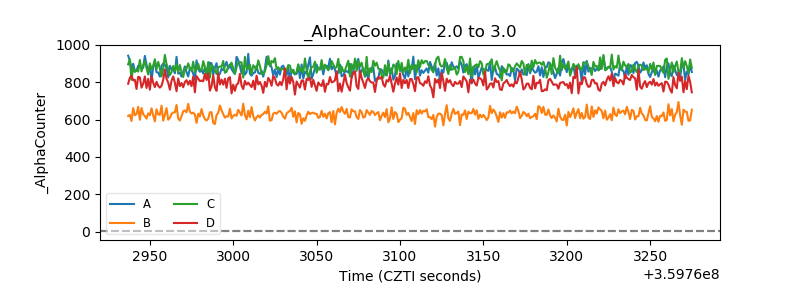 |
| _CPM_Rate | 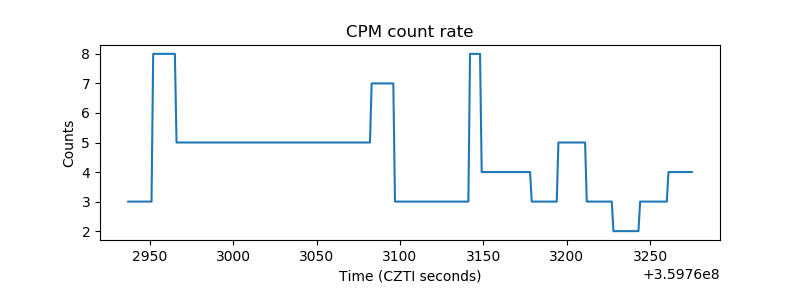 |
| CZT Counter | 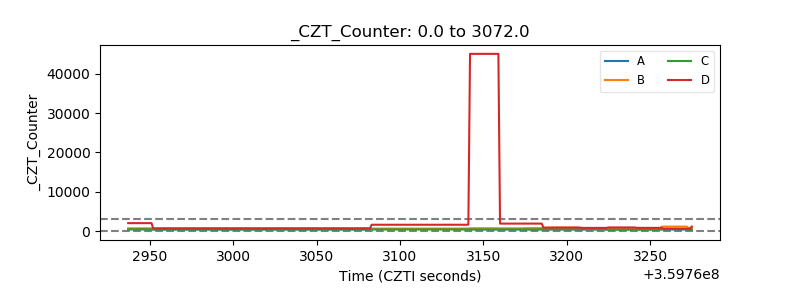 |
| +2.5 Volts monitor |  |
| +5 Volts monitor |  |
| _ROLL_ROT | 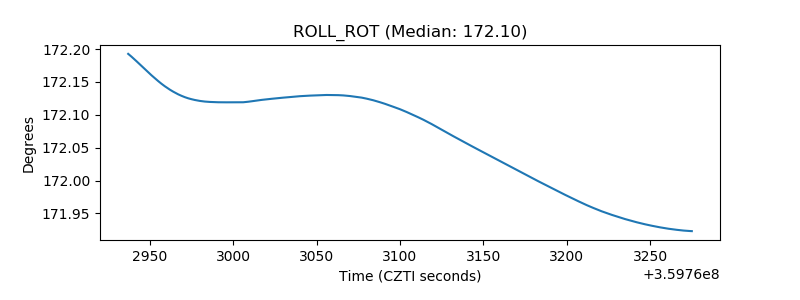 |
| _Roll_DEC | 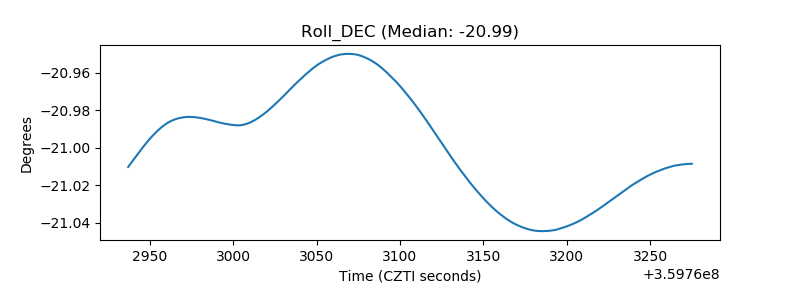 |
| _Roll_RA | 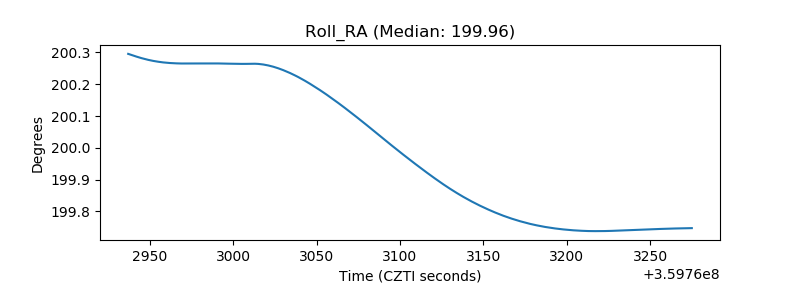 |
| Veto Counter | 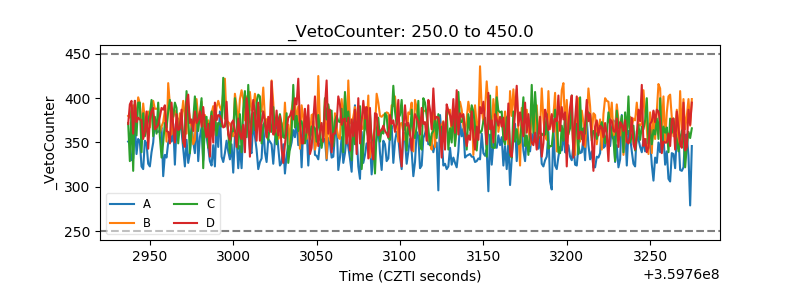 |