| Param | Original file | Final file |
|---|---|---|
| Filename | modeM0/AS1T04_018T01_9000004494_31126cztM0_level2.evt | modeM0/AS1T04_018T01_9000004494_31126cztM0_level2_quad_clean.evt |
| Size (bytes) | 40,832,640 | 8,124,480 |
| Size | 38.9 MB | 7.7 MB |
| Events in quadrant A | 241,861 | 51,326 |
| Events in quadrant B | 411,741 | 50,154 |
| Events in quadrant C | 253,611 | 48,088 |
| Events in quadrant D | 287,278 | 48,196 |
| Mode M0 | |||
|---|---|---|---|
| Quadrant | BADHDUFLAG | Total packets | Discarded packets |
| A | 0 | 1149 | 0 |
| B | 0 | 1715 | 0 |
| C | 0 | 1157 | 0 |
| D | 0 | 1274 | 0 |
| Mode SS | |||
|---|---|---|---|
| Quadrant | BADHDUFLAG | Total packets | Discarded packets |
| A | 0 | 10 | 0 |
| B | 0 | 10 | 0 |
| C | 0 | 10 | 0 |
| D | 0 | 10 | 0 |
| Quadrant | Total seconds | Saturated seconds | Saturation percentage |
|---|---|---|---|
| A | 574 | 0 | 0.000000% |
| B | 574 | 0 | 0.000000% |
| C | 574 | 2 | 0.348432% |
| D | 573 | 1 | 0.174520% |
Noise dominated data is calculated using 1-second bins in cleaned event files. If a bin has >2000 counts, and if more than 50% of those come from <1% of pixels, then it is considered to be noise-dominated and hence unusable.
| Quadrant | # 1 sec bins | Bins with >0 counts | Bins with >2000 counts | High rate bins dominated by noise | Noise dominated (total time) | Noise dominated (detector-on time) | Marked lightcurve |
|---|---|---|---|---|---|---|---|
| A | 574 | 574 | 0 | 0 | 0.00% | 0.00% | 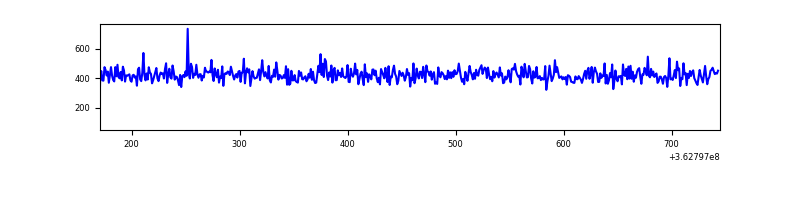 |
| B | 574 | 574 | 0 | 0 | 0.00% | 0.00% | 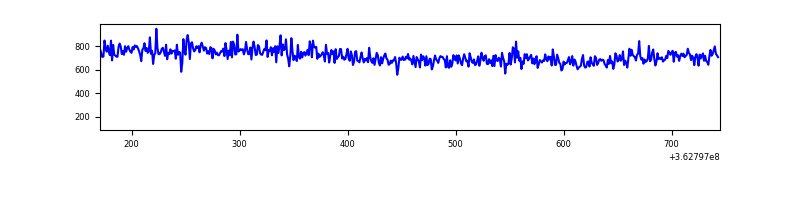 |
| C | 574 | 574 | 0 | 0 | 0.00% | 0.00% | 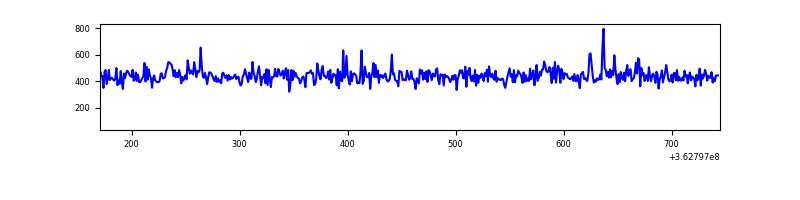 |
| D | 573 | 573 | 3 | 3 | 0.52% | 0.52% | 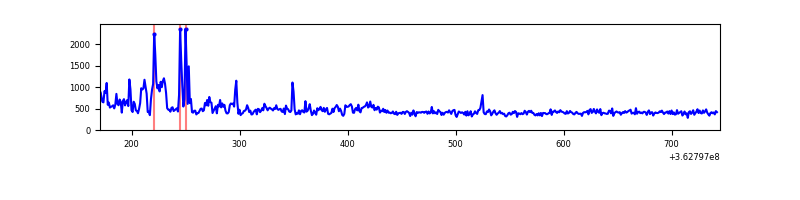 |
Top three noisy pixels from each quadrant. If the there are fewer than three noisy pixels in the level2.evt file, extra rows are filled as -1
| Pixel properties | Quadrant properties | ||||||
|---|---|---|---|---|---|---|---|
| Quadrant | DetID | PixID | Counts | Sigma | Mean | Median | Sigma |
| A | 13 | 254 | 939 | 59.81 | 62 | 61 | 14.7 |
| A | 3 | 137 | 636 | 39.17 | 62 | 61 | 14.7 |
| A | 0 | 226 | 506 | 30.31 | 62 | 61 | 14.7 |
| B | 6 | 159 | 164233 | 11653.04 | 62 | 61 | 14.1 |
| B | 12 | 111 | 1544 | 105.26 | 62 | 61 | 14.1 |
| B | 14 | 111 | 1327 | 89.86 | 62 | 61 | 14.1 |
| C | 14 | 238 | 10119 | 622.58 | 60 | 60 | 16.2 |
| C | 9 | 54 | 2845 | 172.37 | 60 | 60 | 16.2 |
| C | 1 | 16 | 1636 | 97.54 | 60 | 60 | 16.2 |
| D | 13 | 174 | 38976 | 2388.7 | 59 | 57 | 16.3 |
| D | 8 | 195 | 22505 | 1377.77 | 59 | 57 | 16.3 |
| D | 2 | 234 | 2270 | 135.83 | 59 | 57 | 16.3 |
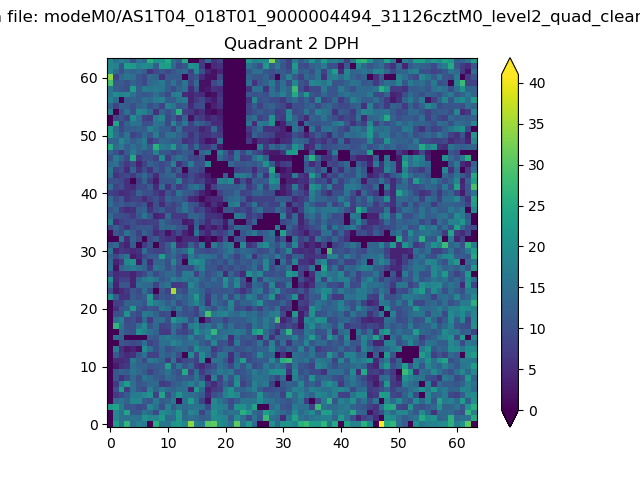
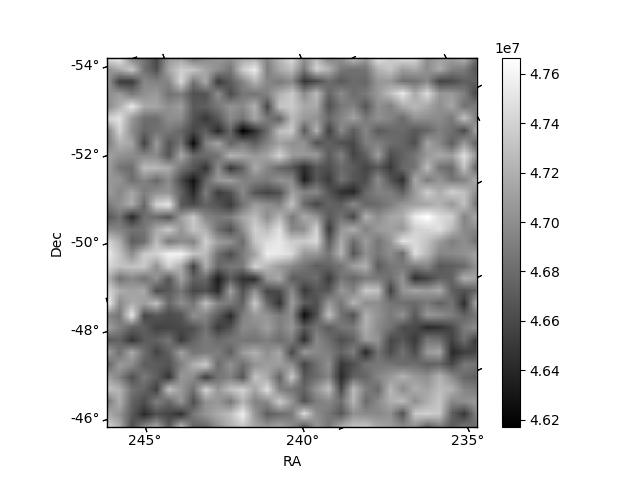
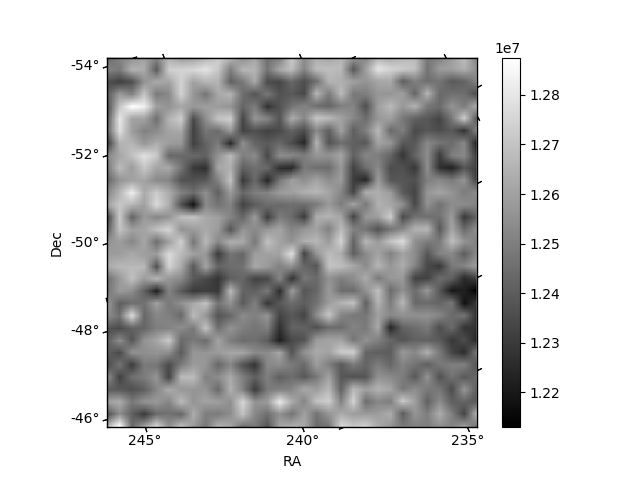
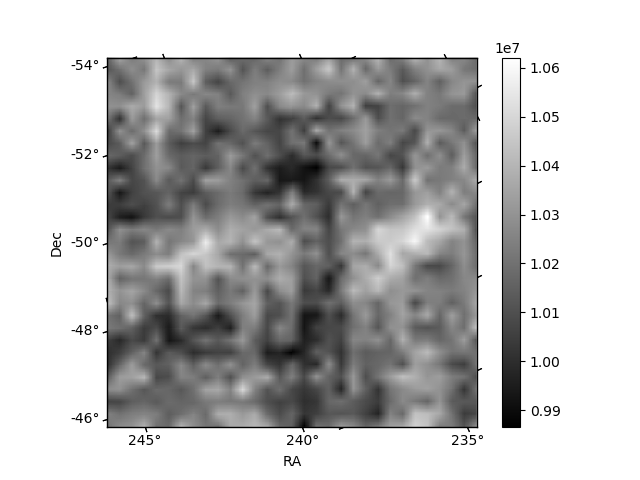
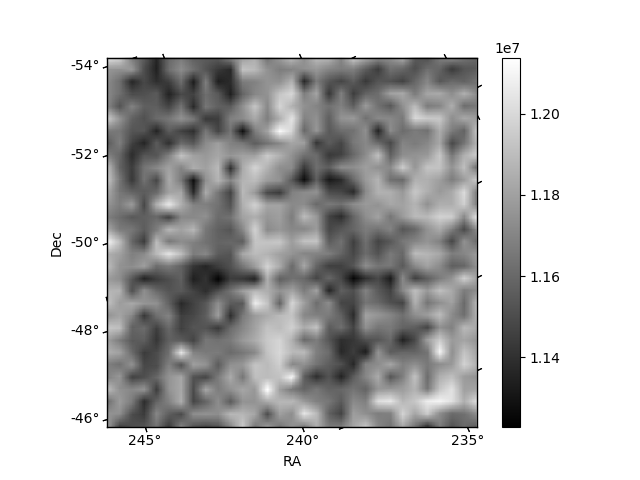
Histogram calculated using DETX and DETY for each event in the final _common_clean file
| Quadrant A | 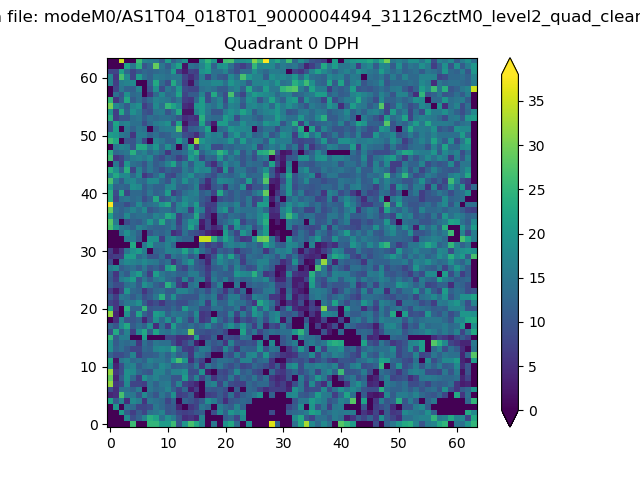 |
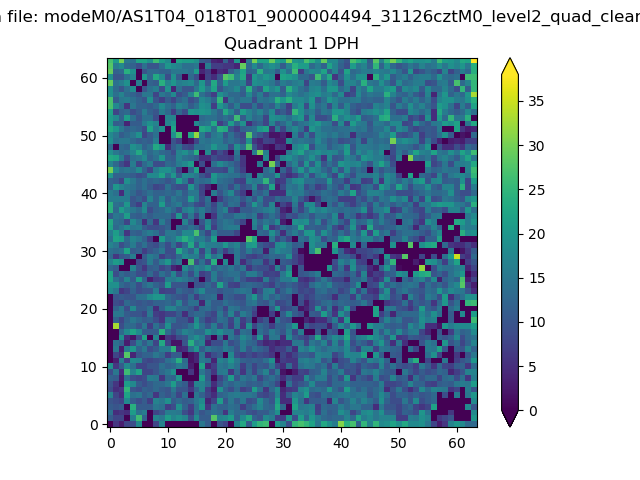 |
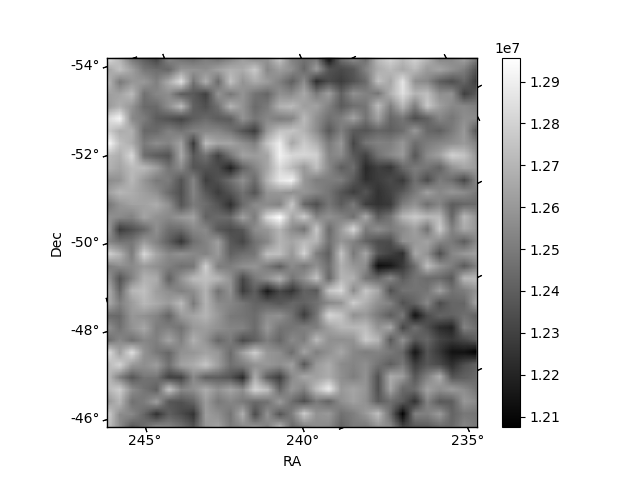
Quadrant B |
|---|---|---|---|
| Quadrant D | 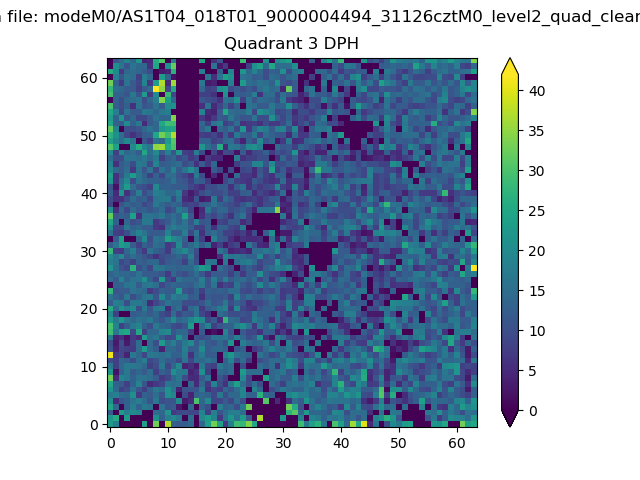 |
 |
Quadrant C |
| Plot type | Count rate plots | Images |
|---|---|---|
| Comparison with Poisson distribution Blue bars denote a histogram of data divided into 1 sec bins. Red curve is a Poisson curve with rate = median count rate of data. |
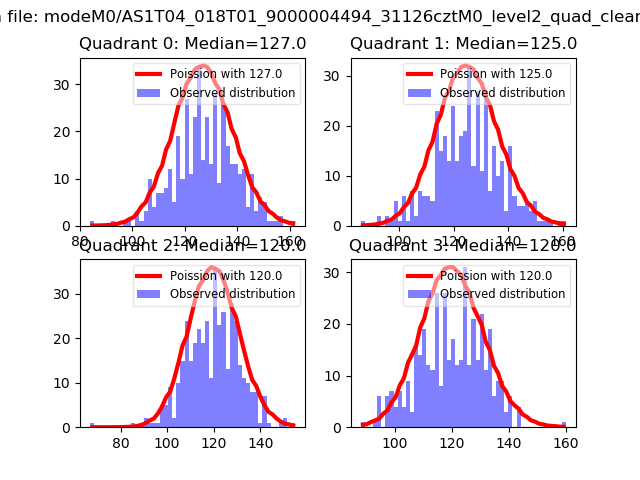 |
 |
| Quadrant-wise count rates Data is divided into 100 sec bins |
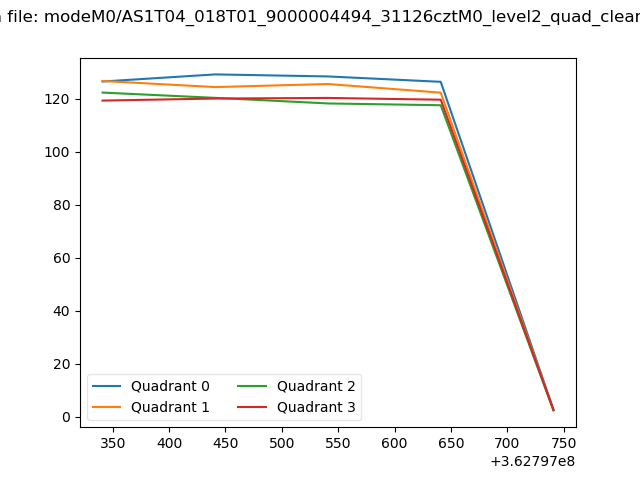 |
|
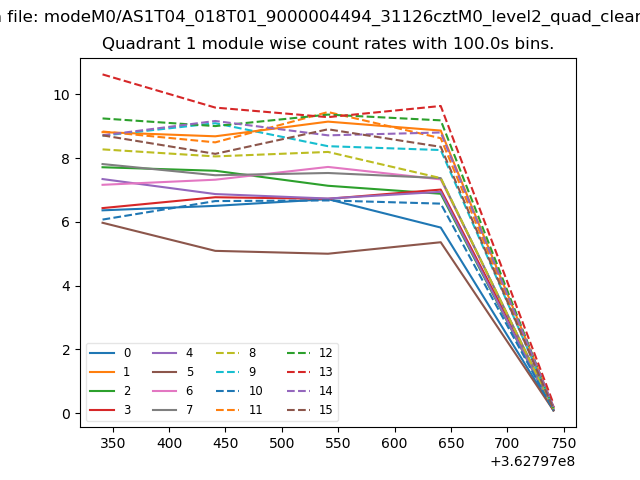
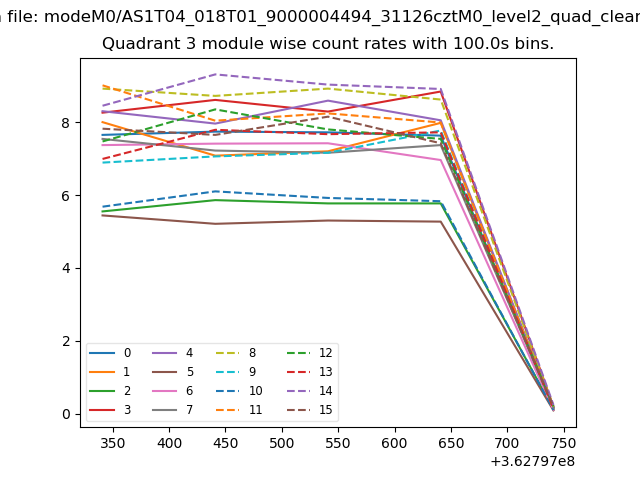
| Module-wise count rates for Quadrant A Data is divided into 100 sec bins |
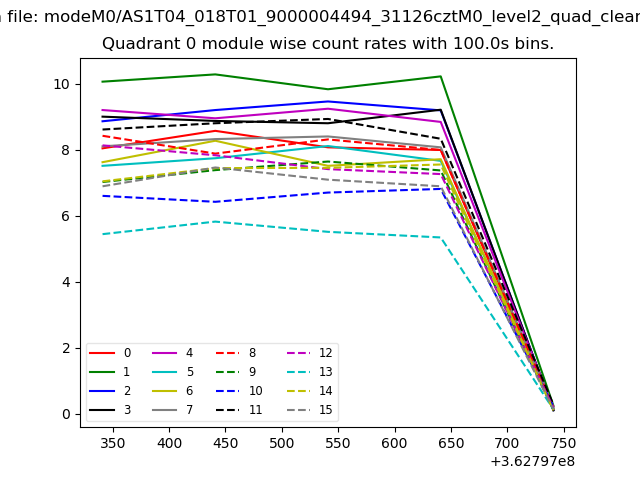 |
 |
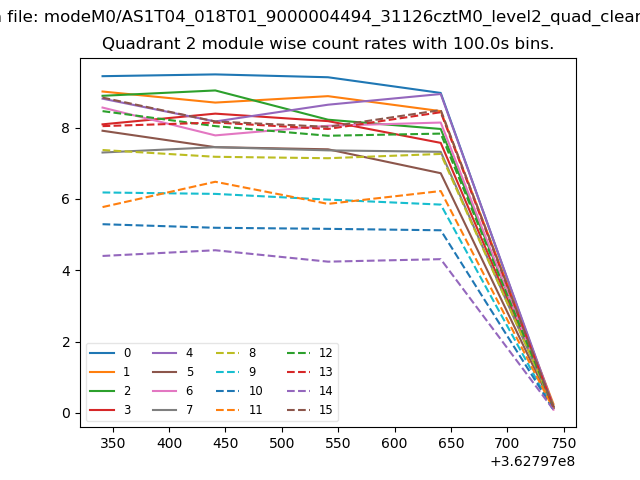
| Module-wise count rates for Quadrant B Data is divided into 100 sec bins |
 |
 |
| Module-wise count rates for Quadrant C Data is divided into 100 sec bins |
 |
 |
| Module-wise count rates for Quadrant D Data is divided into 100 sec bins |
 |
 |
| Parameter | Plot |
|---|---|
| CZT HV Monitor | 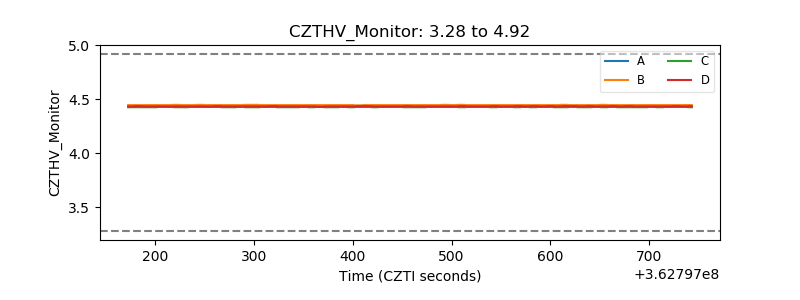 |
| D_VDD | 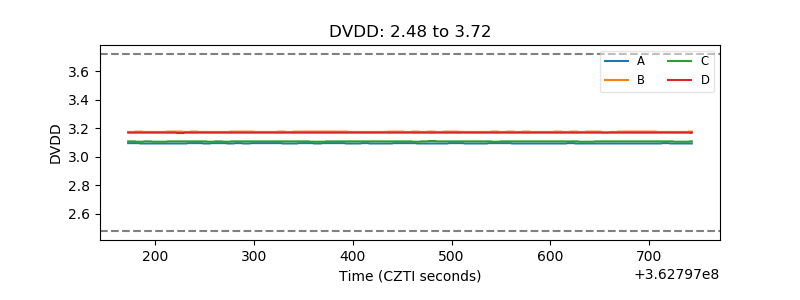 |
| Temperature 1 | 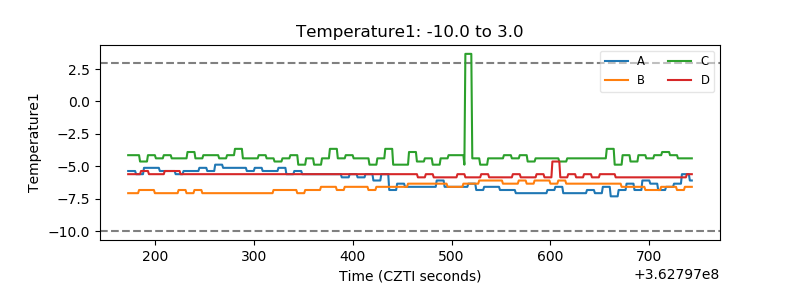 |
| Veto HV Monitor |  |
| Veto LLD | 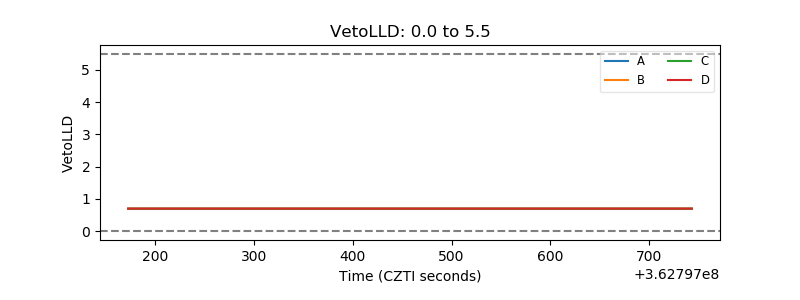 |
| Alpha Counter | 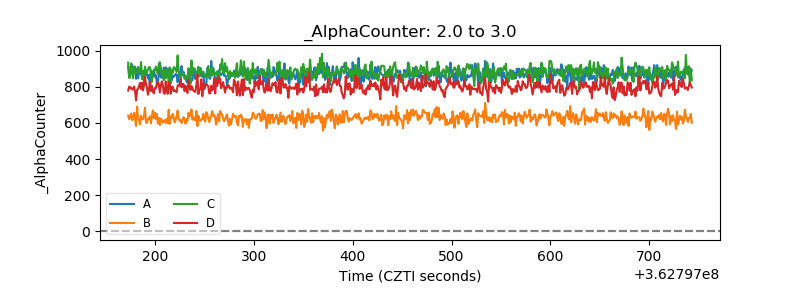 |
| _CPM_Rate | 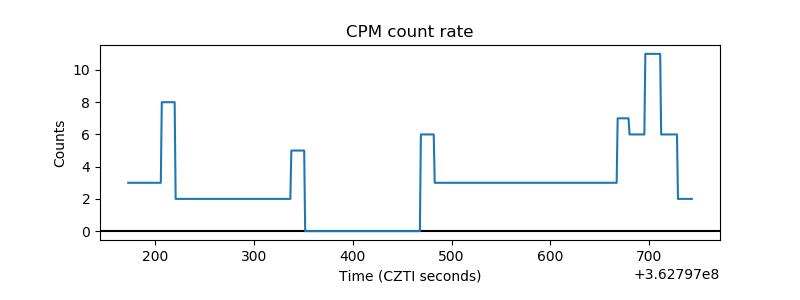 |
| CZT Counter | 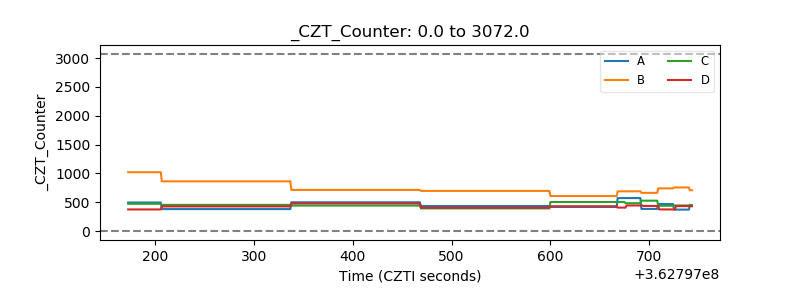 |
| +2.5 Volts monitor |  |
| +5 Volts monitor | 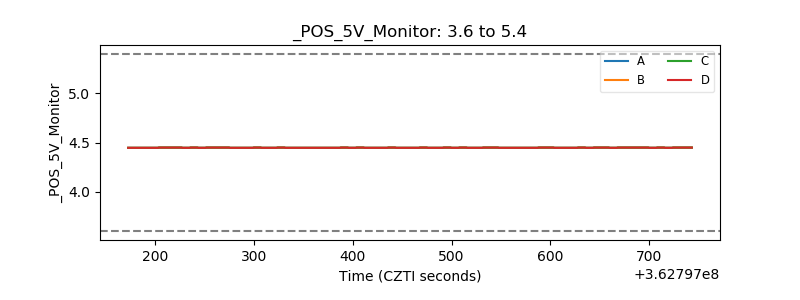 |
| _ROLL_ROT | 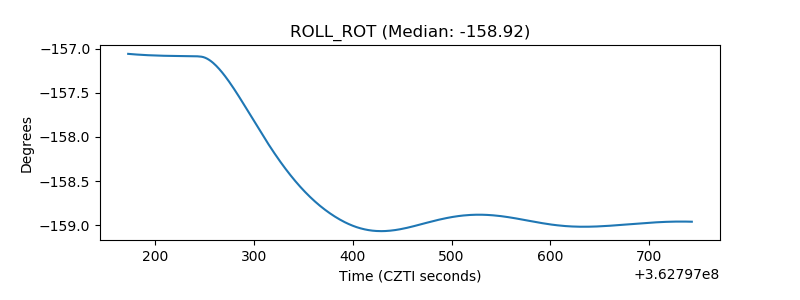 |
| _Roll_DEC | 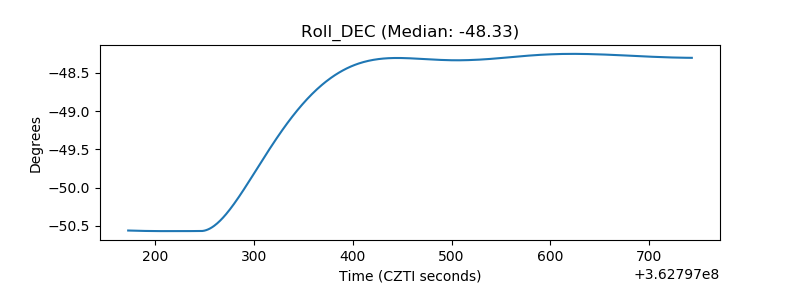 |
| _Roll_RA | 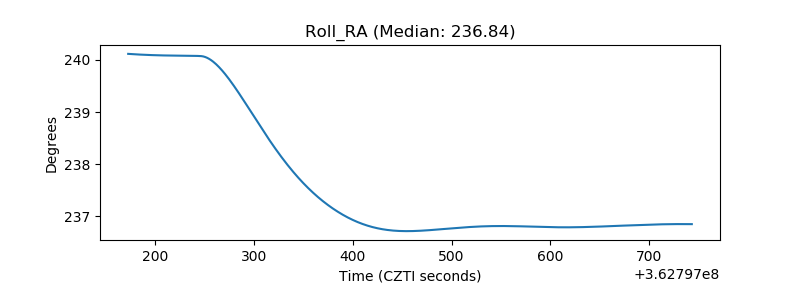 |
| Veto Counter | 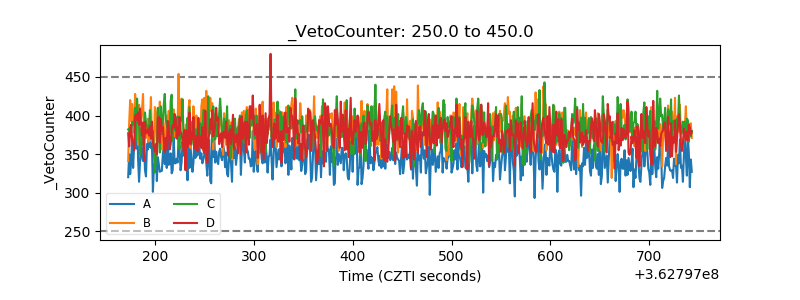 |