| Param | Original file | Final file |
|---|---|---|
| Filename | modeM0/AS1A10_053T26_9000004594_31520cztM0_level2.evt | modeM0/AS1A10_053T26_9000004594_31520cztM0_level2_quad_clean.evt |
| Size (bytes) | 460,972,800 | 59,011,200 |
| Size | 439.6 MB | 56.3 MB |
| Events in quadrant A | 2,417,355 | 374,570 |
| Events in quadrant B | 4,137,953 | 364,350 |
| Events in quadrant C | 2,807,401 | 353,072 |
| Events in quadrant D | 4,249,029 | 334,078 |
| Mode M0 | |||
|---|---|---|---|
| Quadrant | BADHDUFLAG | Total packets | Discarded packets |
| A | 0 | 10562 | 1 |
| B | 0 | 16137 | 1 |
| C | 0 | 11691 | 1 |
| D | 0 | 16105 | 1 |
| Mode SS | |||
|---|---|---|---|
| Quadrant | BADHDUFLAG | Total packets | Discarded packets |
| A | 0 | 106 | 0 |
| B | 0 | 106 | 0 |
| C | 0 | 106 | 0 |
| D | 0 | 106 | 0 |
| Mode M9 | |||
|---|---|---|---|
| Quadrant | BADHDUFLAG | Total packets | Discarded packets |
| A | 0 | 7 | 0 |
| B | 0 | 7 | 0 |
| C | 0 | 7 | 0 |
| D | 0 | 7 | 0 |
| Quadrant | Total seconds | Saturated seconds | Saturation percentage |
|---|---|---|---|
| A | 5141 | 36 | 0.700253% |
| B | 5141 | 129 | 2.509239% |
| C | 5141 | 139 | 2.703754% |
| D | 5141 | 276 | 5.368605% |
Noise dominated data is calculated using 1-second bins in cleaned event files. If a bin has >2000 counts, and if more than 50% of those come from <1% of pixels, then it is considered to be noise-dominated and hence unusable.
| Quadrant | # 1 sec bins | Bins with >0 counts | Bins with >2000 counts | High rate bins dominated by noise | Noise dominated (total time) | Noise dominated (detector-on time) | Marked lightcurve |
|---|---|---|---|---|---|---|---|
| A | 5851 | 5141 | 0 | 0 | 0.00% | 0.00% | 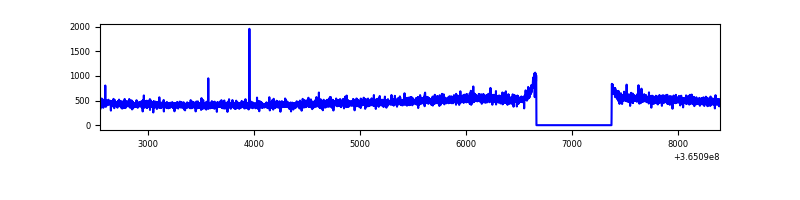 |
| B | 5851 | 5141 | 20 | 20 | 0.34% | 0.39% | 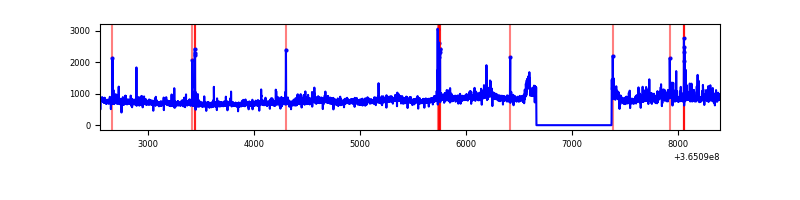 |
| C | 5851 | 5141 | 21 | 21 | 0.36% | 0.41% | 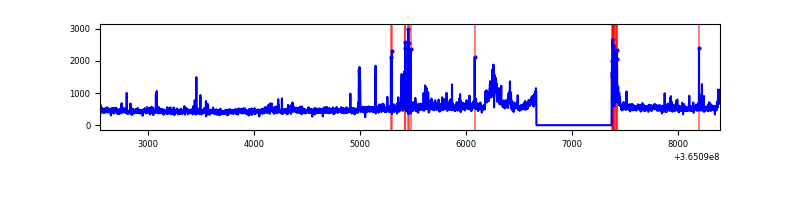 |
| D | 5851 | 5141 | 224 | 224 | 3.83% | 4.36% | 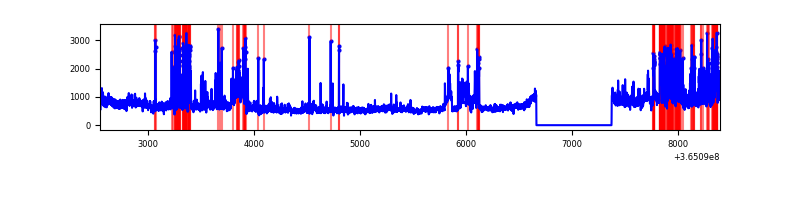 |
Top three noisy pixels from each quadrant. If the there are fewer than three noisy pixels in the level2.evt file, extra rows are filled as -1
| Pixel properties | Quadrant properties | ||||||
|---|---|---|---|---|---|---|---|
| Quadrant | DetID | PixID | Counts | Sigma | Mean | Median | Sigma |
| A | 13 | 254 | 10011 | 73.91 | 625 | 610 | 127.2 |
| A | 3 | 137 | 6516 | 46.43 | 625 | 610 | 127.2 |
| A | 0 | 226 | 5145 | 35.65 | 625 | 610 | 127.2 |
| B | 6 | 159 | 1438992 | 11925.93 | 614 | 597 | 120.6 |
| B | 4 | 80 | 149066 | 1230.98 | 614 | 597 | 120.6 |
| B | 0 | 190 | 33561 | 273.31 | 614 | 597 | 120.6 |
| C | 3 | 233 | 217390 | 1545.63 | 591 | 595 | 140.3 |
| C | 0 | 10 | 162859 | 1156.85 | 591 | 595 | 140.3 |
| C | 14 | 238 | 94229 | 667.56 | 591 | 595 | 140.3 |
| D | 8 | 195 | 1039013 | 7241.0 | 590 | 573 | 143.4 |
| D | 13 | 249 | 427929 | 2979.94 | 590 | 573 | 143.4 |
| D | 12 | 79 | 422032 | 2938.82 | 590 | 573 | 143.4 |
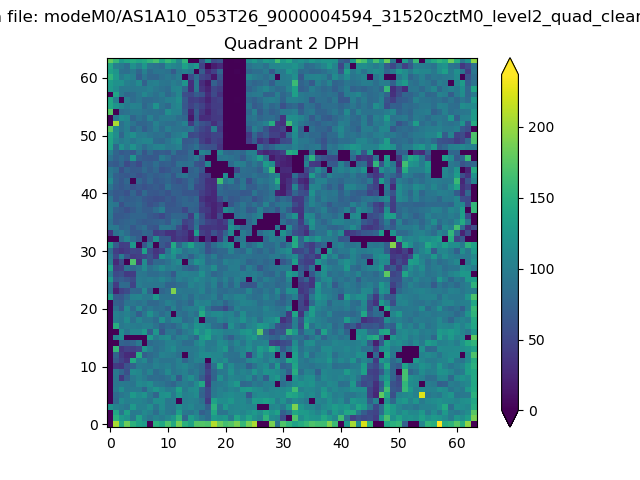
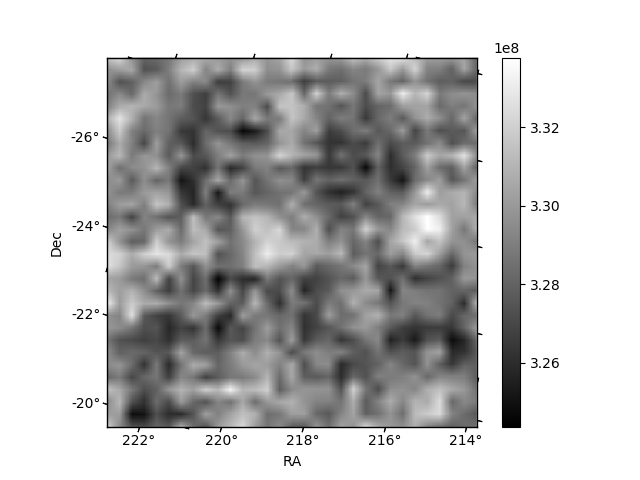
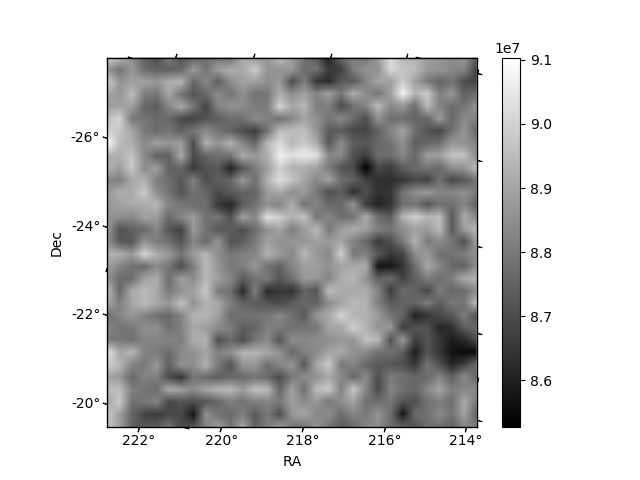
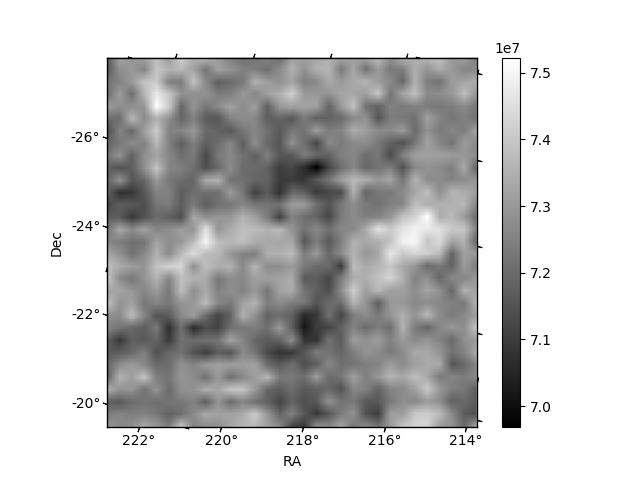
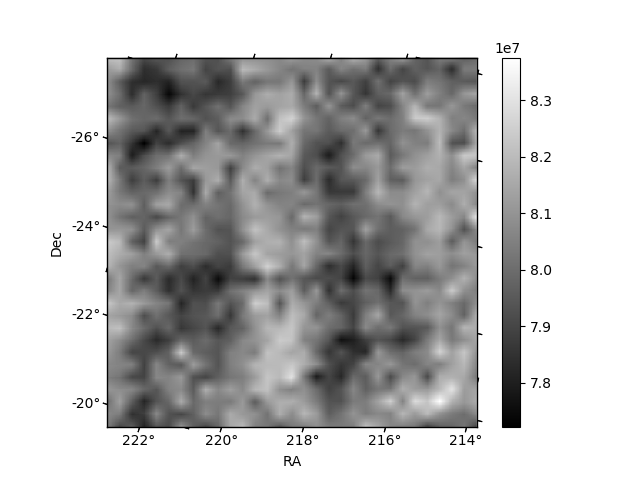
Histogram calculated using DETX and DETY for each event in the final _common_clean file
| Quadrant A | 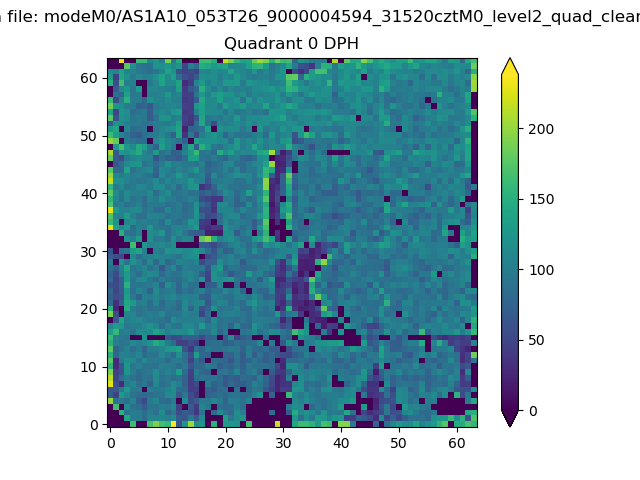 |
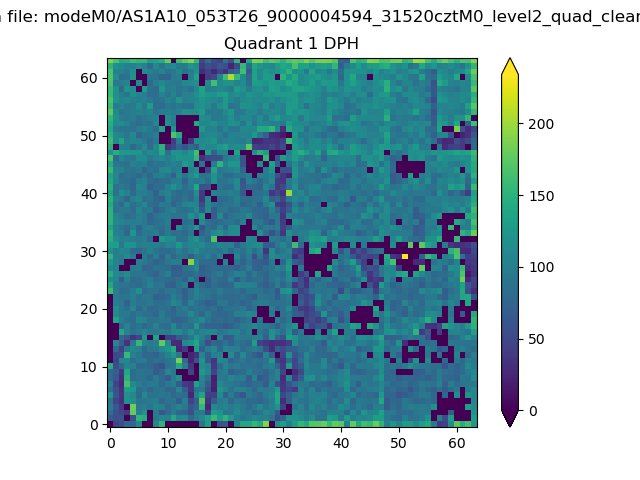 |
Quadrant B |
|---|---|---|---|
| Quadrant D | 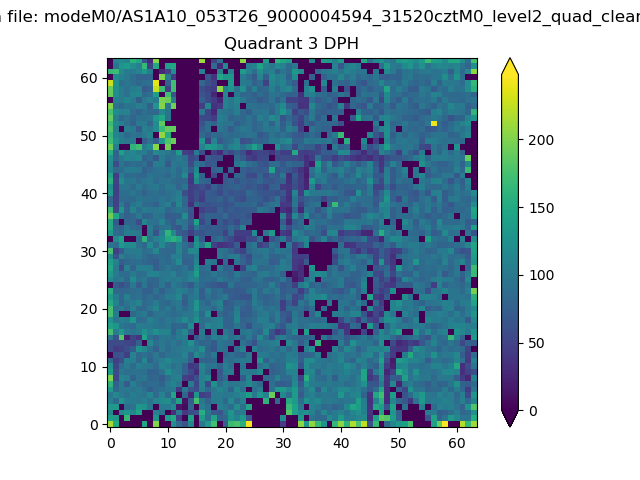 |
 |
Quadrant C |
| Plot type | Count rate plots | Images |
|---|---|---|
| Comparison with Poisson distribution Blue bars denote a histogram of data divided into 1 sec bins. Red curve is a Poisson curve with rate = median count rate of data. |
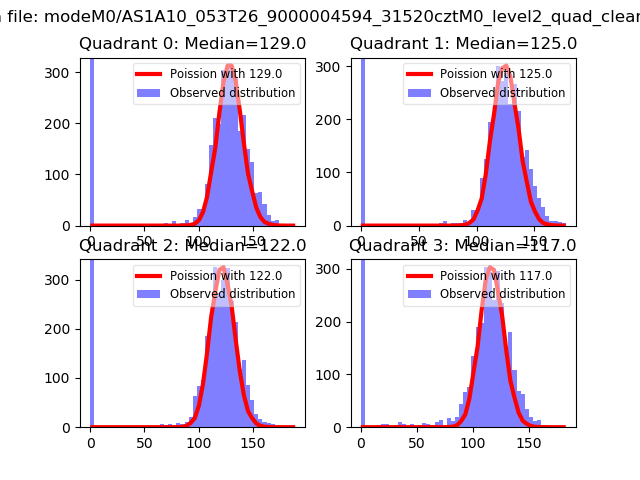 |
 |
| Quadrant-wise count rates Data is divided into 100 sec bins |
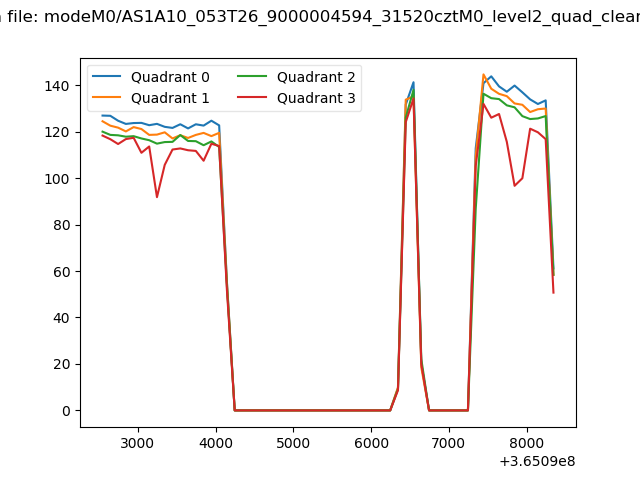 |
|
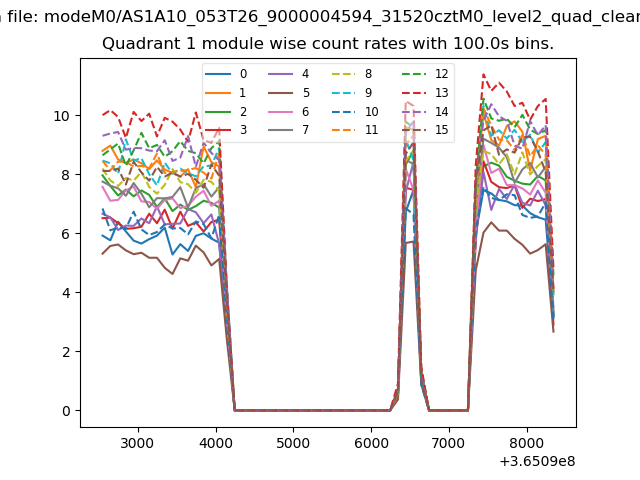
| Module-wise count rates for Quadrant A Data is divided into 100 sec bins |
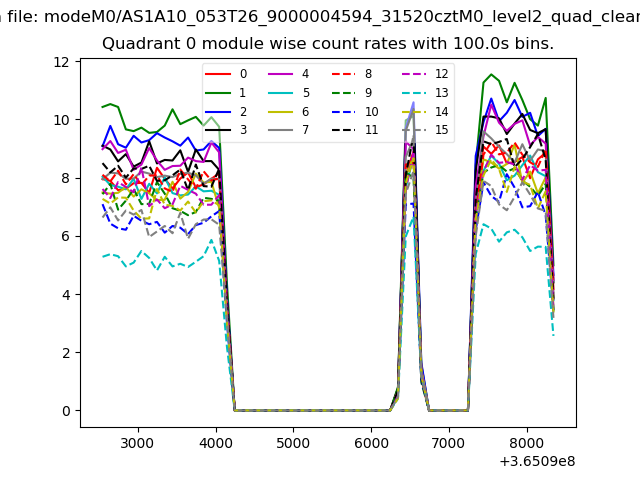 |
 |
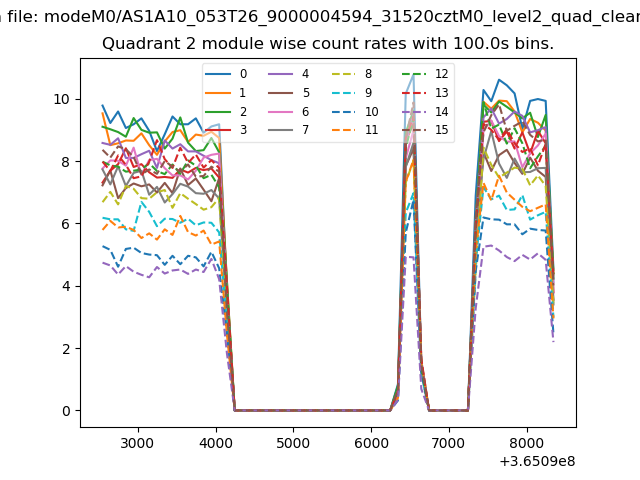
| Module-wise count rates for Quadrant B Data is divided into 100 sec bins |
 |
 |
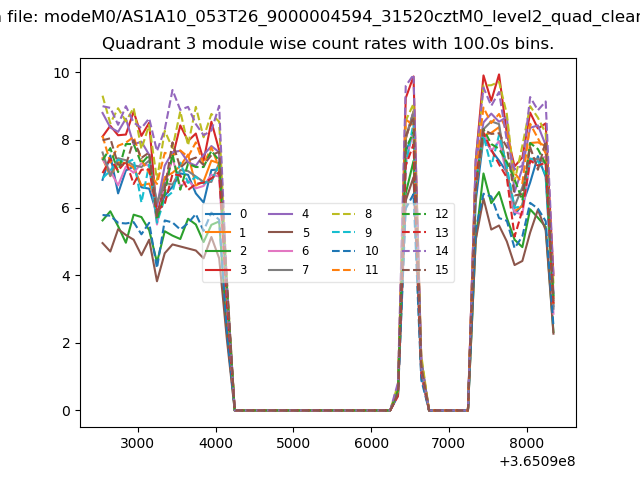
| Module-wise count rates for Quadrant C Data is divided into 100 sec bins |
 |
 |
| Module-wise count rates for Quadrant D Data is divided into 100 sec bins |
 |
 |
| Parameter | Plot |
|---|---|
| CZT HV Monitor | 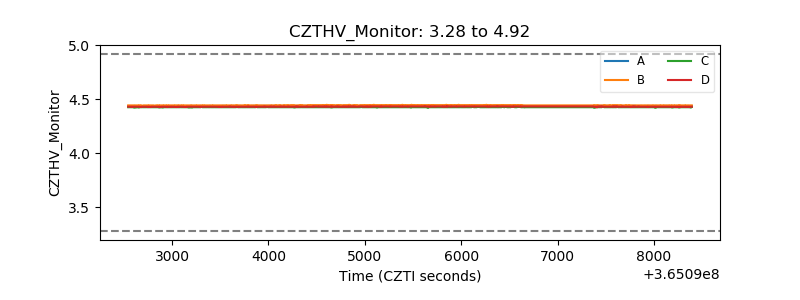 |
| D_VDD | 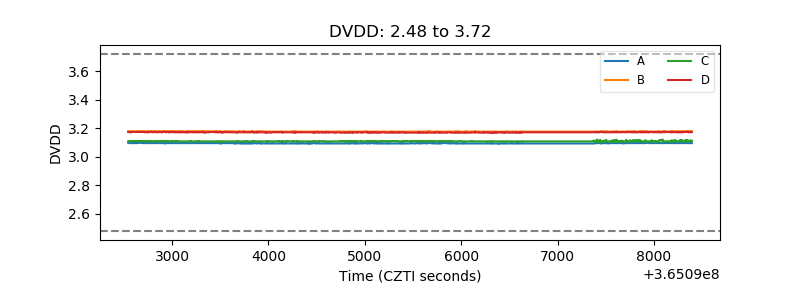 |
| Temperature 1 | 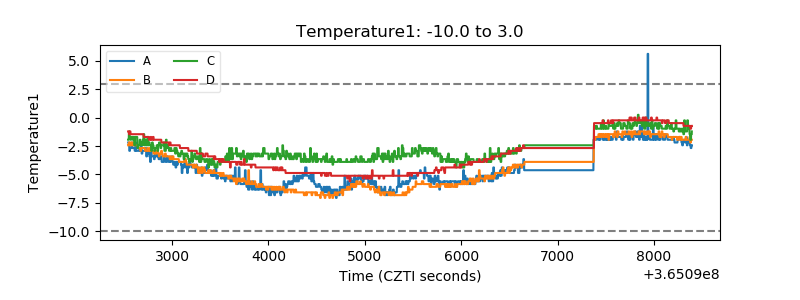 |
| Veto HV Monitor |  |
| Veto LLD |  |
| Alpha Counter | 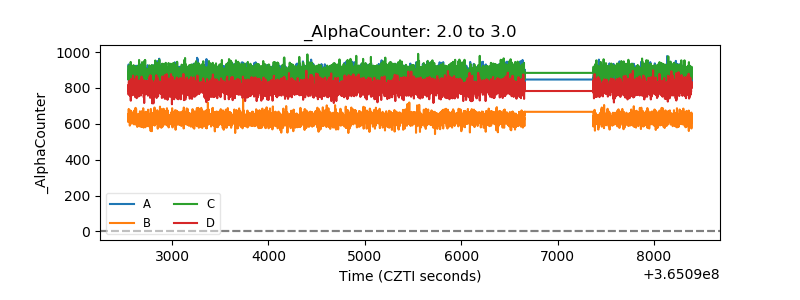 |
| _CPM_Rate | 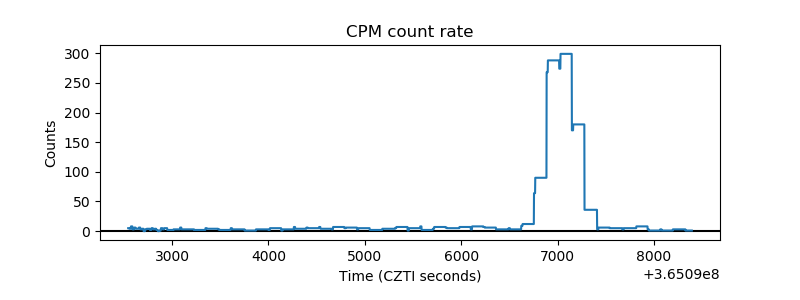 |
| CZT Counter | 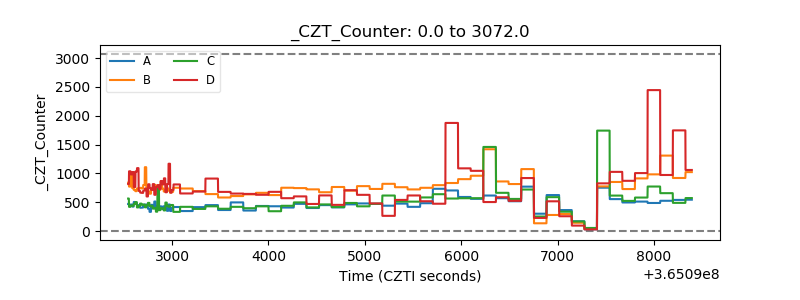 |
| +2.5 Volts monitor |  |
| +5 Volts monitor |  |
| _ROLL_ROT | 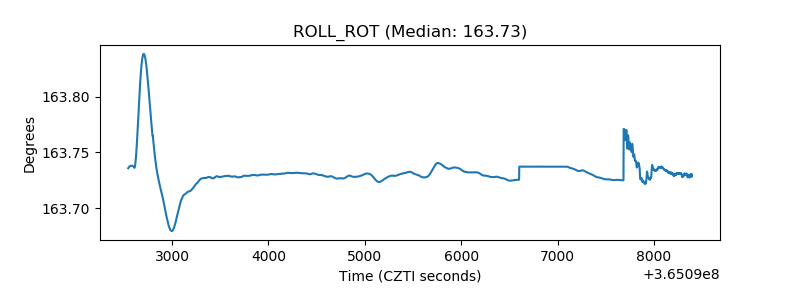 |
| _Roll_DEC | 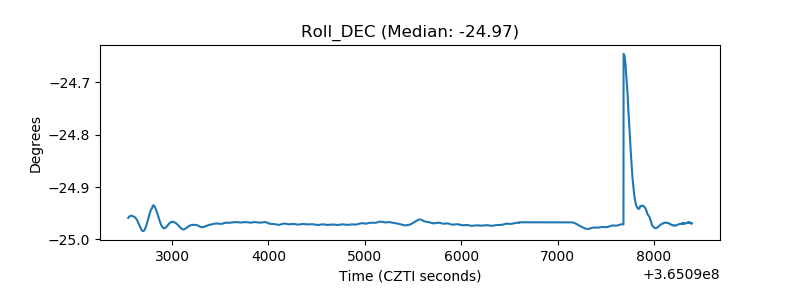 |
| _Roll_RA | 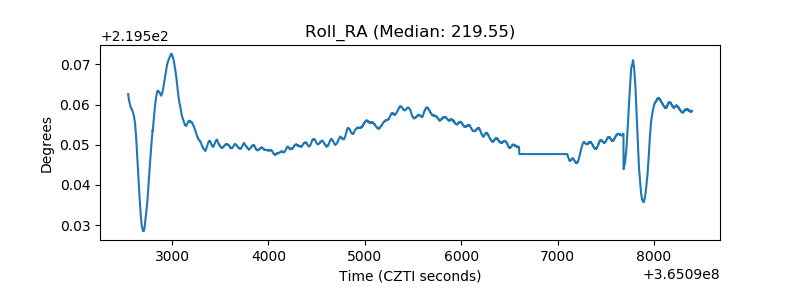 |
| Veto Counter | 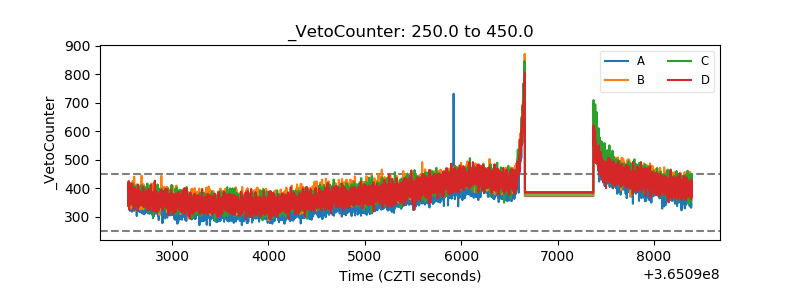 |