| Param | Original file | Final file |
|---|---|---|
| Filename | modeM0/AS1A10_094T75_9000004614cztM0_level2.fits | modeM0/AS1A10_094T75_9000004614cztM0_level2_quad_clean.evt |
| Size (bytes) | 65,943,360 | 83,551,680 |
| Size | 62.9 MB | 79.7 MB |
| Events in quadrant A | 379,414 | 481,459 |
| Events in quadrant B | 388,504 | 555,670 |
| Events in quadrant C | 399,488 | 547,715 |
| Events in quadrant D | 329,852 | 445,660 |
| Mode M9 | |||
|---|---|---|---|
| Quadrant | BADHDUFLAG | Total packets | Discarded packets |
| A | 0 | 16 | 0 |
| B | 0 | 16 | 0 |
| C | 0 | 16 | 0 |
| D | 0 | 16 | 0 |
| Mode M0 | |||
|---|---|---|---|
| Quadrant | BADHDUFLAG | Total packets | Discarded packets |
| A | 0 | 20484 | 0 |
| B | 0 | 22062 | 0 |
| C | 0 | 15181 | 0 |
| D | 0 | 21934 | 0 |
| Mode SS | |||
|---|---|---|---|
| Quadrant | BADHDUFLAG | Total packets | Discarded packets |
| A | 0 | 146 | 0 |
| B | 0 | 146 | 0 |
| C | 0 | 146 | 0 |
| D | 0 | 146 | 0 |
| Quadrant | Total seconds | Saturated seconds | Saturation percentage |
|---|---|---|---|
| A | 7169 | 1013 | 14.130283% |
| B | 7168 | 142 | 1.981027% |
| C | 7168 | 99 | 1.381138% |
| D | 7168 | 825 | 11.509487% |
Noise dominated data is calculated using 1-second bins in cleaned event files. If a bin has >2000 counts, and if more than 50% of those come from <1% of pixels, then it is considered to be noise-dominated and hence unusable.
| Quadrant | # 1 sec bins | Bins with >0 counts | Bins with >2000 counts | High rate bins dominated by noise | Noise dominated (total time) | Noise dominated (detector-on time) | Marked lightcurve |
|---|---|---|---|---|---|---|---|
| A | 11453 | 7051 | 0 | 0 | 0.00% | 0.00% |  |
| B | 11453 | 7166 | 0 | 0 | 0.00% | 0.00% | 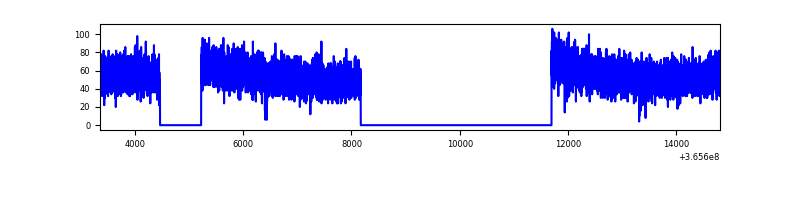 |
| C | 11454 | 7167 | 0 | 0 | 0.00% | 0.00% | 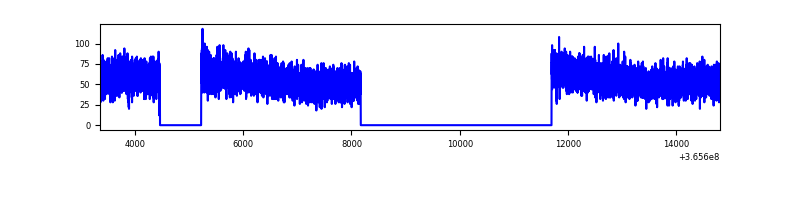 |
| D | 11453 | 7126 | 0 | 0 | 0.00% | 0.00% | 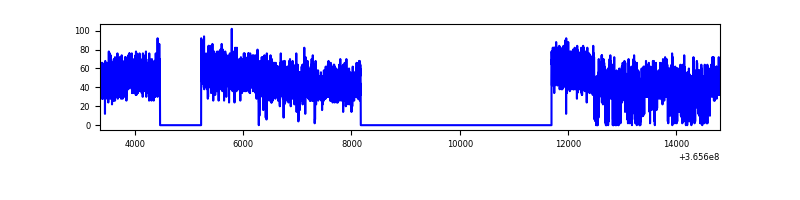 |
Top three noisy pixels from each quadrant. If the there are fewer than three noisy pixels in the level2.evt file, extra rows are filled as -1
| Pixel properties | Quadrant properties | ||||||
|---|---|---|---|---|---|---|---|
| Quadrant | DetID | PixID | Counts | Sigma | Mean | Median | Sigma |
| A | 0 | 29 | 312 | 8.35 | 99 | 93 | 26.2 |
| A | 9 | 19 | 298 | 7.81 | 99 | 93 | 26.2 |
| A | 0 | 30 | 291 | 7.55 | 99 | 93 | 26.2 |
| B | 2 | 9 | 300 | 8.96 | 103 | 99 | 22.4 |
| B | 3 | 80 | 271 | 7.67 | 103 | 99 | 22.4 |
| B | 2 | 245 | 256 | 7.0 | 103 | 99 | 22.4 |
| C | 12 | 241 | 308 | 7.25 | 105 | 99 | 28.8 |
| C | 3 | 126 | 289 | 6.59 | 105 | 99 | 28.8 |
| C | 3 | 187 | 278 | 6.21 | 105 | 99 | 28.8 |
| D | 3 | 14 | 260 | 6.49 | 94 | 85 | 27.0 |
| D | 15 | 47 | 258 | 6.42 | 94 | 85 | 27.0 |
| D | 4 | 160 | 257 | 6.38 | 94 | 85 | 27.0 |
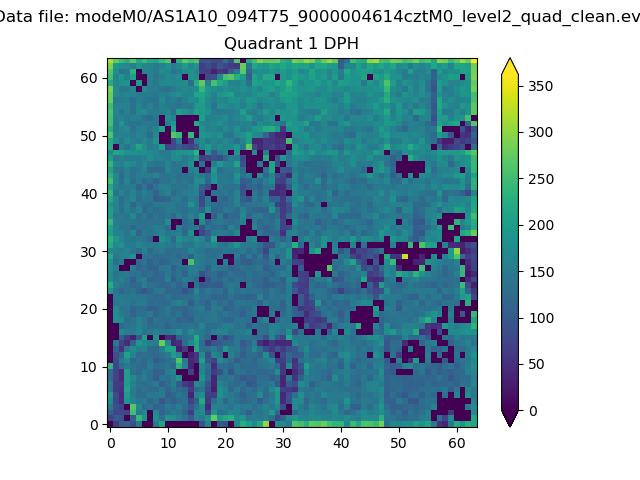
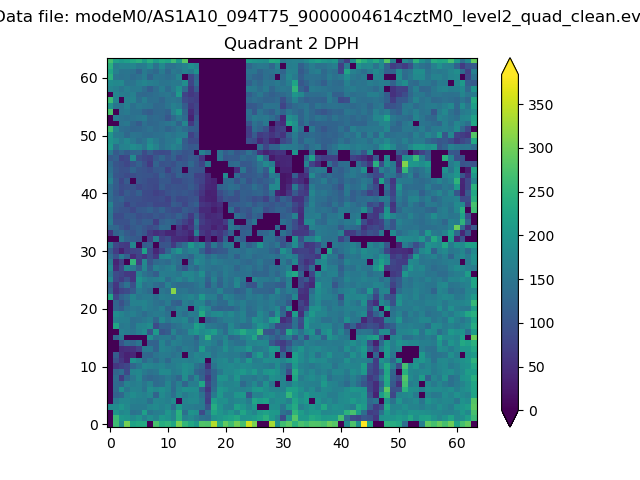
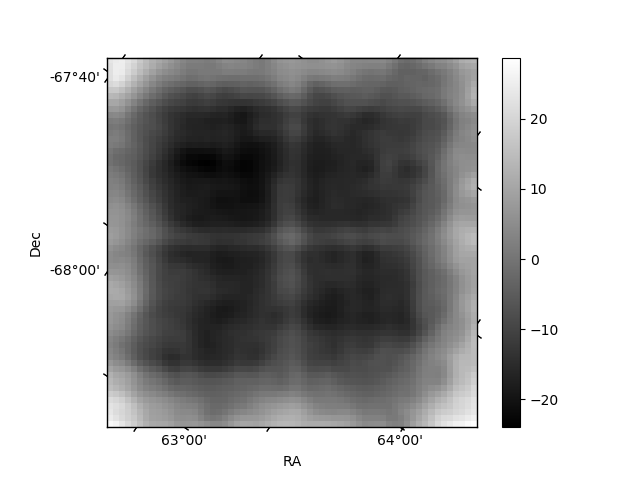
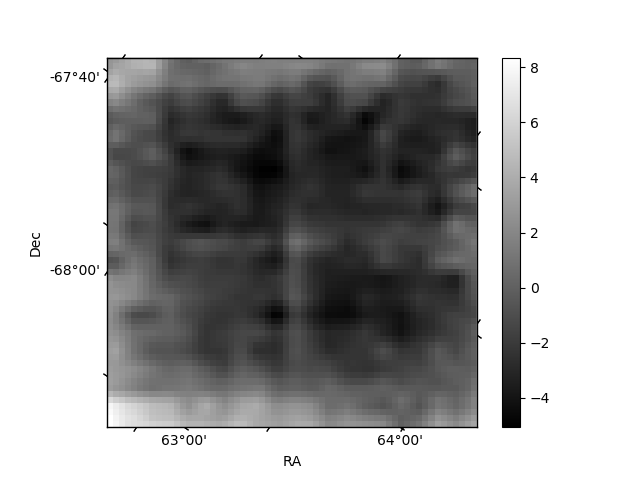
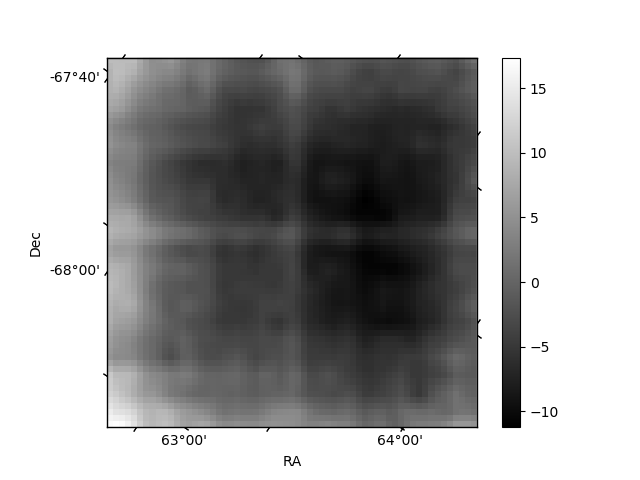
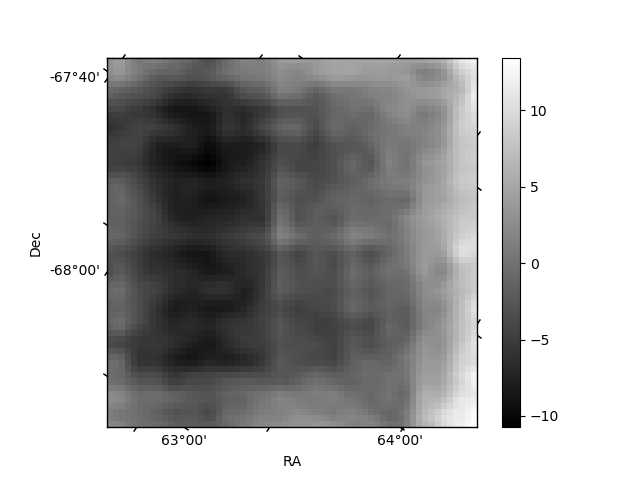
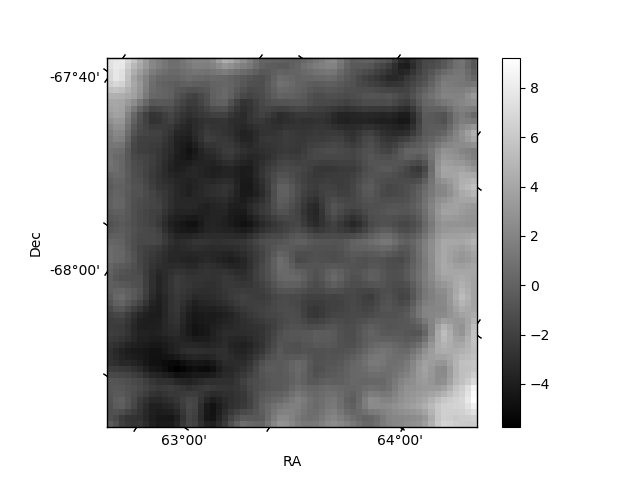
Histogram calculated using DETX and DETY for each event in the final _common_clean file
| Quadrant A | 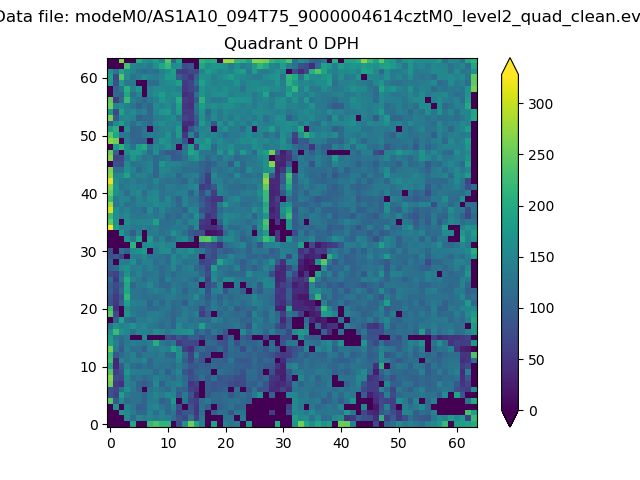 |
 |
Quadrant B |
|---|---|---|---|
| Quadrant D | 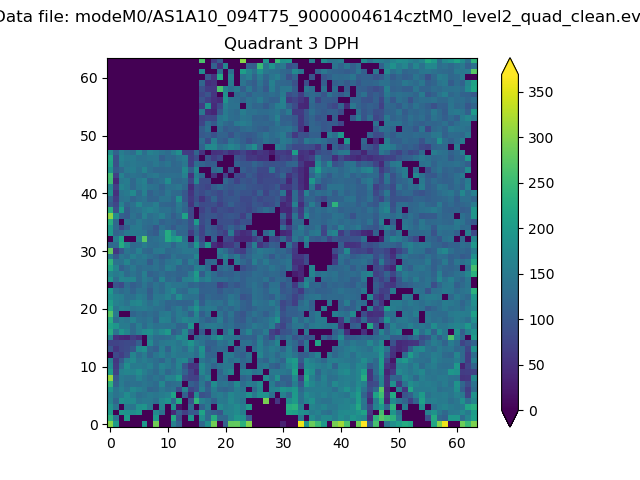 |
 |
Quadrant C |
| Plot type | Count rate plots | Images |
|---|---|---|
| Comparison with Poisson distribution Blue bars denote a histogram of data divided into 1 sec bins. Red curve is a Poisson curve with rate = median count rate of data. |
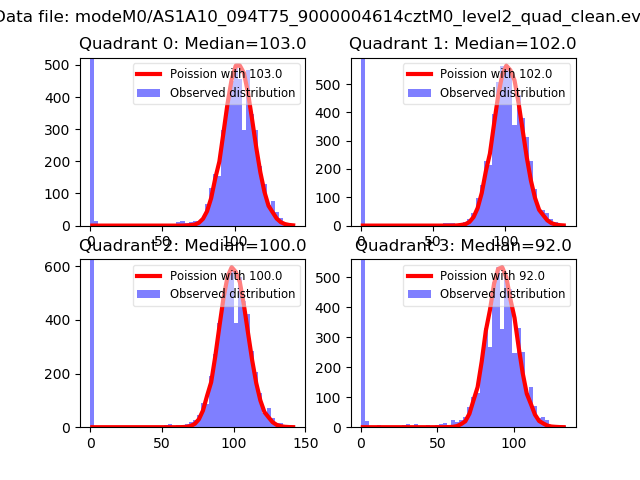 |
 |
| Quadrant-wise count rates Data is divided into 100 sec bins |
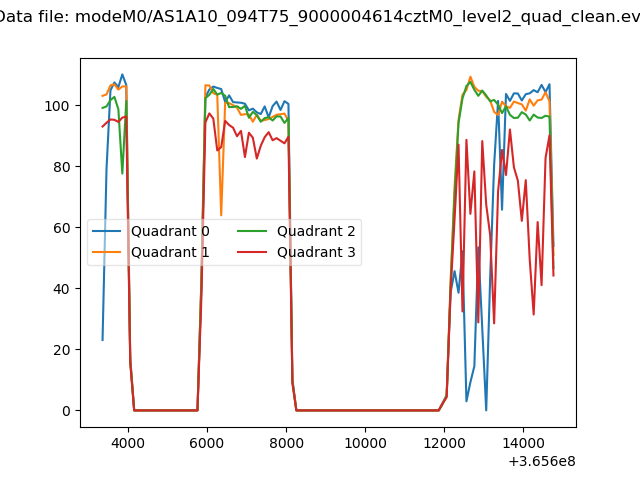 |
|
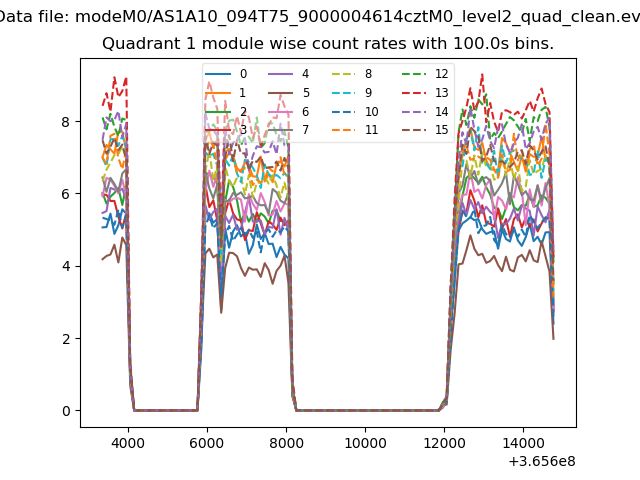
| Module-wise count rates for Quadrant A Data is divided into 100 sec bins |
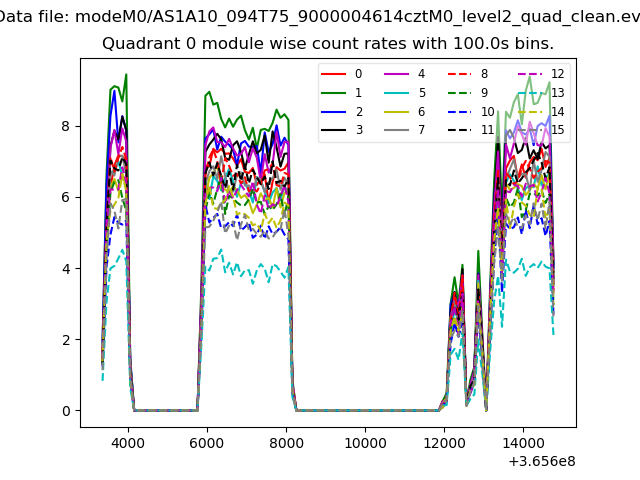 |
 |
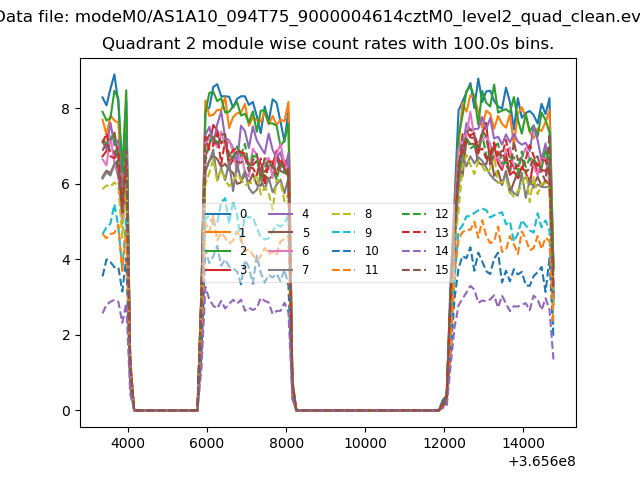
| Module-wise count rates for Quadrant B Data is divided into 100 sec bins |
 |
 |
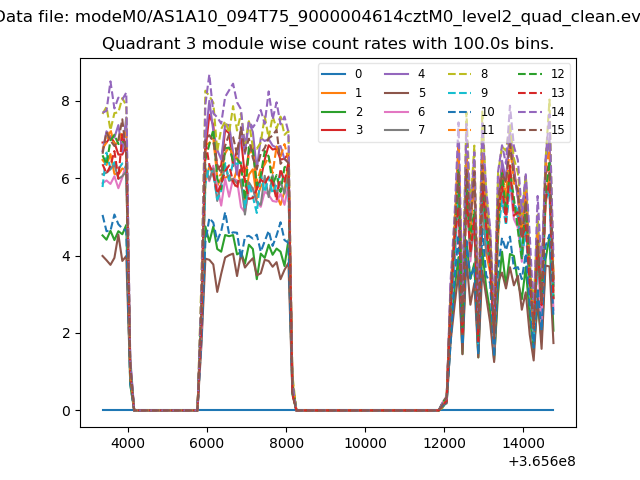
| Module-wise count rates for Quadrant C Data is divided into 100 sec bins |
 |
 |
| Module-wise count rates for Quadrant D Data is divided into 100 sec bins |
 |
 |
| Parameter | Plot |
|---|---|
| CZT HV Monitor |  |
| D_VDD | 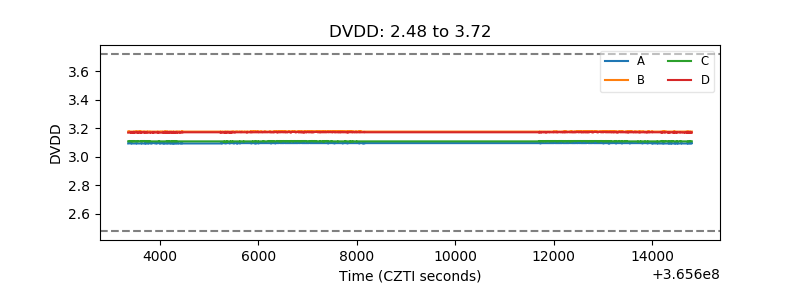 |
| Temperature 1 | 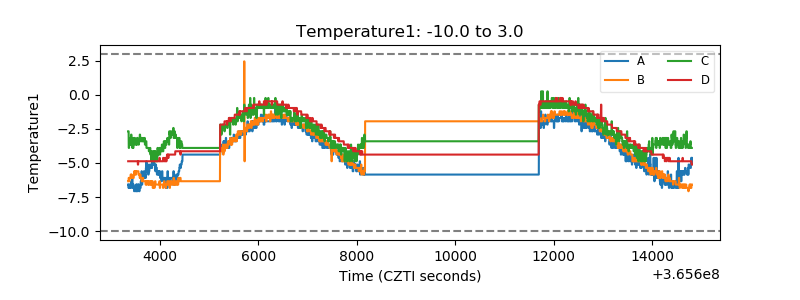 |
| Veto HV Monitor | 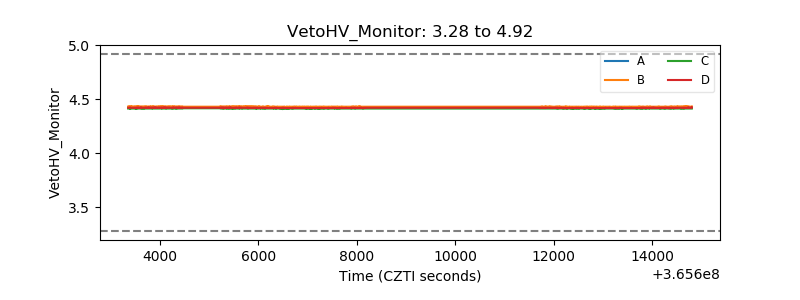 |
| Veto LLD | 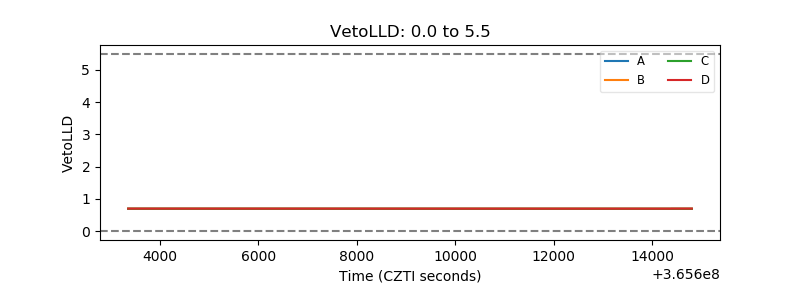 |
| Alpha Counter | 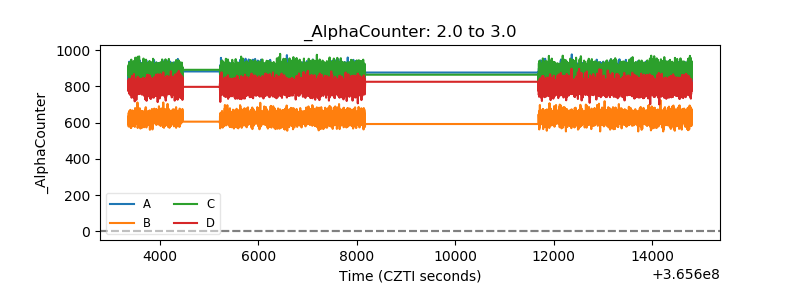 |
| _CPM_Rate | 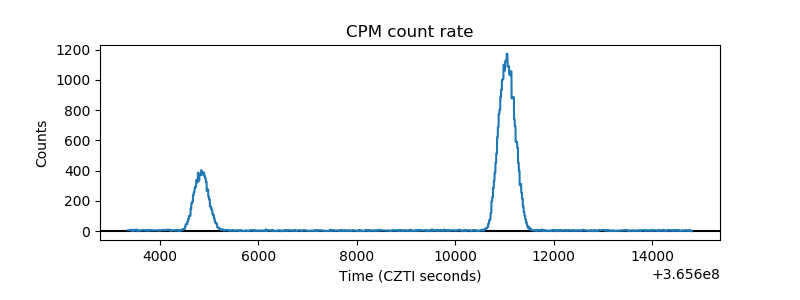 |
| CZT Counter | 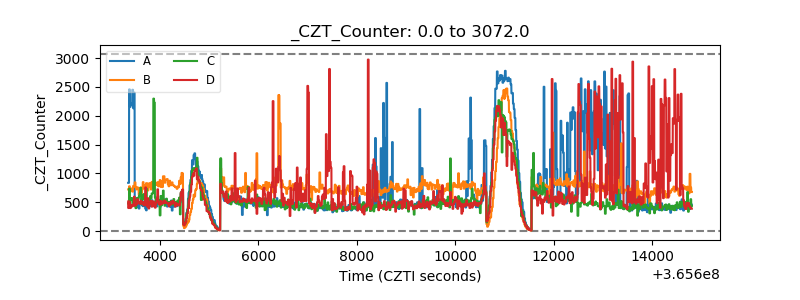 |
| +2.5 Volts monitor | 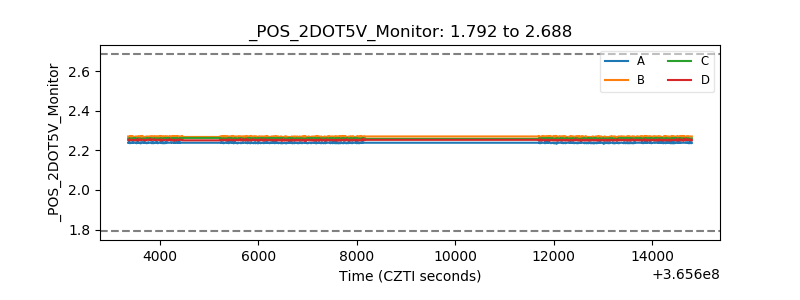 |
| +5 Volts monitor | 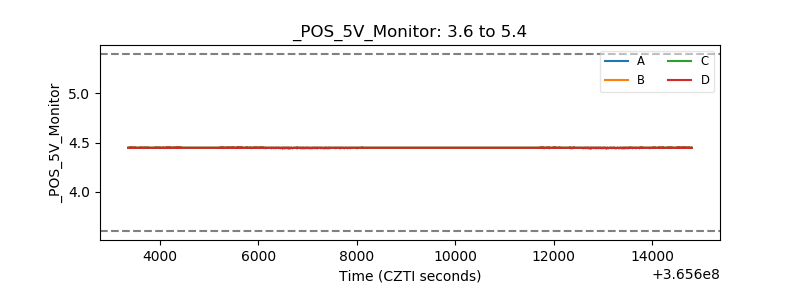 |
| _ROLL_ROT | 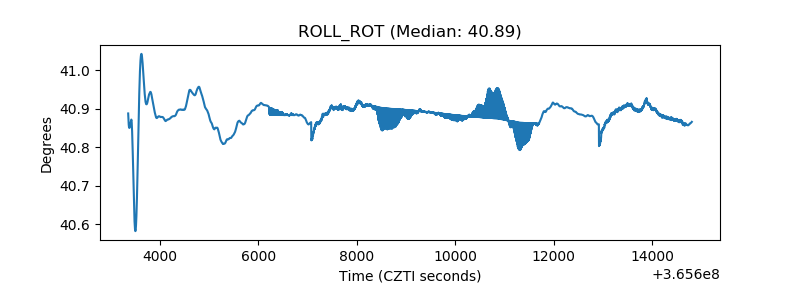 |
| _Roll_DEC | 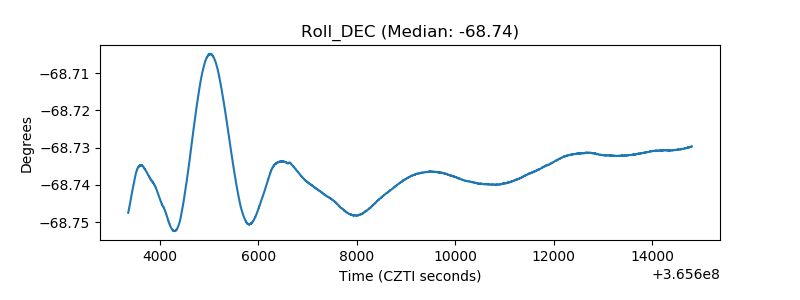 |
| _Roll_RA | 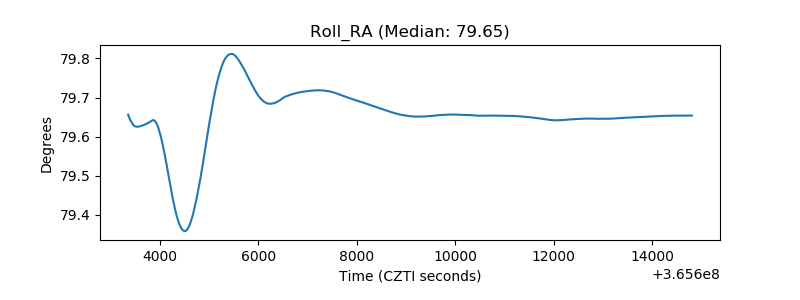 |
| Veto Counter | 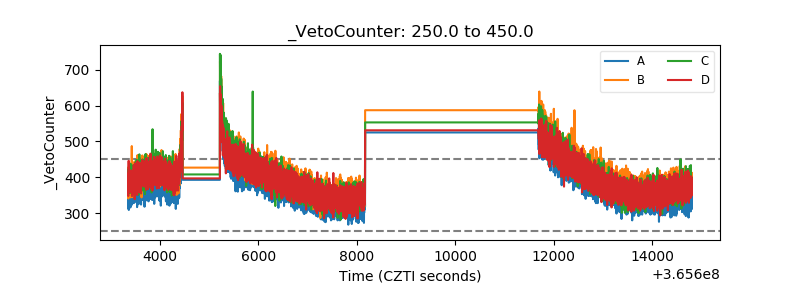 |