| Param | Original file | Final file |
|---|---|---|
| Filename | modeM0/AS1T04_051T01_9000004686_32147cztM0_level2.evt | modeM0/AS1T04_051T01_9000004686_32147cztM0_level2_quad_clean.evt |
| Size (bytes) | 72,374,400 | 13,881,600 |
| Size | 69.0 MB | 13.2 MB |
| Events in quadrant A | 345,593 | 98,288 |
| Events in quadrant B | 711,060 | 95,831 |
| Events in quadrant C | 426,494 | 90,607 |
| Events in quadrant D | 667,268 | 87,590 |
| Mode M9 | |||
|---|---|---|---|
| Quadrant | BADHDUFLAG | Total packets | Discarded packets |
| A | 0 | 5 | 0 |
| B | 0 | 6 | 0 |
| C | 0 | 6 | 0 |
| D | 0 | 6 | 0 |
| Mode M0 | |||
|---|---|---|---|
| Quadrant | BADHDUFLAG | Total packets | Discarded packets |
| A | 0 | 1404 | 1 |
| B | 0 | 2520 | 1 |
| C | 0 | 1655 | 1 |
| D | 0 | 2364 | 1 |
| Mode SS | |||
|---|---|---|---|
| Quadrant | BADHDUFLAG | Total packets | Discarded packets |
| A | 0 | 12 | 0 |
| B | 0 | 12 | 0 |
| C | 0 | 12 | 0 |
| D | 0 | 12 | 0 |
| Quadrant | Total seconds | Saturated seconds | Saturation percentage |
|---|---|---|---|
| A | 566 | 1 | 0.176678% |
| B | 566 | 75 | 13.250883% |
| C | 566 | 54 | 9.540636% |
| D | 566 | 26 | 4.593640% |
Noise dominated data is calculated using 1-second bins in cleaned event files. If a bin has >2000 counts, and if more than 50% of those come from <1% of pixels, then it is considered to be noise-dominated and hence unusable.
| Quadrant | # 1 sec bins | Bins with >0 counts | Bins with >2000 counts | High rate bins dominated by noise | Noise dominated (total time) | Noise dominated (detector-on time) | Marked lightcurve |
|---|---|---|---|---|---|---|---|
| A | 566 | 566 | 0 | 0 | 0.00% | 0.00% | 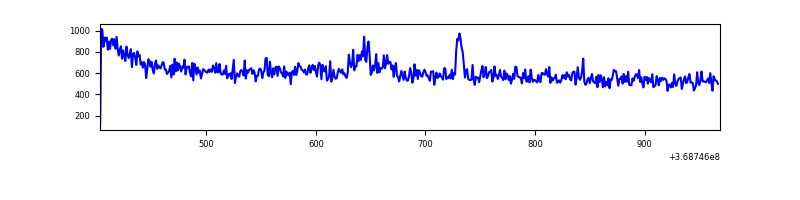 |
| B | 566 | 566 | 23 | 23 | 4.06% | 4.06% | 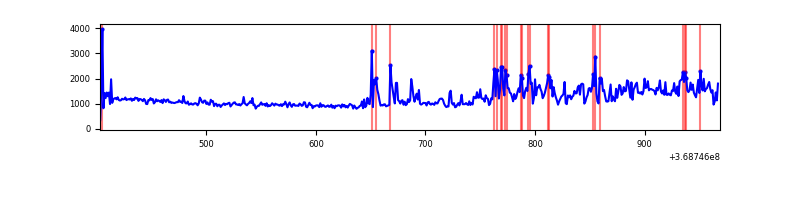 |
| C | 566 | 566 | 26 | 26 | 4.59% | 4.59% | 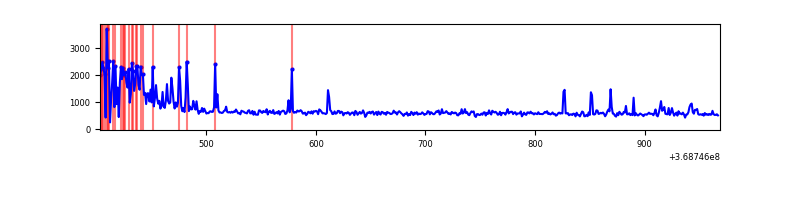 |
| D | 566 | 566 | 19 | 19 | 3.36% | 3.36% | 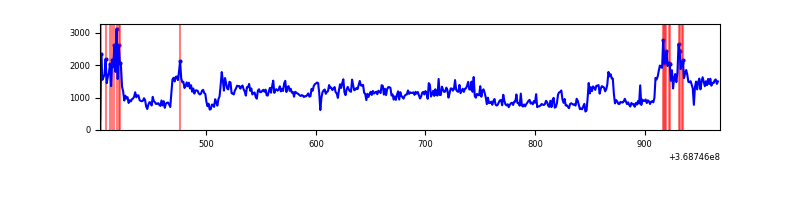 |
Top three noisy pixels from each quadrant. If the there are fewer than three noisy pixels in the level2.evt file, extra rows are filled as -1
| Pixel properties | Quadrant properties | ||||||
|---|---|---|---|---|---|---|---|
| Quadrant | DetID | PixID | Counts | Sigma | Mean | Median | Sigma |
| A | 12 | 189 | 9812 | 504.14 | 86 | 84 | 19.3 |
| A | 13 | 6 | 2439 | 122.05 | 86 | 84 | 19.3 |
| A | 13 | 254 | 1223 | 59.03 | 86 | 84 | 19.3 |
| B | 6 | 159 | 173657 | 9693.08 | 84 | 82 | 17.9 |
| B | 10 | 245 | 122326 | 6826.56 | 84 | 82 | 17.9 |
| B | 5 | 172 | 57693 | 3217.21 | 84 | 82 | 17.9 |
| C | 0 | 10 | 101638 | 5078.41 | 77 | 77 | 20.0 |
| C | 14 | 238 | 14468 | 719.6 | 77 | 77 | 20.0 |
| C | 14 | 254 | 2623 | 127.31 | 77 | 77 | 20.0 |
| D | 8 | 195 | 298997 | 14319.92 | 79 | 76 | 20.9 |
| D | 12 | 233 | 21683 | 1035.09 | 79 | 76 | 20.9 |
| D | 14 | 52 | 18311 | 873.55 | 79 | 76 | 20.9 |
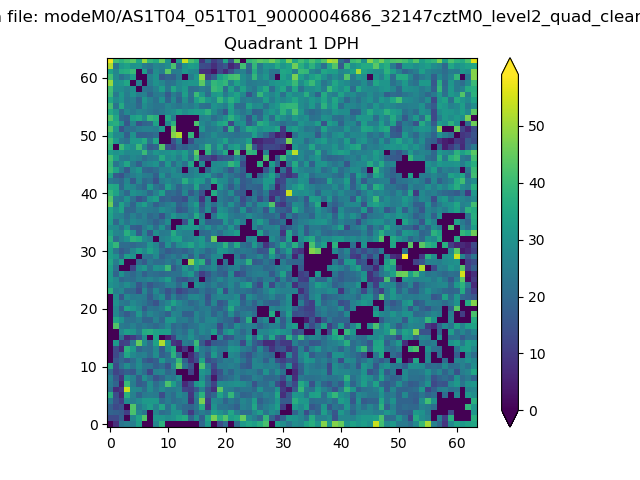
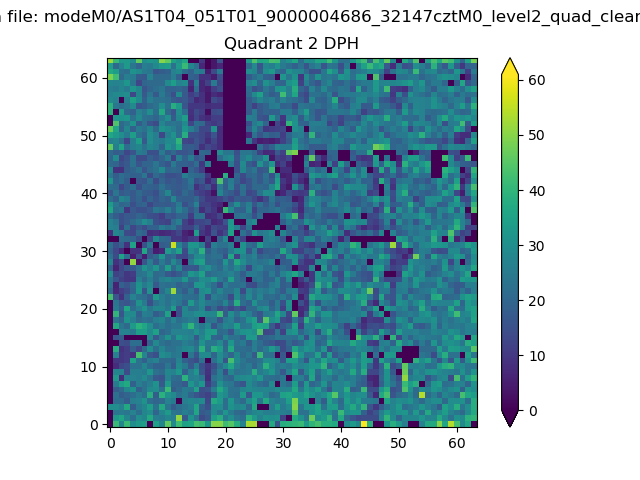
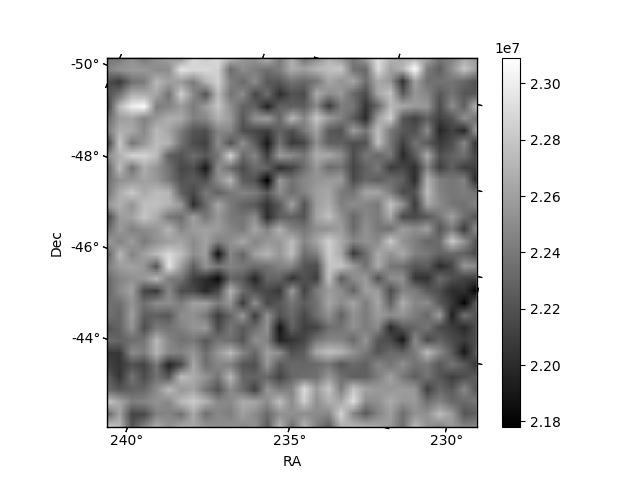
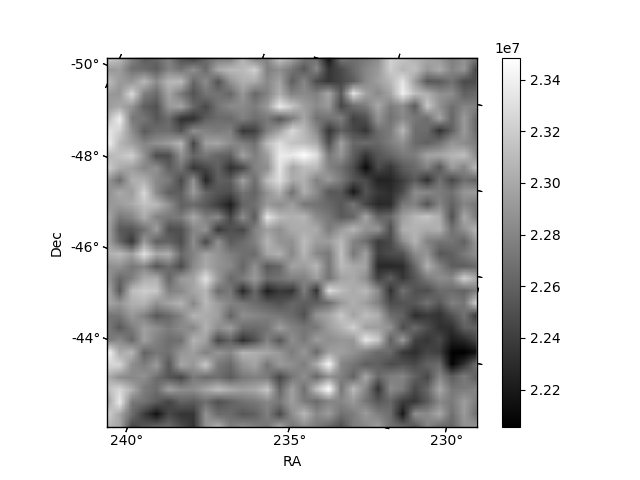
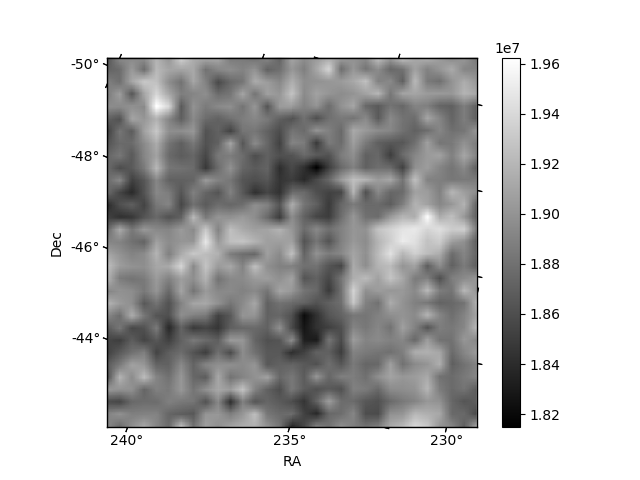
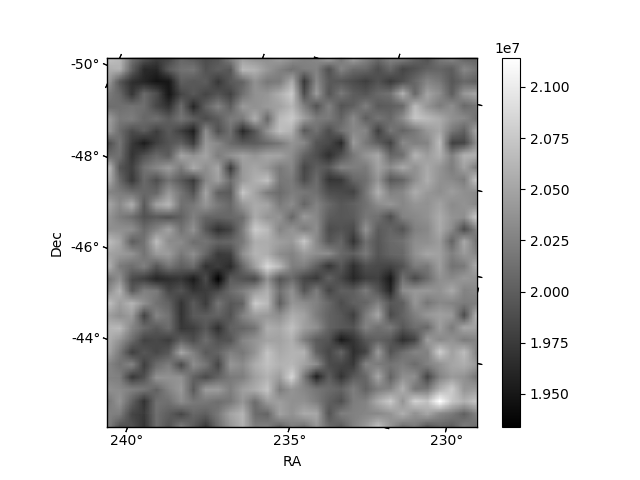
Histogram calculated using DETX and DETY for each event in the final _common_clean file
| Quadrant A |  |
 |
Quadrant B |
|---|---|---|---|
| Quadrant D |  |
 |
Quadrant C |
| Plot type | Count rate plots | Images |
|---|---|---|
| Comparison with Poisson distribution Blue bars denote a histogram of data divided into 1 sec bins. Red curve is a Poisson curve with rate = median count rate of data. |
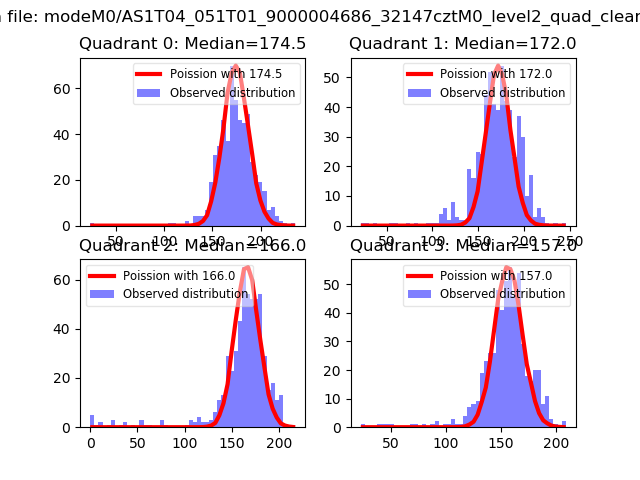 |
 |
| Quadrant-wise count rates Data is divided into 100 sec bins |
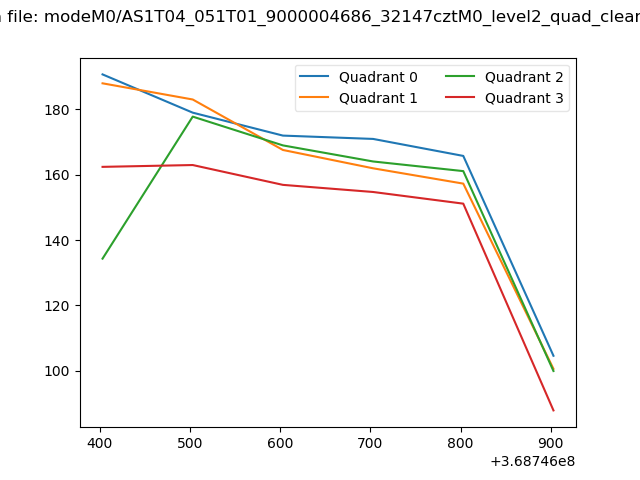 |
|
| Module-wise count rates for Quadrant A Data is divided into 100 sec bins |
 |
 |
| Module-wise count rates for Quadrant B Data is divided into 100 sec bins |
 |
 |
| Module-wise count rates for Quadrant C Data is divided into 100 sec bins |
 |
 |
| Module-wise count rates for Quadrant D Data is divided into 100 sec bins |
 |
 |
| Parameter | Plot |
|---|---|
| CZT HV Monitor |  |
| D_VDD | 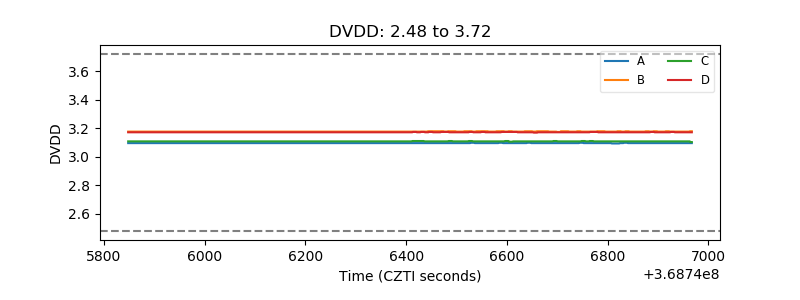 |
| Temperature 1 | 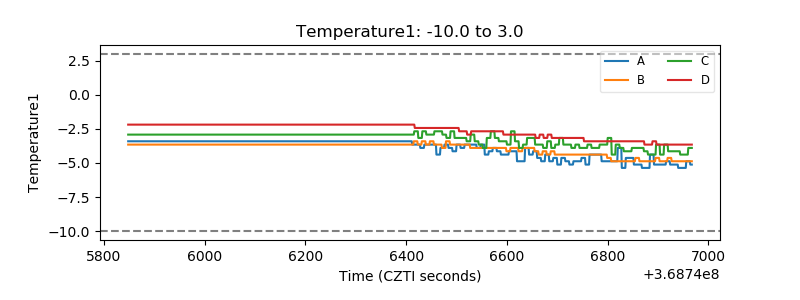 |
| Veto HV Monitor | 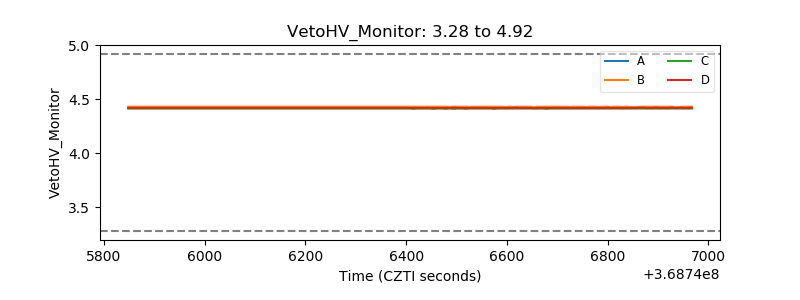 |
| Veto LLD | 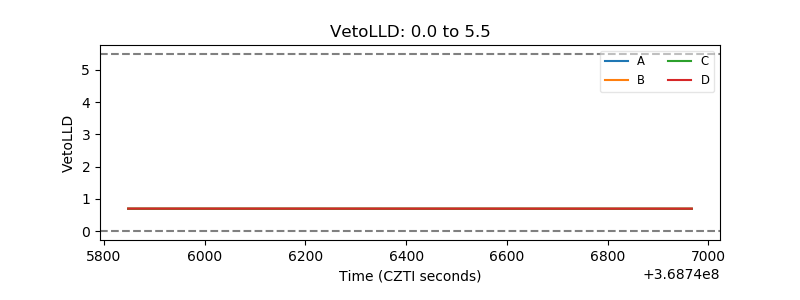 |
| Alpha Counter |  |
| _CPM_Rate | 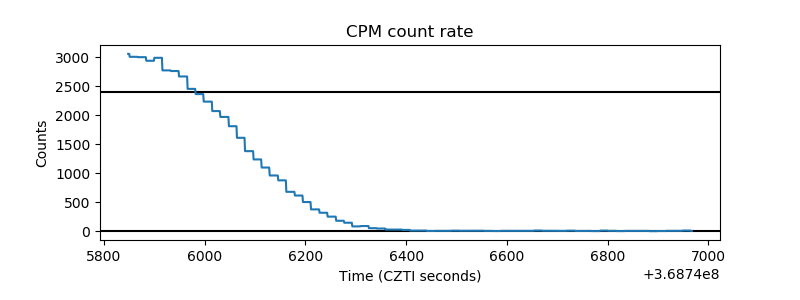 |
| CZT Counter | 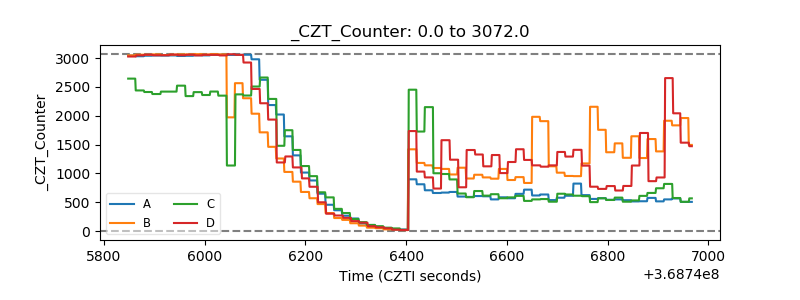 |
| +2.5 Volts monitor |  |
| +5 Volts monitor | 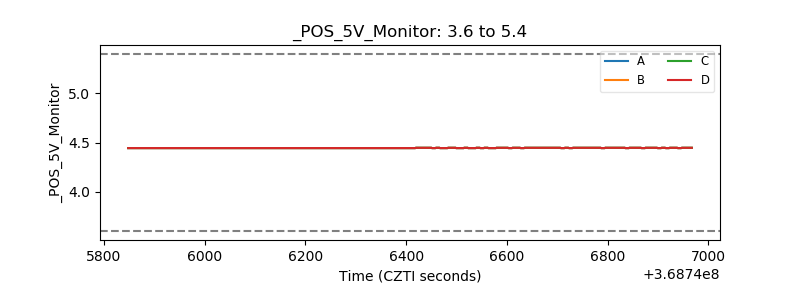 |
| _ROLL_ROT |  |
| _Roll_DEC | 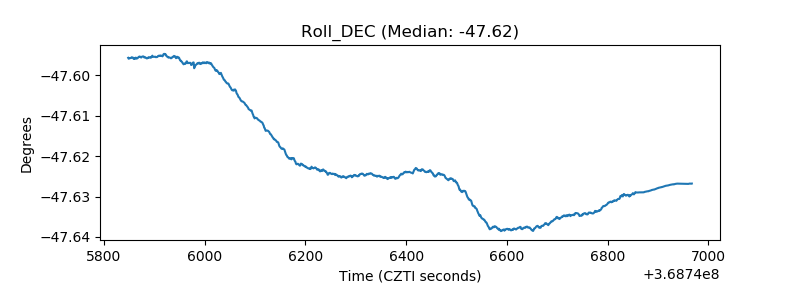 |
| _Roll_RA | 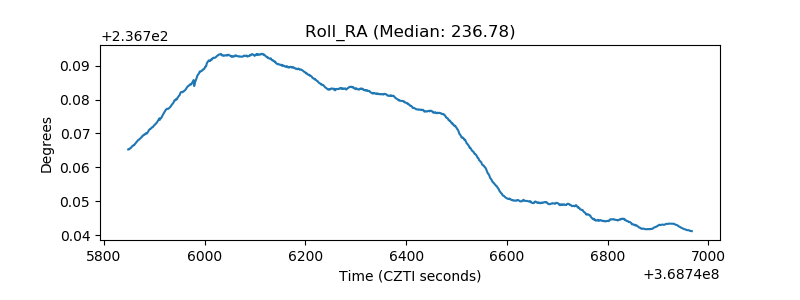 |
| Veto Counter | 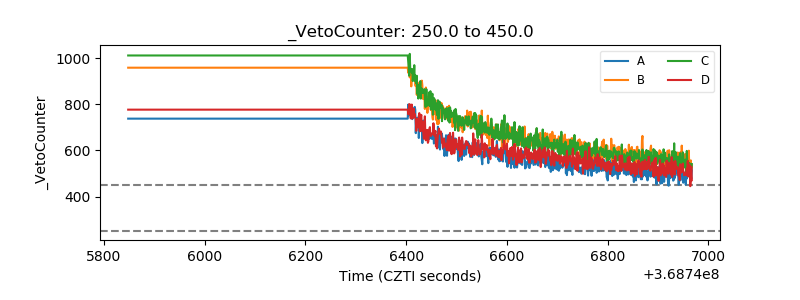 |