| Param | Original file | Final file |
|---|---|---|
| Filename | modeM0/AS1T05_009T01_9000005168cztM0_level2.fits | modeM0/AS1T05_009T01_9000005168cztM0_level2_quad_clean.evt |
| Size (bytes) | 63,884,160 | 55,540,800 |
| Size | 60.9 MB | 53.0 MB |
| Events in quadrant A | 391,798 | 319,220 |
| Events in quadrant B | 376,870 | 320,185 |
| Events in quadrant C | 381,266 | 301,311 |
| Events in quadrant D | 327,590 | 283,102 |
| Mode M0 | |||
|---|---|---|---|
| Quadrant | BADHDUFLAG | Total packets | Discarded packets |
| A | 0 | 13431 | 0 |
| B | 0 | 14698 | 0 |
| C | 0 | 17373 | 0 |
| D | 0 | 16397 | 0 |
| Mode SS | |||
|---|---|---|---|
| Quadrant | BADHDUFLAG | Total packets | Discarded packets |
| A | 0 | 132 | 0 |
| B | 0 | 132 | 0 |
| C | 0 | 132 | 0 |
| D | 0 | 132 | 0 |
| Mode M9 | |||
|---|---|---|---|
| Quadrant | BADHDUFLAG | Total packets | Discarded packets |
| A | 0 | 20 | 0 |
| B | 0 | 20 | 0 |
| C | 0 | 20 | 0 |
| D | 0 | 20 | 0 |
| Quadrant | Total seconds | Saturated seconds | Saturation percentage |
|---|---|---|---|
| A | 6562 | 9 | 0.137153% |
| B | 6562 | 74 | 1.127705% |
| C | 6562 | 243 | 3.703139% |
| D | 6562 | 188 | 2.864980% |
Noise dominated data is calculated using 1-second bins in cleaned event files. If a bin has >2000 counts, and if more than 50% of those come from <1% of pixels, then it is considered to be noise-dominated and hence unusable.
| Quadrant | # 1 sec bins | Bins with >0 counts | Bins with >2000 counts | High rate bins dominated by noise | Noise dominated (total time) | Noise dominated (detector-on time) | Marked lightcurve |
|---|---|---|---|---|---|---|---|
| A | 8535 | 6562 | 0 | 0 | 0.00% | 0.00% | 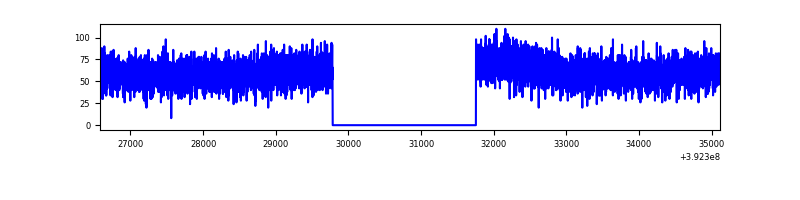 |
| B | 8535 | 6562 | 0 | 0 | 0.00% | 0.00% | 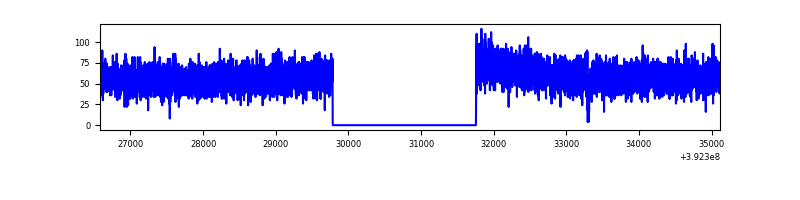 |
| C | 8535 | 6562 | 0 | 0 | 0.00% | 0.00% | 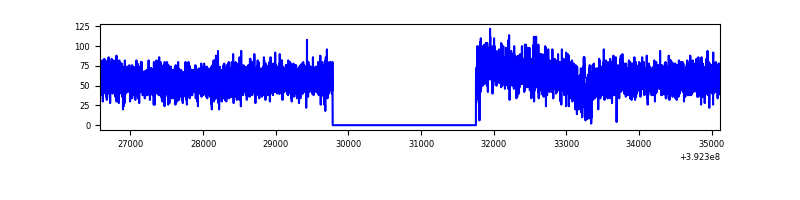 |
| D | 8535 | 6557 | 0 | 0 | 0.00% | 0.00% | 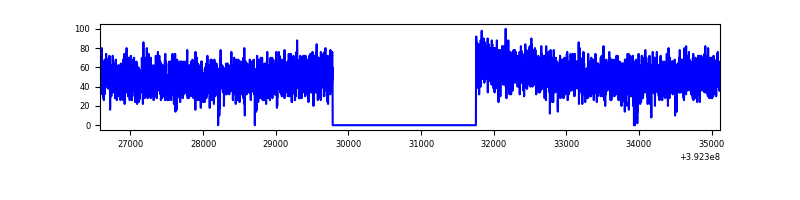 |
Top three noisy pixels from each quadrant. If the there are fewer than three noisy pixels in the level2.evt file, extra rows are filled as -1
| Pixel properties | Quadrant properties | ||||||
|---|---|---|---|---|---|---|---|
| Quadrant | DetID | PixID | Counts | Sigma | Mean | Median | Sigma |
| A | 9 | 19 | 327 | 8.5 | 102 | 97 | 27.1 |
| A | 0 | 29 | 322 | 8.31 | 102 | 97 | 27.1 |
| A | 14 | 95 | 311 | 7.9 | 102 | 97 | 27.1 |
| B | 2 | 9 | 340 | 11.36 | 100 | 96 | 21.5 |
| B | 3 | 80 | 280 | 8.57 | 100 | 96 | 21.5 |
| B | 2 | 8 | 264 | 7.82 | 100 | 96 | 21.5 |
| C | 1 | 81 | 357 | 9.34 | 100 | 95 | 28.0 |
| C | 1 | 80 | 339 | 8.7 | 100 | 95 | 28.0 |
| C | 3 | 203 | 303 | 7.42 | 100 | 95 | 28.0 |
| D | 10 | 113 | 262 | 6.6 | 93 | 85 | 26.8 |
| D | 6 | 231 | 252 | 6.23 | 93 | 85 | 26.8 |
| D | 4 | 160 | 251 | 6.19 | 93 | 85 | 26.8 |
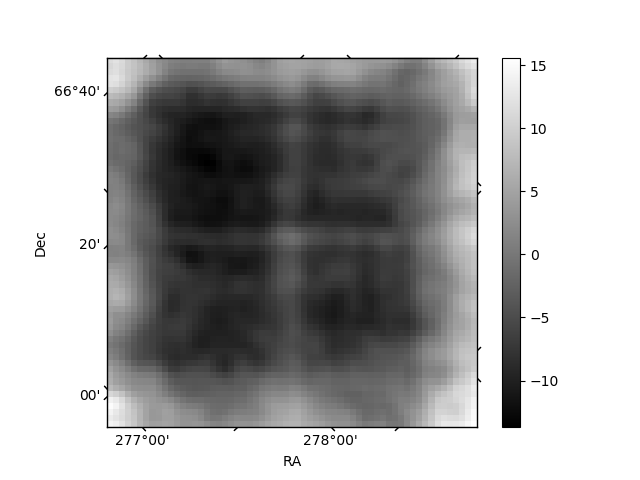
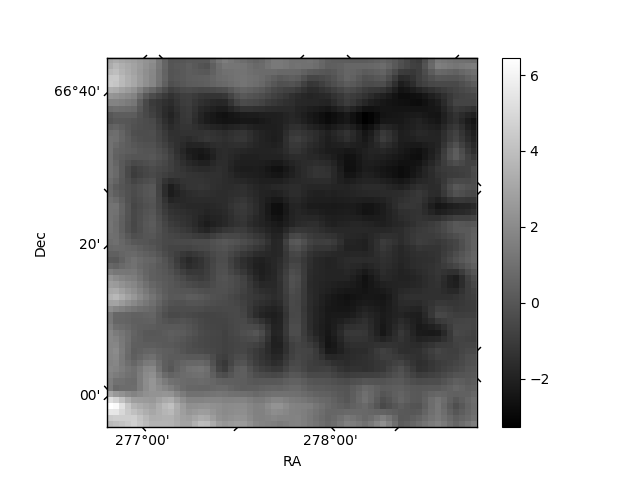
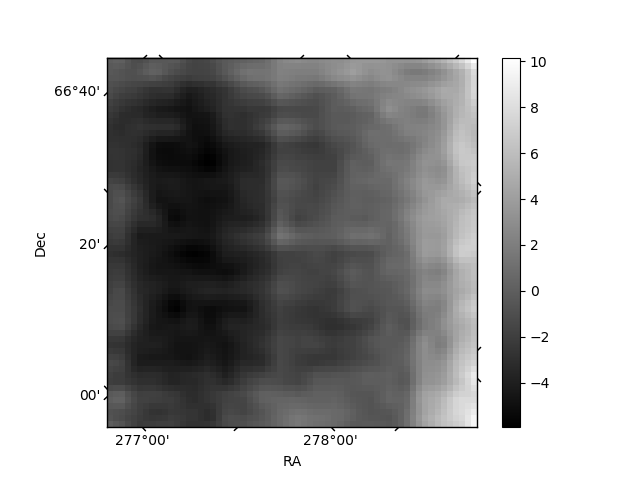
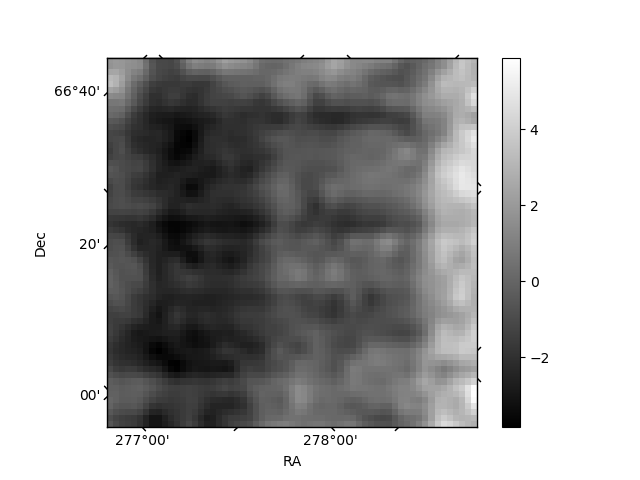
Histogram calculated using DETX and DETY for each event in the final _common_clean file
| Quadrant A | 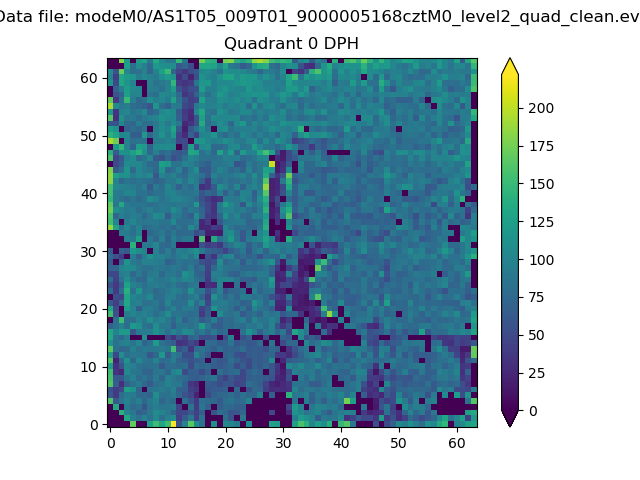 |
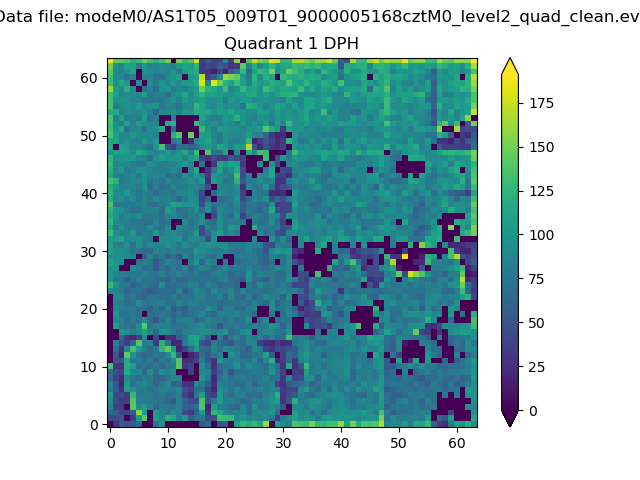 |
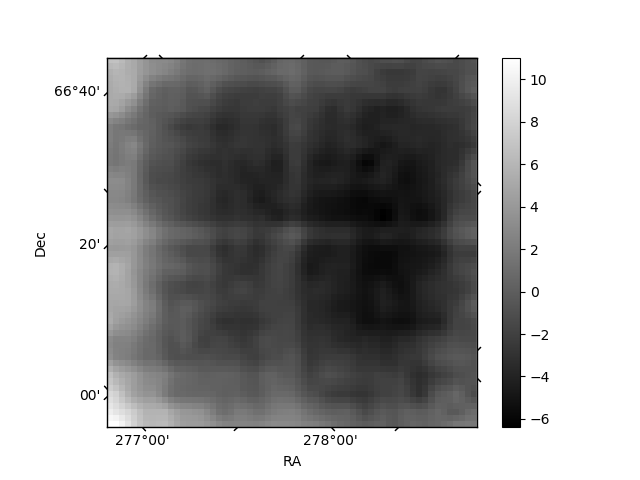
Quadrant B |
|---|---|---|---|
| Quadrant D | 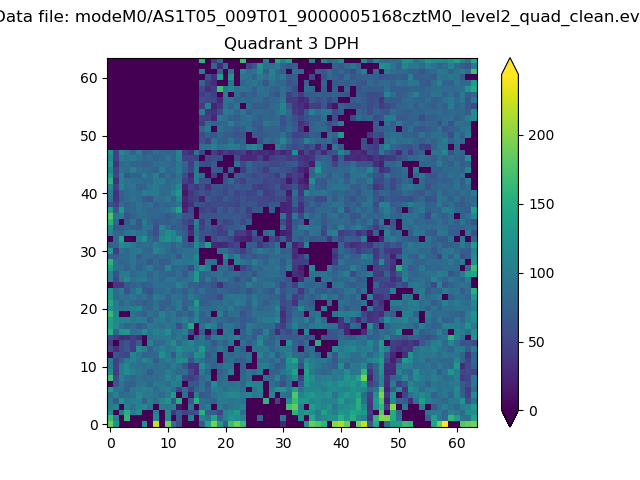 |
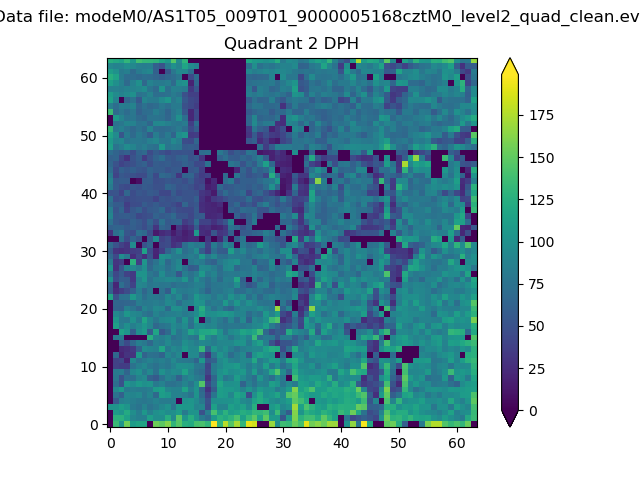 |
Quadrant C |
| Plot type | Count rate plots | Images |
|---|---|---|
| Comparison with Poisson distribution Blue bars denote a histogram of data divided into 1 sec bins. Red curve is a Poisson curve with rate = median count rate of data. |
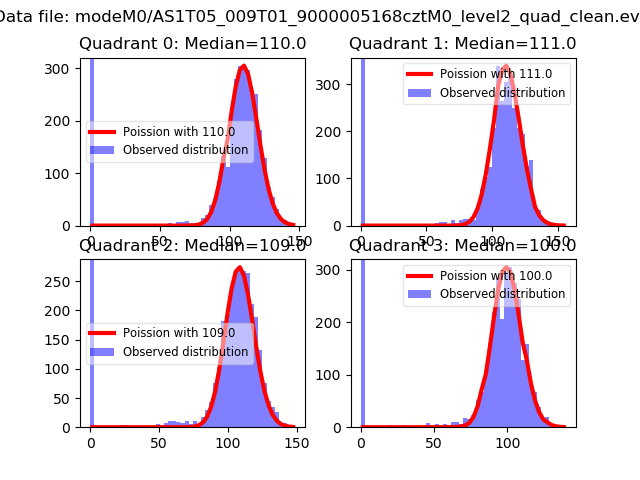 |
 |
| Quadrant-wise count rates Data is divided into 100 sec bins |
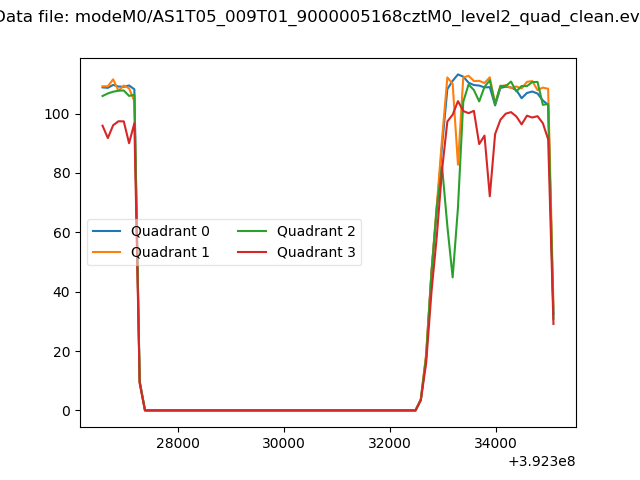 |
|
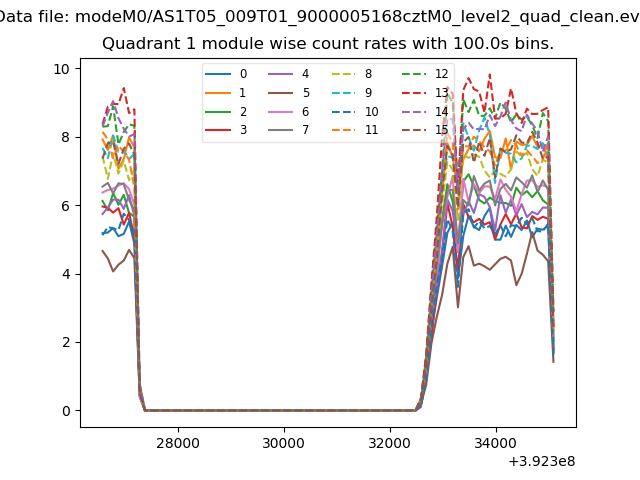
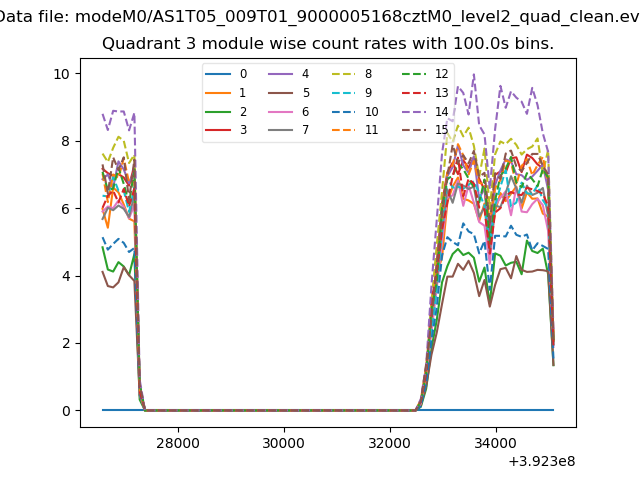
| Module-wise count rates for Quadrant A Data is divided into 100 sec bins |
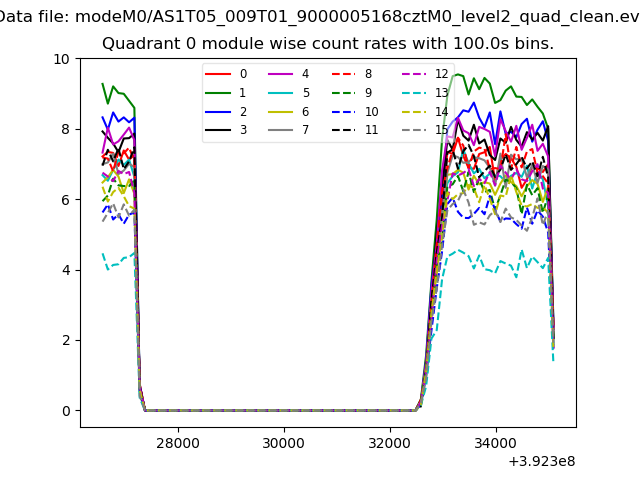 |
 |
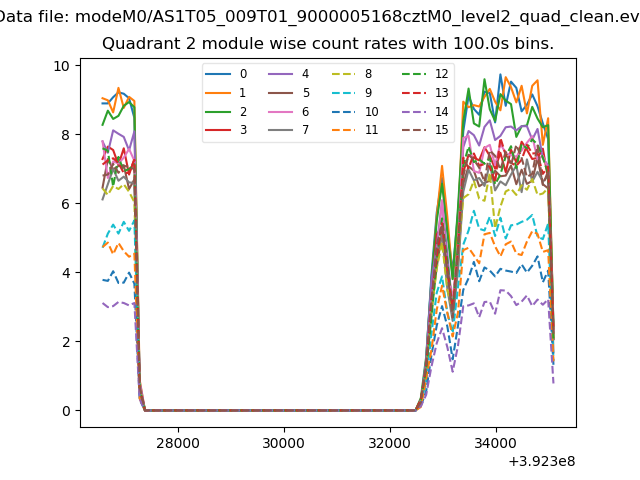
| Module-wise count rates for Quadrant B Data is divided into 100 sec bins |
 |
 |
| Module-wise count rates for Quadrant C Data is divided into 100 sec bins |
 |
 |
| Module-wise count rates for Quadrant D Data is divided into 100 sec bins |
 |
 |
| Parameter | Plot |
|---|---|
| CZT HV Monitor | 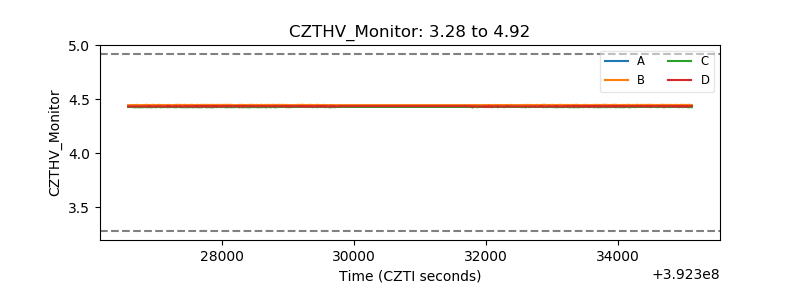 |
| D_VDD | 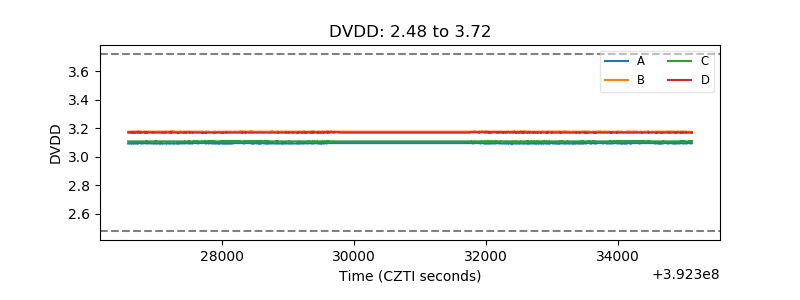 |
| Temperature 1 | 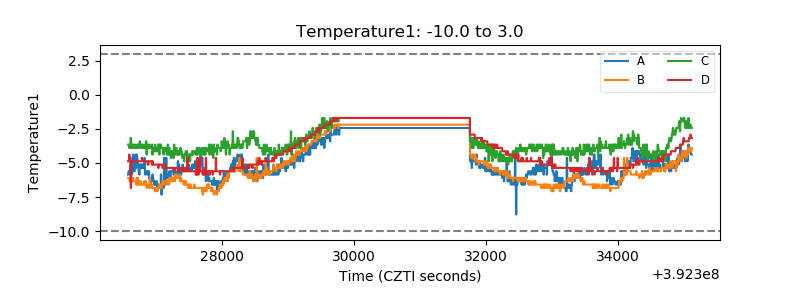 |
| Veto HV Monitor | 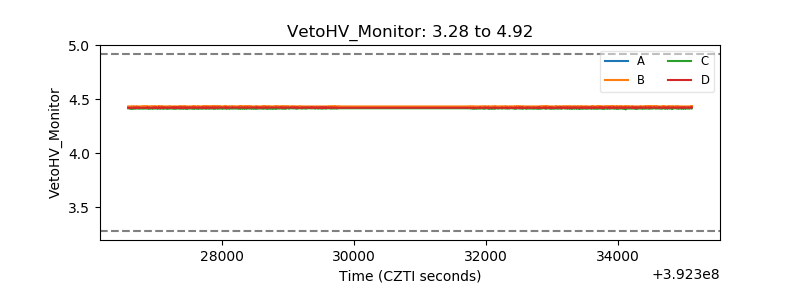 |
| Veto LLD | 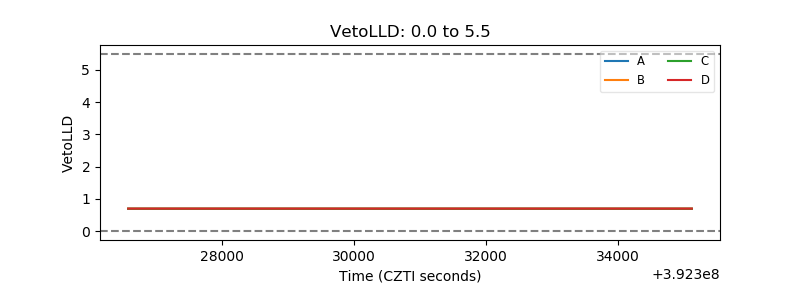 |
| Alpha Counter | 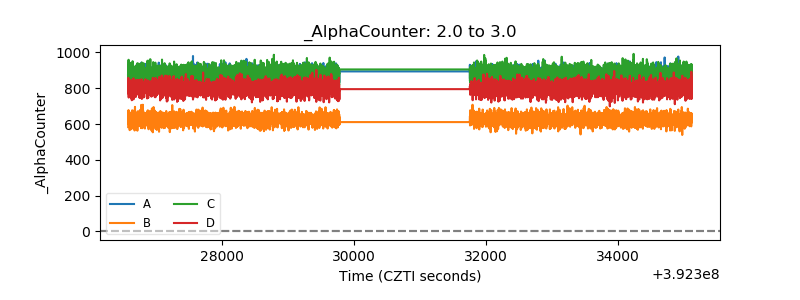 |
| _CPM_Rate | 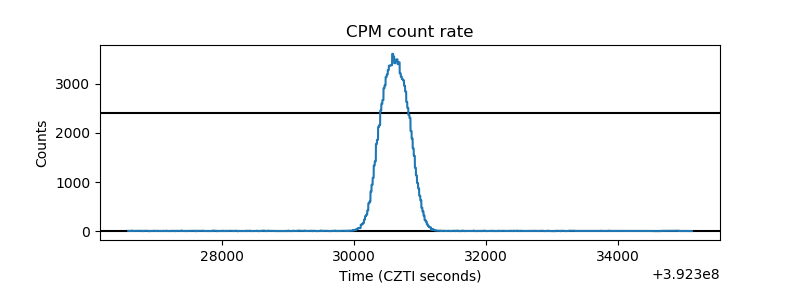 |
| CZT Counter | 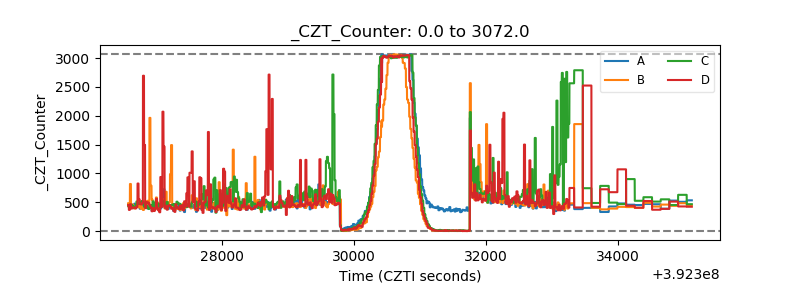 |
| +2.5 Volts monitor | 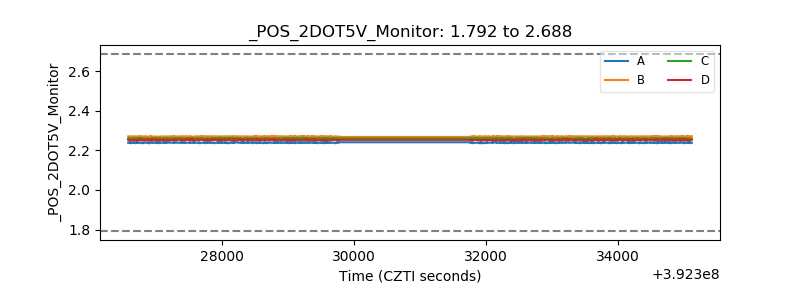 |
| +5 Volts monitor | 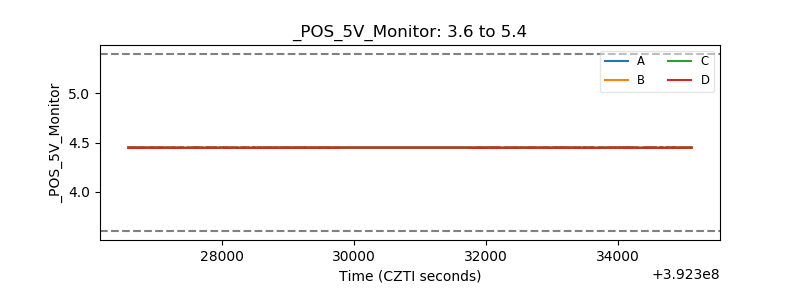 |
| _ROLL_ROT | 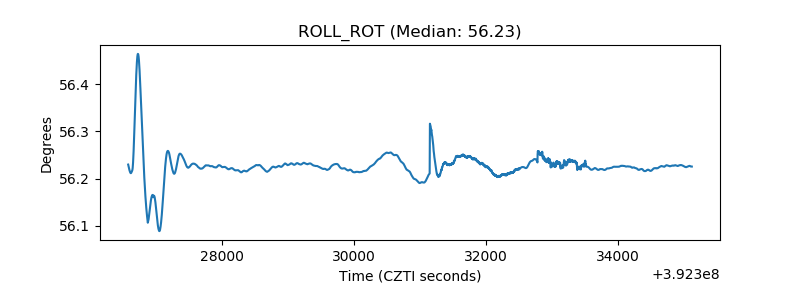 |
| _Roll_DEC | 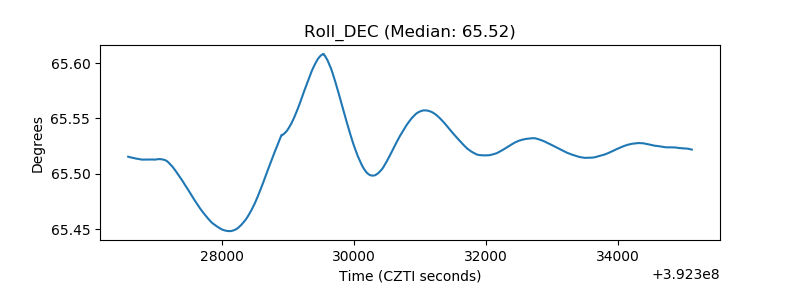 |
| _Roll_RA | 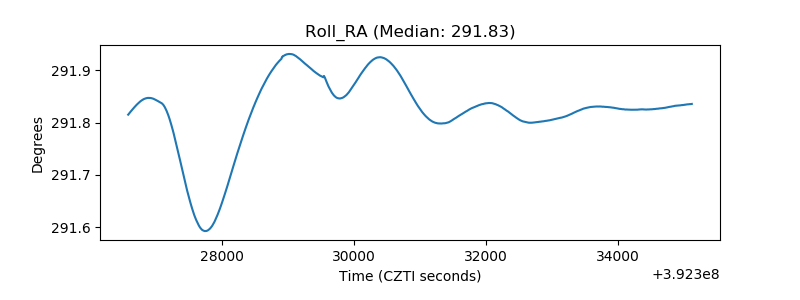 |
| Veto Counter | 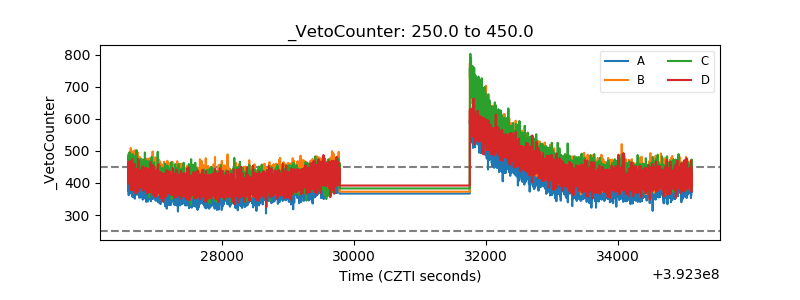 |